. 2023 Mar 16;11(3):920.
doi: 10.3390/biomedicines11030920.

Effect of Ouabain on Glutamate Transport in the Hippocampus of Rats with LPS-Induced Neuroinflammation

Affiliations

Effect of Ouabain on Glutamate Transport in the Hippocampus of Rats with LPS-Induced Neuroinflammation

Israel José Pereira Garcia et al. Biomedicines. .

Abstract

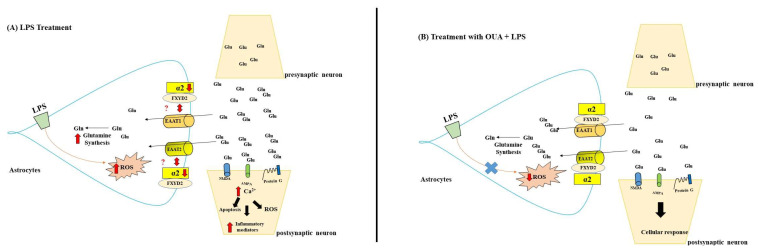
A lipopolysaccharide (LPS)-induced neuroinflammation rat model was used to study the effects of ouabain (OUA) at low concentrations, which can interact with the Na,K-ATPase, causing the modulation of intracellular signalling pathways in the Central Nervous System. Our study aimed to analyse the effects of OUA on glutamate transport in the hippocampus of rats with LPS-induced neuroinflammation. Adult male Wistar rats were divided into four groups: OUA (1.8 µg/kg), saline (CTR), LPS (200 µg/kg), and OUA + LPS (OUA 20 min before LPS). The animals were sacrificed after 2 h, and the hippocampus was collected for analysis. After treatment, we determined the activities of Na,K-ATPase and glutamine synthetase (GS). In addition, expression of the α1, α2, and α3 isoforms of Na,K-ATPase and the glutamate transporters, EAAT1 and EAAT2, were also analysed. Treatment with OUA caused a specific increase in the α2 isoform expression (~20%), whereas LPS decreased its expression (~22%), and treatment with OUA before LPS prevented the effects of LPS. Moreover, LPS caused a decrease of approximately 50% in GS activity compared with that in the CTR group; however, OUA pre-treatment attenuated this effect of LPS. Notably, it was found that treatment with OUA caused an increase in the expression of EAAT1 (~30%) and EAAT2 (~25%), whereas LPS caused a decrease in the expression of EAAT1 (~23%) and EAAT2 (~25%) compared with that in the CTR group. When treated with OUA, the effects of LPS were abrogated. In conclusion, the OUA pre-treatment abolished the effect caused by LPS, suggesting that this finding may be related to the restoration of the interaction between FXYD2 and the studied membrane proteins.

Keywords: EAATs; FXYD2; K-ATPase; LPS; Na; glutamate; hippocampus; ouabain.


Conflict of interest statement

The authors declare no conflict of interest.

Figures

Figure 1
Figure 1
Diagrammatic representation of treatment chronology. All administration was performed via i.p. injection.
Figure 2
Figure 2
Na,K-ATPase activity in the hippocampus of rats treated with LPS and/or OUA. (A) Total Na,K-ATPase activity. (B) Activity of the α1 isoform of Na,K-ATPase. (C) Activity of the α2 and α3 isoforms of Na,K-ATPase. Red Circle—CTR group; Purple square—OUA group; Green Up Triangle—LPS Group; Orange downward triangle—OUA + LPS group. Data are presented as mean ± SEM (n = 5 per group) expressed as nmol/mg/min protein. Data were statistically evaluated using a one-way ANOVA followed by the Newman–Keuls post hoc test, and p < 0.05 was considered statistically significant.
Figure 3
Figure 3
Western blot of the α isoform of Na,K-ATPase in the hippocampus of rats treated with LPS and/or OUA. (A) Western blot and densitometry analysis (arbitrary units of the α1/β-actin ratio). (B) Western blot and densitometry analysis (arbitrary units of α2/β-actin ratio). (C) Western blot and densitometry analysis (arbitrary units of α3/β-actin ratio). Red Circle-CTR group; Purple square-OUA group; Green Up Triangle-LPS Group; Orange downward triangle-OUA + LPS group. Data are presented as mean ± SEM, n = 5 per group. Data were statistically evaluated using a one-way ANOVA followed by the Newman–Keuls post hoc test, and p < 0.05 was considered statistically significant. * significantly different in comparison to control and # significantly different in comparison with LPS.
Figure 4
Figure 4
Glutamine synthase activity in the hippocampus of rats treated with LPS and/or OUA. Data are expressed as mean ± SEM of five animals. Red Circle-CTR group; Purple square-OUA group; Green Up Triangle-LPS Group; Orange downward triangle-OUA + LPS group. Results were analysed using a one-way analysis of variance (ANOVA) followed by the Newman–Keuls post hoc test, and p < 0.05 was considered statistically significant. * significantly different in comparison to control and # significantly different in comparison to the LPS group.
Figure 5
Figure 5
Western blotting of EAATs in the hippocampus of rats treated with LPS and/or OUA. (A) EAAT1 expression in rat hippocampal cell membrane. (B) EAAT2 expression in rat hippocampal cell membrane. Red Circle-CTR group; Purple square-OUA group; Green Up Triangle-LPS Group; Orange downward triangle-OUA + LPS group. Data are expressed as mean ± SEM (n = 5 per group). Results were analysed using a one-way analysis of variance (ANOVA) followed by the Newman–Keuls post hoc test, and p < 0.05 was considered statistically significant. * significantly different in comparison to control # significantly different in comparison to the LPS group.
Figure 6
Figure 6
FXYD2 interaction with α1, α2, α3, EAAT1, and EAAT2 in the hippocampus of rats treated with LPS and/or OUA. Western blot (WB) for α1, α2, α3, EAAT1, and EAAT2 in rat hippocampal cell membrane fraction (n = 5).
Figure 7
Figure 7
Scheme summarising the main modulated effects of OUA and LPS on rat hippocampus. (A) Effects caused by LPS. (B) Effects caused by OUA treatment after LPS-induced neuroinflammation in rats. Glu, glutamate; LPS, lipopolysaccharide; OUA, ouabain; ER, endoplasmic reticulum; GS, glutamine synthetase; SERCA, calcium ATPase sarcoplasmic reticulum membrane; NKA, Na,K-ATPase; Ca2+, calcium; ROS, reactive oxygen species; and TLR4, toll-like receptor 4.

References

    1. Brown G.C., Neher J.J. Inflammatory neurodegeneration and mechanisms of microglial killing of neurons. Mol. Neurobiol. 2010;41:242–247. doi: 10.1007/s12035-010-8105-9. - DOI - PubMed
    1. Wang W.Y., Tan M.S., Yu J.T., Tan L. Role of pro-inflammatory cytokines released from microglia in Alzheimer’s disease. Ann. Transl. Med. 2015;3:136. doi: 10.3978/j.issn.2305-5839.2015.03.49. - DOI - PMC - PubMed
    1. Arias-Salvatierra D., Silbergeld E.K., Acosta-Saavedra L.C., Calderon-Aranda E.S. Role of nitric oxide produced by iNOS through NF-κB pathway in migration of cerebellar granule neurons induced by Lipopolysaccharide. Cell. Signal. 2011;23:425–435. doi: 10.1016/j.cellsig.2010.10.017. - DOI - PubMed
    1. Leow-Dyke S., Allen C., Denes A., Nilsson O., Maysami S., Bowie A.G., Rothwell N.J., Pinteaux E. Neuronal Toll-like receptor 4 signaling induces brain endothelial activation and neutrophil transmigration in vitro. J. Neuroinflamm. 2012;9:230. doi: 10.1186/1742-2094-9-230. - DOI - PMC - PubMed
    1. Liu T., Zhang L., Joo D., Sun S.C. NF-κB signaling in inflammation. Signal Transduct. Target. Ther. 2017;2:17023. doi: 10.1038/sigtrans.2017.23. - DOI - PMC - PubMed

LinkOut - more resources