. 2023 Mar 10;12(6):870.
doi: 10.3390/cells12060870.

Knocking Down CDKN2A in 3D hiPSC-Derived Brown Adipose Progenitors Potentiates Differentiation, Oxidative Metabolism and Browning Process

Affiliations

Knocking Down CDKN2A in 3D hiPSC-Derived Brown Adipose Progenitors Potentiates Differentiation, Oxidative Metabolism and Browning Process

Yasmina Kahoul et al. Cells. .

Abstract

Human induced pluripotent stem cells (hiPSCs) have the potential to be differentiated into any cell type, making them a relevant tool for therapeutic purposes such as cell-based therapies. In particular, they show great promise for obesity treatment as they represent an unlimited source of brown/beige adipose progenitors (hiPSC-BAPs). However, the low brown/beige adipocyte differentiation potential in 2D cultures represents a strong limitation for clinical use. In adipose tissue, besides its cell cycle regulator functions, the cyclin-dependent kinase inhibitor 2A (CDKN2A) locus modulates the commitment of stem cells to the brown-like type fate, mature adipocyte energy metabolism and the browning of adipose tissue. Here, using a new method of hiPSC-BAPs 3D culture, via the formation of an organoid-like structure, we silenced CDKN2A expression during hiPSC-BAP adipogenic differentiation and observed that knocking down CDKN2A potentiates adipogenesis, oxidative metabolism and the browning process, resulting in brown-like adipocytes by promoting UCP1 expression and beiging markers. Our results suggest that modulating CDKN2A levels could be relevant for hiPSC-BAPs cell-based therapies.

Keywords: 3D culture; CDKN2A; UCP1; adipocytes; brown adipose progenitor; browning; human induced pluripotent stem cells; thermogenesis.


Conflict of interest statement

The authors declare no conflict of interest.

Figures

Figure 1
Figure 1
Protocol of hiPSC-BAP differentiation into adipospheres. hiPSC-BAPs were plated into low adherent plates (ULA) and transfected with the control siRNA or the CDKN2A siRNA. Three days (D-3) after, spheroids formed and then were induced to undergo differentiation into adipospheres. Confoncal images are shown. Blue: DAPI for nuclei staining. Red: Oil Red O for lipid droplets staining. Scale: 50 µm. RNA-Seq and Pamgene analyses were performed at day 0 (D0) and day 10 (D10).
Figure 2
Figure 2
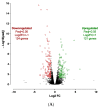
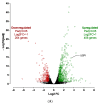
Transcriptomic analysis of 10 days-differentiated 3D adipospheres (D10 vs. D0). (A) A volcano-plot of differentially regulated gene expression. UCP1 is indicated in black. Enrichment of IPA biological process terms for down-regulated (B) and up-regulated (C) genes following differentiation. IPA terms are plotted against the negative log of corrected p-values. Most down-regulated (B) and up-regulated (C) enriched pathways.
Figure 3
Figure 3
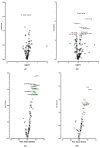
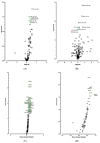
Kinome analysis in 10 days-differentiated 3D adipospheres (D10 vs. D0). Volcano-plots of STK (A), PTK (B)-modulated peptides and STK (C), PTK (D)-modulated kinases. Green circle: hyperphosphorylated peptide (A). Red circle: hypophosphorylated peptide (A,B) and kinase (C,D). Dark circle: unmodulated peptide (A,B) and kinase (C,D).
Figure 3
Figure 3
Kinome analysis in 10 days-differentiated 3D adipospheres (D10 vs. D0). Volcano-plots of STK (A), PTK (B)-modulated peptides and STK (C), PTK (D)-modulated kinases. Green circle: hyperphosphorylated peptide (A). Red circle: hypophosphorylated peptide (A,B) and kinase (C,D). Dark circle: unmodulated peptide (A,B) and kinase (C,D).
Figure 4
Figure 4
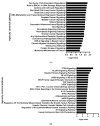
Enrichment of IPA biological process terms for kinome analysis in 10 days-differentiated 3D adipospheres (D10 vs. D0). IPA terms are plotted against the negative log of corrected p-values. Most modulated enriched pathways in STK (A) and in PTK (B).
Figure 5
Figure 5
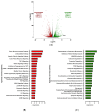
Transcriptomic analysis at spheroid stages of differentiation (D0) between CDKN2A-deficient and control hiPSC-BAPs. (A) A volcano-plot of differentially regulated gene expression. Enrichment of IPA biological process terms for down-regulated (B) and up-regulated (C) genes of CDKN2A-deficient D0 spheroids. IPA terms are plotted against the negative log of corrected p-values. Most down-regulated (B) and up-regulated (C) enriched pathways.
Figure 5
Figure 5
Transcriptomic analysis at spheroid stages of differentiation (D0) between CDKN2A-deficient and control hiPSC-BAPs. (A) A volcano-plot of differentially regulated gene expression. Enrichment of IPA biological process terms for down-regulated (B) and up-regulated (C) genes of CDKN2A-deficient D0 spheroids. IPA terms are plotted against the negative log of corrected p-values. Most down-regulated (B) and up-regulated (C) enriched pathways.
Figure 6
Figure 6
Kinome analysis at spheroid stages of differentiation (D0) between CDKN2A-deficient and control hiPSC-BAPs. Volcano-plots of STK (A), PTK (B)-modulated peptides and STK (C), PTK (D)-modulated kinases. Green circle: hyperphosphorylated peptide (B) and kinase (C,D). Red circle: hypophosphorylated peptide (A,B). Dark circle: unmodulated peptide (A,B) and kinase (C,D).
Figure 7
Figure 7
Enrichment of IPA biological process terms for kinome analysis at spheroid stages of differentiation (D0) between CDKN2A-deficient and control hiPSC-BAPs. IPA terms are plotted against the negative log of corrected p-values. Most modulated enriched pathways in STK (A) and in PTK (B).
Figure 8
Figure 8
Transcriptomic analysis in 10 days-differentiated (D10) 3D adipospheres following siCDKN2A silencing performed at the progenitor stage 3 days before differentiation. (A) A volcano-plot of differentially regulated gene expression. UCP1 is indicated in black. Enrichment of IPA biological process terms for down-regulated (B) and up-regulated (C) genes of CDKN2A-deficient D10 adipospheres. IPA terms are plotted against the negative log of corrected p-values. Most down-regulated (B) and up-regulated (C) enriched pathways.
Figure 8
Figure 8
Transcriptomic analysis in 10 days-differentiated (D10) 3D adipospheres following siCDKN2A silencing performed at the progenitor stage 3 days before differentiation. (A) A volcano-plot of differentially regulated gene expression. UCP1 is indicated in black. Enrichment of IPA biological process terms for down-regulated (B) and up-regulated (C) genes of CDKN2A-deficient D10 adipospheres. IPA terms are plotted against the negative log of corrected p-values. Most down-regulated (B) and up-regulated (C) enriched pathways.
Figure 9
Figure 9
Kinome analysis in 10 days-differentiated (D10) 3D adipospheres following siCDKN2A silencing performed at the progenitor stage 3 days before differentiation. Volcano-plots illustrating STK (A), PTK (B)-modulated peptides and STK (C), PTK (D)-modulated kinases. Green circle: hyperphosphorylated peptide (A,B) and kinase (C,D). Red circle: hypophosphorylated peptide (B). Dark circle: unmodulated peptide (A,B) and kinase (C,D).
Figure 10
Figure 10
Enrichment of IPA biological process terms for kinome analysis in 10 days-differentiated (D10) 3D adipospheres following siCDKN2A silencing performed at the progenitor stage 3 days before differentiation. IPA terms are plotted against the negative log of corrected p-values. Most modulated enriched pathways in STK (A) and in PTK (B).
Figure 11
Figure 11
Effects on silencing CDKN2A expression during hiPSC-BAP adipogenic differentiation in a 3D model: from spheroids (D0) to adipospheres (D10).

Similar articles

Cited by

References

    1. Qasim A., Turcotte M., de Souza R.J., Samaan M.C., Champredon D., Dushoff J., Speakman J.R., Meyre D. On the Origin of Obesity: Identifying the Biological, Environmental and Cultural Drivers of Genetic Risk among Human Populations. Obes. Rev. 2018;19:121–149. doi: 10.1111/obr.12625. - DOI - PubMed
    1. Goodpaster B.H., Sparks L.M. Metabolic Flexibility in Health and Disease. Cell Metab. 2017;25:1027–1036. doi: 10.1016/j.cmet.2017.04.015. - DOI - PMC - PubMed
    1. Herz C.T., Kiefer F.W. Adipose Tissue Browning in Mice and Humans. J. Endocrinol. 2019;241:R97–R109. doi: 10.1530/JOE-18-0598. - DOI - PubMed
    1. Kajimura S., Spiegelman B.M., Seale P. Brown and Beige Fat: Physiological Roles beyond Heat Generation. Cell Metab. 2015;22:546–559. doi: 10.1016/j.cmet.2015.09.007. - DOI - PMC - PubMed
    1. Wu J., Boström P., Sparks L.M., Ye L., Choi J.H., Giang A.-H., Khandekar M., Virtanen K.A., Nuutila P., Schaart G., et al. Beige Adipocytes Are a Distinct Type of Thermogenic Fat Cell in Mouse and Human. Cell. 2012;150:366–376. doi: 10.1016/j.cell.2012.05.016. - DOI - PMC - PubMed

Publication types

MeSH terms

Substances