Review
. 2023 Mar 15;12(6):900.
doi: 10.3390/cells12060900.

Domain Architecture of the Nonreceptor Tyrosine Kinase Ack1

Affiliations
Review

Domain Architecture of the Nonreceptor Tyrosine Kinase Ack1

Yagmur Kan et al. Cells. .

Abstract

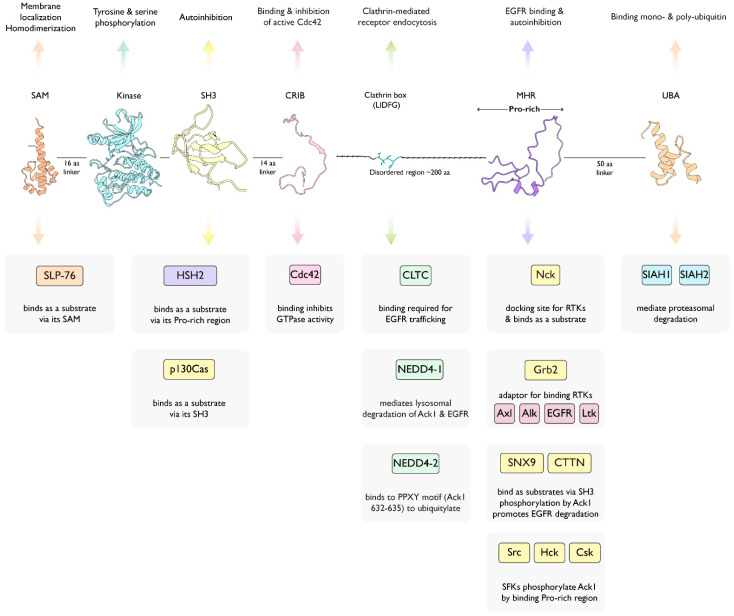
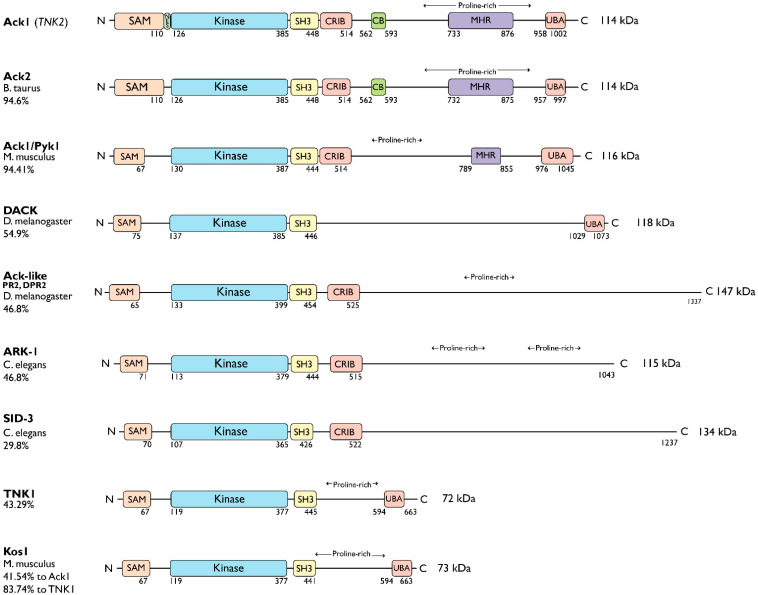
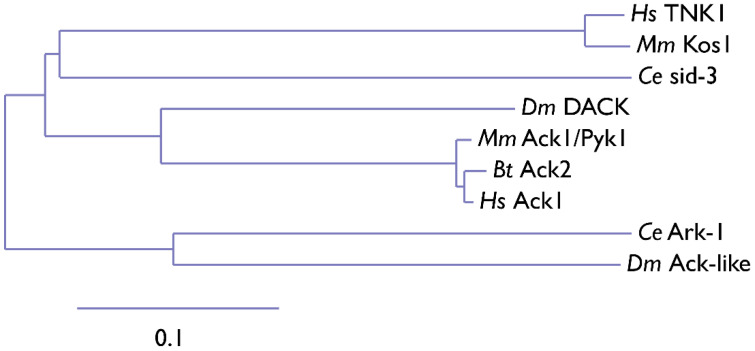
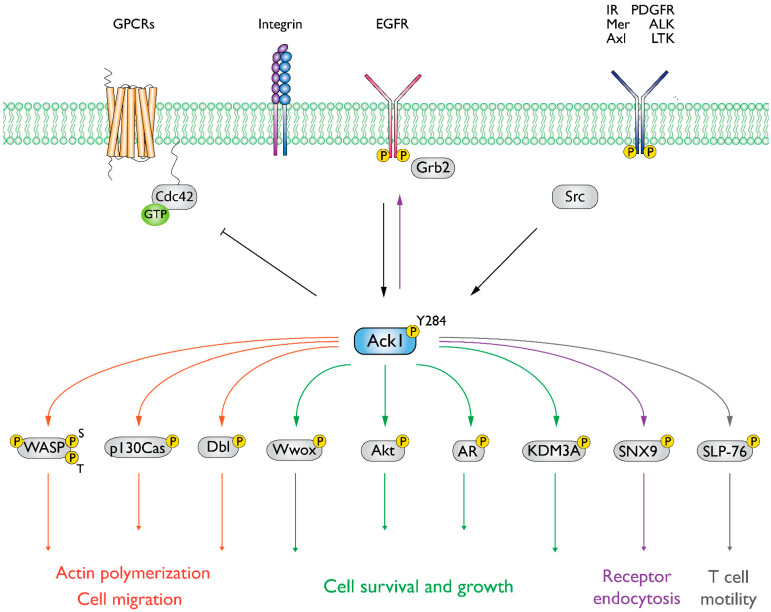
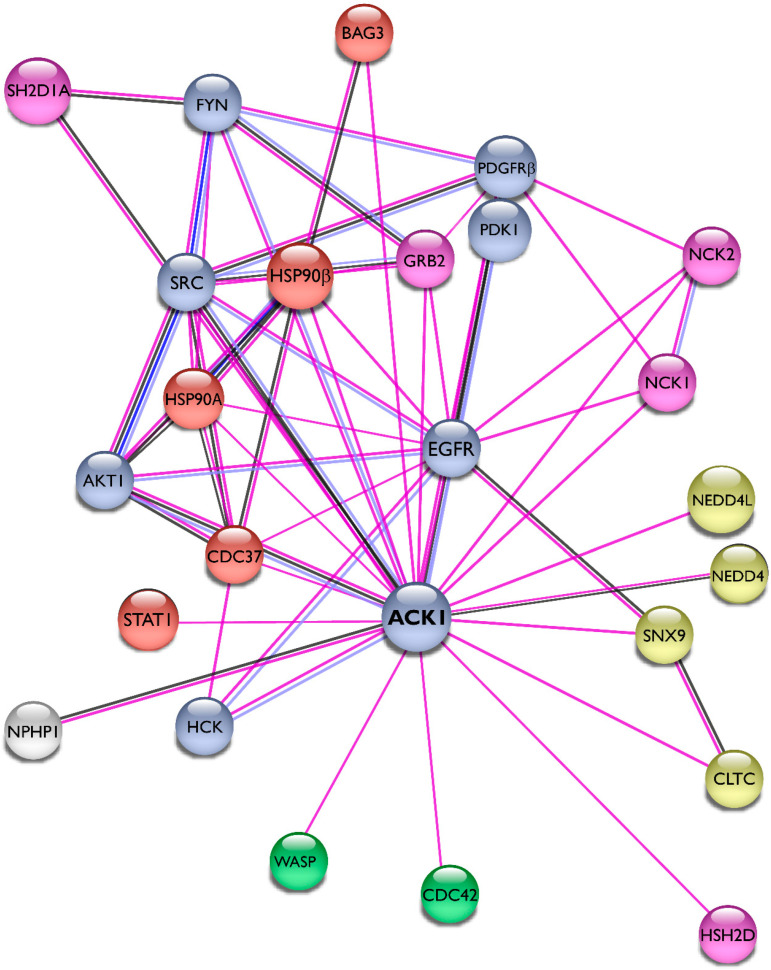
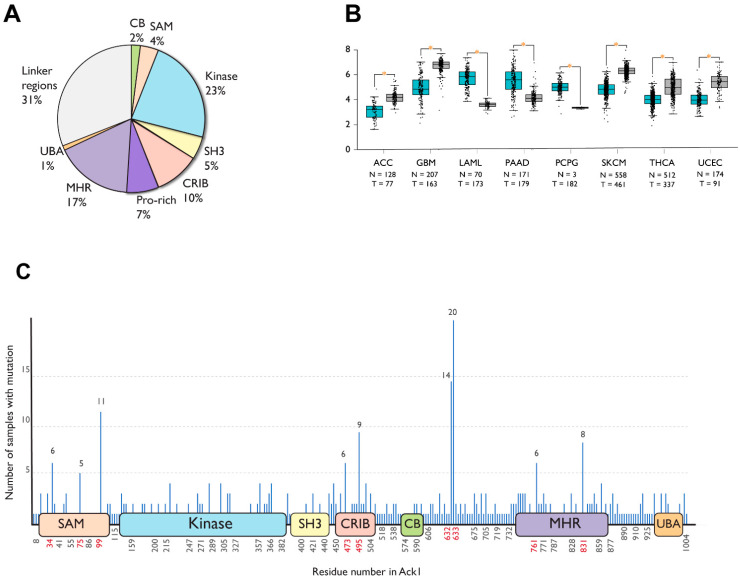
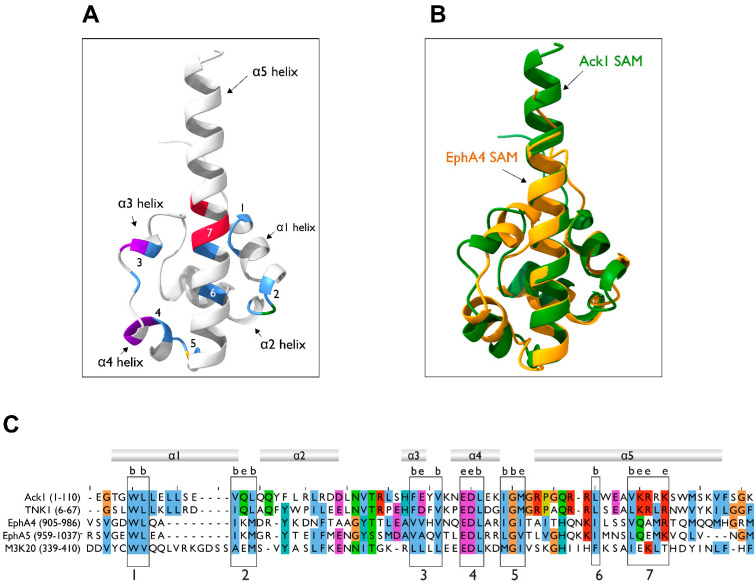
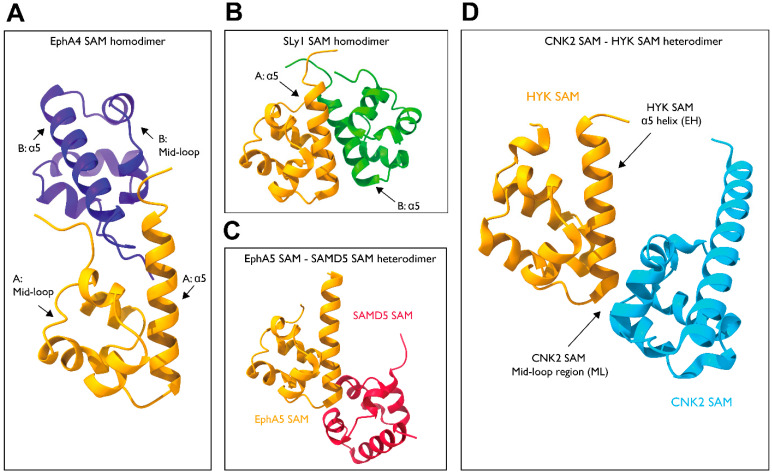
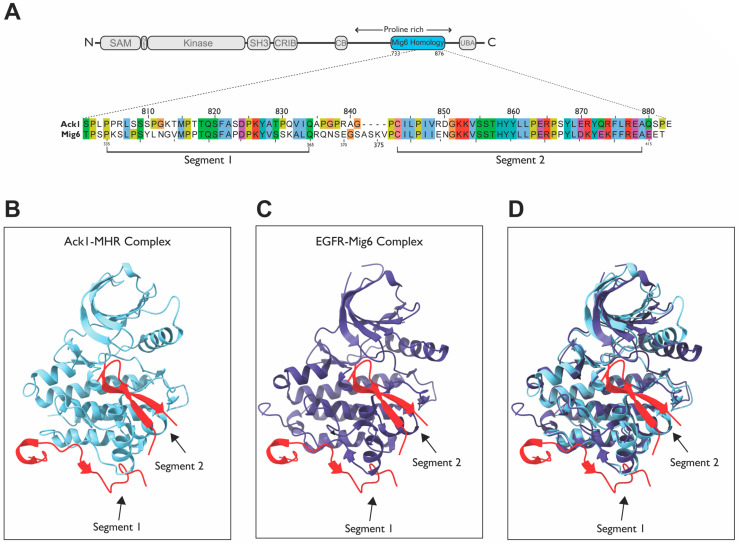
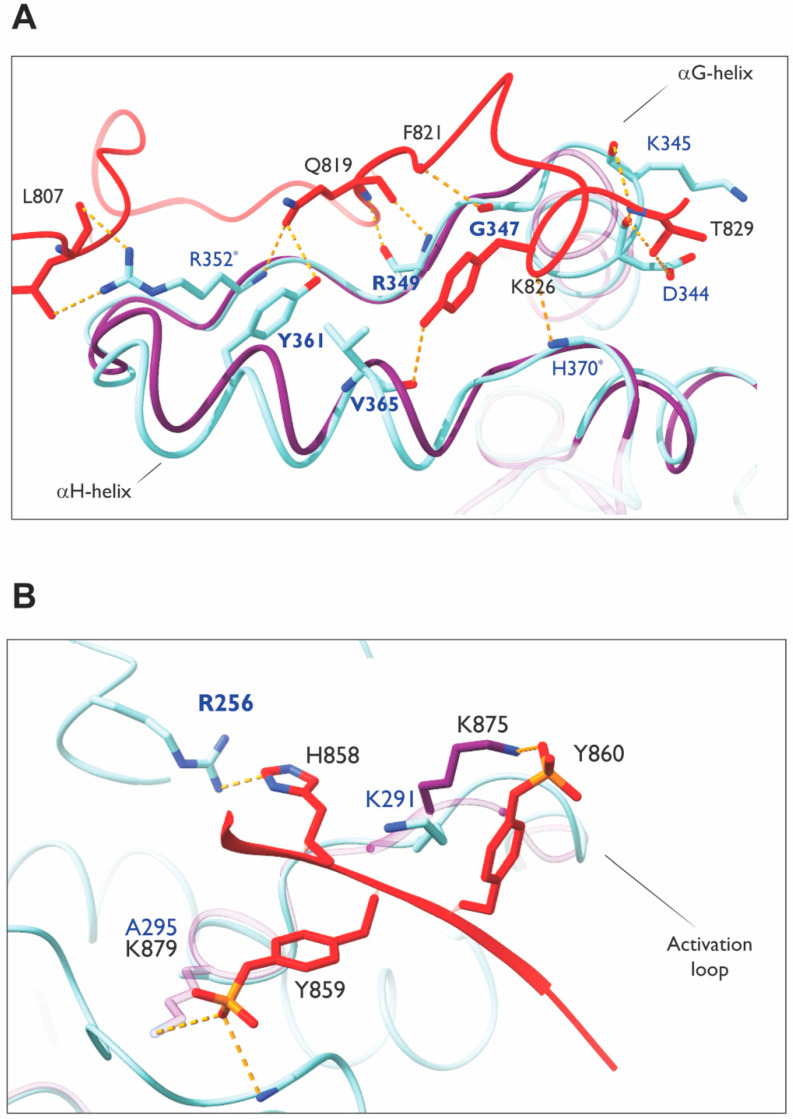
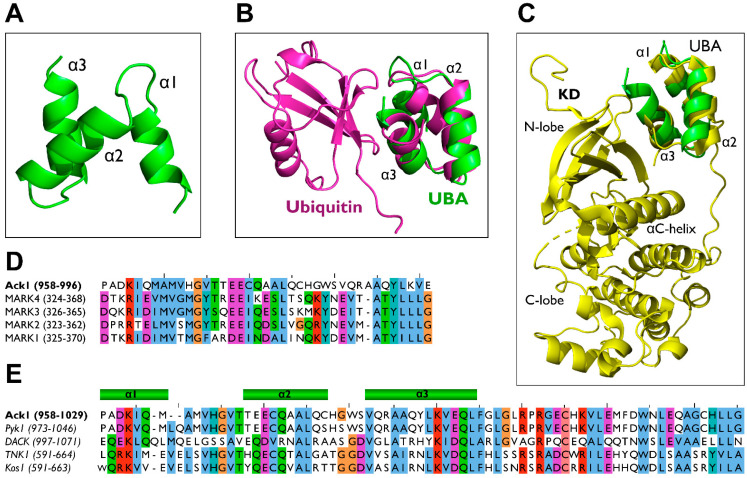
The nonreceptor tyrosine kinase (NRTK) Ack1 comprises a distinct arrangement of non-catalytic modules. Its SH3 domain has a C-terminal to the kinase domain (SH1), in contrast to the typical SH3-SH2-SH1 layout in NRTKs. The Ack1 is the only protein that shares a region of high homology to the tumor suppressor protein Mig6, a modulator of EGFR. The vertebrate Acks make up the only tyrosine kinase (TK) family known to carry a UBA domain. The GTPase binding and SAM domains are also uncommon in the NRTKs. In addition to being a downstream effector of receptor tyrosine kinases (RTKs) and integrins, Ack1 can act as an epigenetic regulator, modulate the degradation of the epidermal growth factor receptor (EGFR), confer drug resistance, and mediate the progression of hormone-sensitive tumors. In this review, we discuss the domain architecture of Ack1 in relation to other protein kinases that possess such defined regulatory domains.

Keywords: Ack1; SAM domain; activated Cdc42-associated kinase; nonreceptor tyrosine kinase; ubiquitin-associated domain.


Conflict of interest statement

The authors declare no conflict of interest.

Figures

Figure 15
Figure 15
Graphical summary of known Ack1-protein interactions mapped onto a linear diagram of Ack1 domain structure. SAM, sterile alpha motif; SH3, Src homology 3; CRIB, Cdc42, and Rac-interactive binding; MHR, Mig6 homology region; UBA, ubiquitin-associated domain. Linker regions are designated disordered according to UniProtKB (Q07912) and AlphaFold prediction. Interacting proteins are color-coded according to the nature of the interaction such that the SH3-mediated are in yellow, the Pro-rich is purple, and the SAM-mediated is orange. Details of these interactions are as follows: SLP-76 [40], HSH2 [119], p130Cas [159], Cdc42 [134], Clathrin heavy chain (CLTC) [6], NEDD4-1 [85], NEDD4-2 [160], Nck [6], Grb2 [161], SNX9 [162], Cortactin (CTTN) [163], Src and Hck [106], Csk [164], SIAH1 [151], and SIAH2 [165].
Figure 1
Figure 1
Ack family kinases. Linear representation of Ack family members. The residue numbers below each domain depict the boundaries of the domains retrieved from the UniProtKB [10]. SAM, sterile alpha motif; NES, nuclear export signal; CRIB, Cdc42, and Rac-interactive binding (CRIB) domain; CB, clathrin-binding motif; proline-rich region; MHR, Mig6 homology region; UBA, ubiquitin-associated domain. The sequence identity between each member and human Ack1 (or TNK1) is indicated to the left of the linear diagram as percentage identity. UniProtKB IDs used to depict the domain arrangements and to determine percent sequence identity are human Ack1, Q07912; bovine Ack2, Q17R13; mouse Ack1/Pyk1, O54967; fruit fly DACK, Q9VZI2; fruit fly Ack-like/DPR2/PR2, Q9I7F7; worm Ark-1, G5EBZ8; worm sid-3, Q10925; human TNK1, Q13470; and mouse TNK1/Kos1, Q99ML2.
Figure 2
Figure 2
Phylogenetic tree of the Ack1 family. Ce, Caenorhabditis elegans (nematode); Dm, Drosophila melanogaster (fruit fly); Bt, Bos taurus (cow); Hs, Homo sapiens (human); Mm, Mus musculus (mouse). The scale indicates the rate of amino acid substitution per residue. The amino acid sequences of the kinase domains of Ack family proteins from C. elegans (sid-3, Ark-1), D. melanogaster (DACK, Ack-like), B. taurus (Ack2), M. musculus (Ack1, Kos1), and H. sapiens (Ack1, TNK1) were used for phylogenetic analysis. The phylogenetic tree was manually compiled using MAFFT, Gblocks, PhyML, and TreeDyn at Phylogeny.fr [17].
Figure 3
Figure 3
Summary of Ack1-mediated signaling events. Ack1 is activated in response to growth factors, G-protein coupled receptors (GPCRs), and integrin-mediated cell adhesion and is recruited to activated RTKs such as platelet-derived growth factor receptor (PDGFR), insulin receptor (IR), Mer, and epidermal growth factor receptor (EGFR) [2,3,25,28,31]. In cancer cells, Ack1 phosphorylates the tumor suppressor Wwox [3] and facilitates uncontrolled activation of pro-proliferative signals (Akt and AR). A detailed discussion of the signaling pathways can be found in the study by Fox et al. [7].
Figure 4
Figure 4
Interaction network of Ack1. Using the STRING database [43], we mapped the Ack1-interacting proteins from Mahajan [44]. Lines are color-coded according to the nature of the association, which is based on experimental evidence (pink), co-expression (dark blue), or protein homology (gray). Nodes are color-coded by function (protein kinases, light blue; adaptor proteins, pink; heat shock protein complex, orange) or signaling networks (actin polymerization, green; receptor endocytosis, yellow).
Figure 5
Figure 5
Cancer-associated mutations in Ack1 in the COSMIC database. (A) Distribution of nonsynonymous mutations. SAM, sterile alpha motif; CRIB, Cdc42, and Rac-interactive binding (CRIB) domain; CB, clathrin-binding motif; proline-rich region; MHR, Mig6 homology region; UBA, ubiquitin-associated domain (B) Ack1 expression in normal (blue) vs. tumor (gray) tissues. ACC: adrenocortical carcinoma, GBM: glioblastoma multiforme, LAML: acute myeloid leukemia, PAAD: pancreatic adenocarcinoma, PCPG: pheochromocytoma, SKCM: skin cutaneous melanoma, THCA: thyroid carcinoma, UCEC: uterine corpus endometrial carcinoma. (C) Locations of cancer-associated mutations outlined in the linear structure of Ack1. SAM, sterile alpha motif; NES, nuclear export signal; CRIB, Cdc42, and Rac-interactive binding (CRIB) domain; clathrin-binding motif; proline-rich region; MHR, Mig6 homology region; UBA, ubiquitin-associated domain. Each horizontal line represents a mutation, with the number of mutations positively correlated with the length depicted on the y-axis. The x-axis shows the location of the mutations. Highly mutated residues are shown in red. Note that the numbering convention used in COSMIC is based on an isoform different from the canonical one (UniProtKB: A0A5F9ZHL4), and that the figure uses the isoform 1 (UniProtKB: Q07912) convention.
Figure 6
Figure 6
Homology modeling of the SAM domain. (A) AlphaFold model of the Ack1 SAM domain. The Ack1 SAM domain is predicted to adopt a typical SAM domain fold, with four short α helices, α1-α4, and a long C-terminal α-helix, α5. Numbers denote the location of the boxes in panel (C). (B) Superimposition of the predicted Ack1 SAM domain and the EphA4 SAM domain (PDB: 1B0X). (C) Multiple sequence alignment of the SAM domains of human Ack1 and TNK1, EphA4, EphA5, and ZAK (M3K20) kinases. The numbers in parentheses denote the residues used as the inputs. Consensus sequences for SAM are highlighted in numbered boxes. The letters b and e denote the residues predicted to be buried or exposed, respectively.
Figure 7
Figure 7
Structure of the SAM–SAM dimers. (A) EphA4-SAM homodimer (PDB: 1B0X). (B) SLy1-SAM homodimer (PDB: 6G8O). (C) EphA5-SAMD5 dimer (PDB: 5ZRZ). (D) CNK2-HYP dimer (PDB: 3BS5).
Figure 8
Figure 8
Structure of Ack1 KD. Crystal structure of active Ack1 (PDB: 4EWH). The bi-lobal fold of the kinase domain is highlighted with the N-lobe in green and the C-lobe in yellow. The universally conserved αC-helix is shown in cyan. The phosphate-binding loop (P-loop) is colored magenta. The activation loop (A-loop, blue) encompasses the DFG motif (red), which contributes to ATP binding. The catalytic loop is shown in orange. The residues comprising the catalytic spine (C-spine) and the regulatory spine (R-spine) are shown in light blue and light purple space-filling sphere models, respectively.
Figure 9
Figure 9
A 3D representation of evolutionarily conserved residues in Ack1 KD. (A) Sequence conservation of Ack1 KD presented as a cartoon diagram from two viewpoints (panel (A) rotated by 180° as panels (B,C)) and determined using the ConSurf server [96,97,98,99,100,101] using the crystal structure of active Ack1 (PDB: 4EWH) as the input. ConSurf assigns each residue with a normalized score of 1 to 9, where 1 indicates the least conserved (highly evolving) sites, and 9 corresponds to the most evolutionarily conserved positions. The conservation scores were mapped onto the Ack1 KD structure (PDB 4EWH) using ConSurf color code, with a cyan-to-maroon gradient corresponding to the variable (1) to conserved (9) positions. The panels depict conserved residues (with a score of 8 or 9) in the space-filling model. (B) The N-lobe rotated by 180° from panel (A). (C) The C-lobe rotated by 180° from panel (A).
Figure 10
Figure 10
Structure of the SH3 domain. (A) Crystal structure of the Abl2 SH3 domain in the ribbon diagram (PDB: 5NP3, light blue). (B) Structure of the Ack1 SH3 domain (PDB: 4HZS, magenta). (C) Sequence alignment of the SH3 domains of human Ack1, Stam2, Lck, Csk, Src, and Abl. The numbers in parentheses denote the residues used as the inputs.
Figure 11
Figure 11
Structure of the Cdc42-CRIB complex. (A) Sequence alignment of the CRIB motifs of human Ack1 and other proteins. Sc, Saccharomyces cerevisiae (budding yeast); Sp, S. pombe (fission yeast); Dm, D. melanogaster; Ce, C. elegans. (B) Structure of apo-Cdc42 (PDB: 1AJE; pale yellow). (C) The PAK-Cdc42 complex (PDB: 1E0A, PAK CRIB, cyan; Cdc42, grey). (D) Ack1-Cdc42 complex (PDB: 1CF4; Ack1 CRIB, green; Cdc42, pink). Switches I and II are highlighted in red.
Figure 12
Figure 12
Sequence and structural comparison of Mig6 and MHR. (A) Sequence alignment between Ack1 and Mig6; (B) ClusPro predicted the Ack1-MHR complex [133,134] (PDB: 4EWH; Ack1, light blue; MHR, red); (C) EGFR-Mig6 complex (PDB: 4ZJV; EGFR, purple; Mig6, red). (D) Overlay of the Ack1-MHR and EGFR-Mig6 complexes from panels (B,C).
Figure 13
Figure 13
Homology modeling of MHR–Ack1 KD. (A) Model showing MHR segment 1 interaction sites with the C-lobe of Ack1 KD. The αH-helix and αG-helix are marked as reference points. Segment 1 of MHR (red) is putatively superimposed on Ack1 KD (light blue) using the crystal structure of EGFR KD (purple) bound to Mig6 (PDB: 4ZJV). The MHR residues are labeled in black; Ack1 KD residues are in navy. The conserved residues between EGFR KD and Ack1 KD are marked in bold. Non-conserved novel interacting partners are marked with an asterisk. (B) Segment 2 interaction sites at the substrate binding site. The activation loop is labeled as a reference point. Segment 2 of MHR (red) is superimposed on Ack1 KD (light blue) using the crystal structure of EGFR KD (purple) bound to Mig6 (PDB: 4ZJV). The MHR residues are labeled in black; Ack1 KD residues are in navy. Hydrogen bonds are depicted in yellow dashed lines. Note that a key lysine in EGFR KD that interacts with Mig6 is not conserved in the Ack1 KD.
Figure 14
Figure 14
Ack1 UBA domain homology modeling. (A) Ack1 UBA domain structure predicted by AlphaFold [86,87] represented in a ribbon diagram (B) Structural alignment of predicted Ack1 UBA domain (green) and the yeast Ede1 UBA-ubiquitin complex (PDB: 2G3Q, magenta) (C) Structural alignment of predicted Ack1 UBA (green) and MARK3 UBA-KD complex (PDB: 2QNJ, yellow). (D) Multiple sequence alignment of the UBA domains of the human Ack1 UBA and MARK families. The numbers in parentheses denote the number of residues in each protein. (E) Multiple sequence alignments of the UBA domains of the Ack1 family: human Ack1, mouse Ack1/Pyk1, fly DACK, human TNK1, and mouse Kos1. The numbers in parentheses denote the residues used as inputs for the alignment.

References

    1. Yang W., Lin Q., Guan J.L., Cerione R.A. Activation of the Cdc42-associated tyrosine kinase-2 (ACK-2) by cell adhesion via integrin beta1. J. Biol. Chem. 1999;274:8524–8530. doi: 10.1074/jbc.274.13.8524. - DOI - PubMed
    1. Galisteo M.L., Yang Y., Ureña J., Schlessinger J. Activation of the nonreceptor protein tyrosine kinase Ack by multiple extracellular stimuli. Proc. Natl. Acad. Sci. USA. 2006;103:9796–9801. doi: 10.1073/pnas.0603714103. - DOI - PMC - PubMed
    1. Mahajan N.P., Whang Y.E., Mohler J.L., Earp H.S. Activated tyrosine kinase Ack1 promotes prostate tumorigenesis: Role of Ack1 in polyubiquitination of tumor suppressor Wwox. Cancer Res. 2005;65:10514–10523. doi: 10.1158/0008-5472.CAN-05-1127. - DOI - PubMed
    1. Mahajan K., Lawrence H.R., Lawrence N.J., Mahajan N.P. ACK1 tyrosine kinase interacts with histone demethylase KDM3A to regulate the mammary tumor oncogene HOXA1. J. Biol. Chem. 2014;289:28179–28191. doi: 10.1074/jbc.M114.584425. - DOI - PMC - PubMed
    1. Mott H.R., Owen D., Nietlispach D., Lowe P.N., Manser E., Lim L., Laue E.D. Structure of the small G protein Cdc42 bound to the GTPase-binding domain of ACK. Nature. 1999;399:384–388. doi: 10.1038/20732. - DOI - PubMed

Publication types

MeSH terms

LinkOut - more resources