Review
. 2023 Mar 10;15(6):1703.
doi: 10.3390/cancers15061703.

Classification of Chondrosarcoma: From Characteristic to Challenging Imaging Findings

Affiliations
Review

Classification of Chondrosarcoma: From Characteristic to Challenging Imaging Findings

Jun-Ho Kim et al. Cancers (Basel). .

Abstract

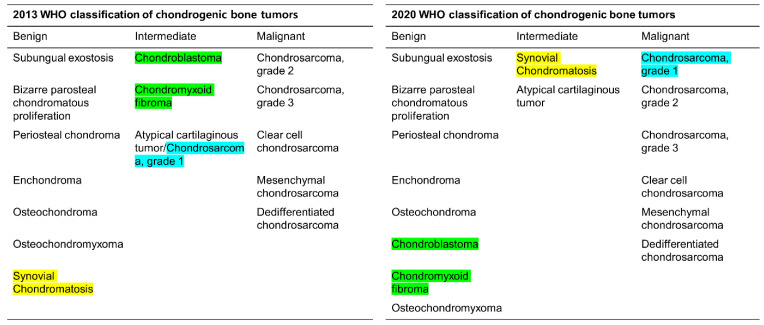
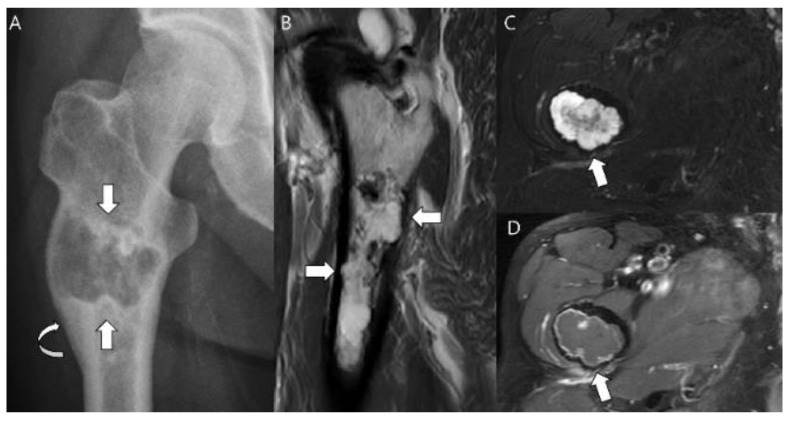
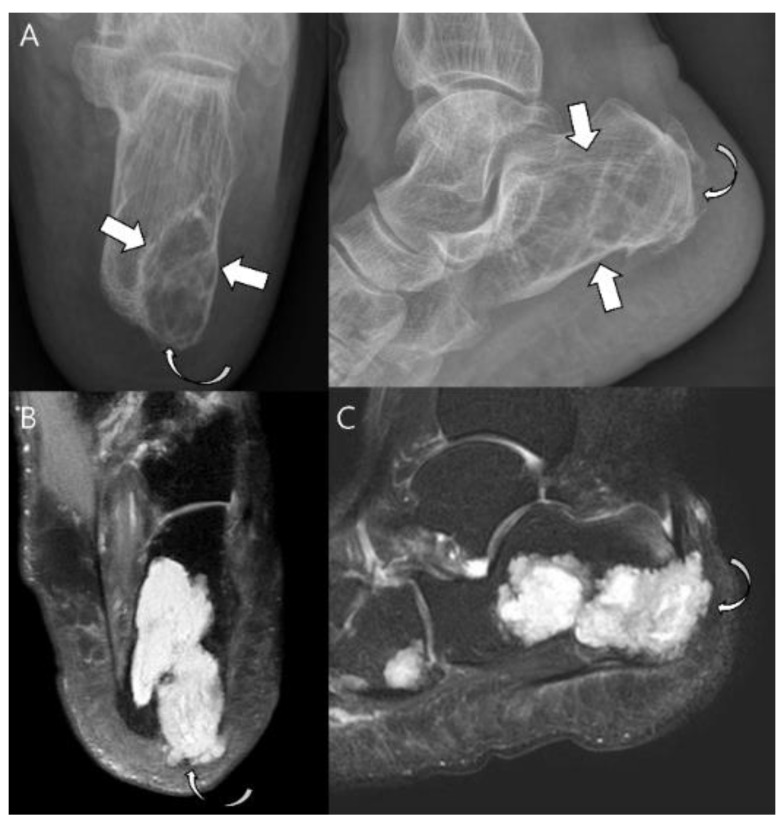
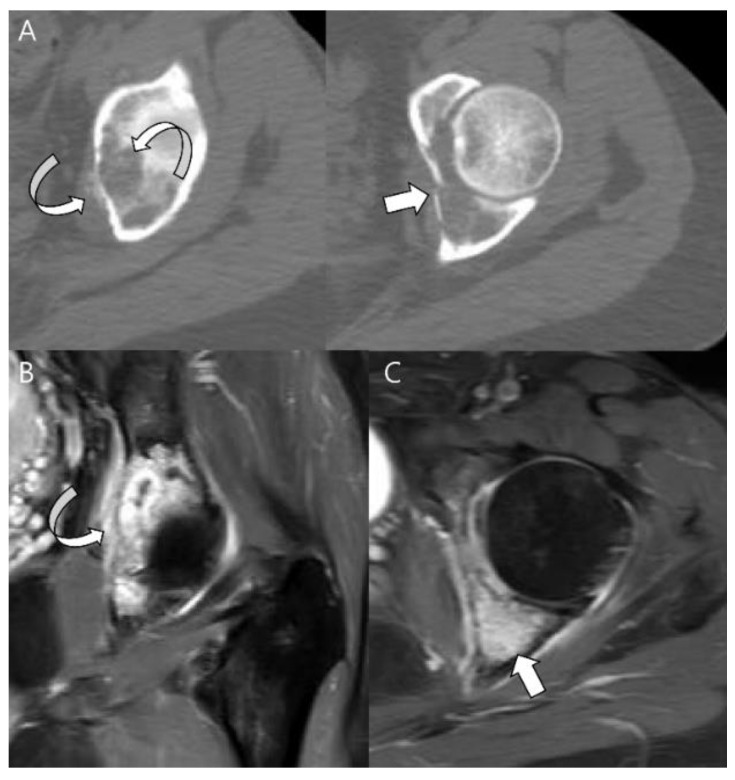
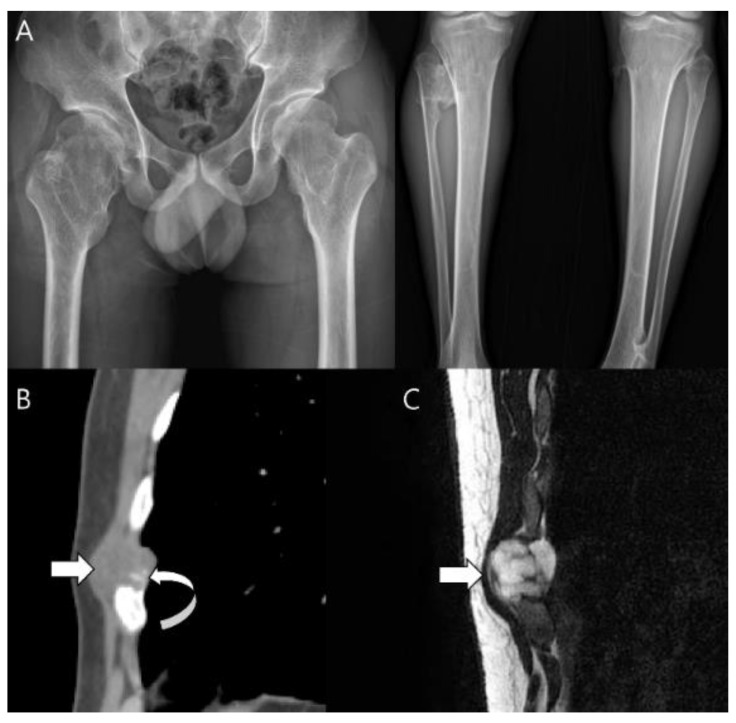
Chondrosarcomas can be classified into various forms according to the presence or absence of a precursor lesion, location, and histological subtype. The new 2020 World Health Organization (WHO) Classification of Tumors of Soft Tissue and Bone classifies chondrogenic bone tumors as benign, intermediate (locally aggressive), or malignant, and separates atypical cartilaginous tumors (ACTs) and chondrosarcoma grade 1 (CS1) as intermediate and malignant tumors. respectively. Furthermore, the classification categorizes chondrosarcomas (including ACT) into eight subtypes: central conventional (grade 1 vs. 2-3), secondary peripheral (grade 1 vs. 2-3), periosteal, dedifferentiated, mesenchymal, and clear cell chondrosarcoma. Most chondrosarcomas are the low-grade, primary central conventional type. The rarer subtypes include clear cell, mesenchymal, and dedifferentiated chondrosarcomas. Comprehensive analysis of the characteristic imaging findings can help differentiate various forms of chondrosarcomas. However, distinguishing low-grade chondrosarcomas from enchondromas or high-grade chondrosarcomas is radiologically and histopathologically challenging, even for experienced radiologists and pathologists.

Keywords: 2020 World Health Organization classification of tumors of soft tissue and bone; atypical cartilaginous tumor; chondrosarcoma; classification; computed tomography; high-grade chondrosarcoma; magnetic resonance imaging; plain radiograph.


Conflict of interest statement

The authors declare no conflict of interest.

Figures

Figure 1
Figure 1
Comparison of the 2013 and 2020 World Health Organization (WHO) classifications of chondrogenic bone tumor. Diseases highlighted are those that are subject to change from 2013 to 2020 WHO classification.
Figure 2
Figure 2
Atypical cartilaginous tumor of the humerus in a 59-year-old woman. Anteroposterior shoulder radiograph shows a mixed lytic and sclerotic lesion in the humerus. The sclerotic component represents typical chondroid ring-and-arc calcification.
Figure 3
Figure 3
Atypical cartilaginous tumor of the distal femur in a 50-year-old woman. (A) Anteroposterior and lateral radiographs reveal a mixed lytic and sclerotic lesion in the distal femur (arrows) with typical ring-and-arc calcifications. (B) Computed tomography and (C) axial T2-weighted image demonstrate a lobulated chondroid tumor with deep endosteal scalloping (curved arrows) despite the small tumor size (1.7 cm).
Figure 4
Figure 4
A typical cartilaginous tumor of the humerus in a 43-year-old woman. (A) Radiographs reveal a mixed lytic and sclerotic lesion in the humerus (arrows) with typical ring-and-arc calcifications. (B) Coronal T2-weighted image with fat suppression and (C) T1-weighted enhanced image demonstrate a lobulated chondroid tumor with longitudinal endosteal scalloping (arrows) along the 9 cm length of the tumor.
Figure 5
Figure 5
Chondrosarcoma grade 2 of the proximal femur in a 71-year-old man. (A) Anteroposterior radiograph reveals a lytic lesion in the proximal femur (arrows) resulting in cortical thickening and periosteal reaction (curved arrow). (B) Sagittal T2-weighted image shows a markedly high-signal lesion with deep endosteal scalloping (arrows). (C) Axial T2-weighted image with fat suppression and (D) axial T1-weighted enhanced image demonstrates a lobulated chondroid tumor with focal bone expansion (arrows).
Figure 6
Figure 6
Atypical cartilaginous tumor of the calcaneus in a 74-year-old woman. (A) Plain radiographs reveal a lytic lesion in the calcaneus (arrows) with a partially destructed cortex (curved arrow). (B) Axial and (C) sagittal T2-weighted images with fat suppression show a lesion with marked high-signal intensity with focal extraosseous soft tissue extension (curved arrows).
Figure 7
Figure 7
High-grade conventional chondrosarcoma of the acetabulum in a 49-year-old woman. (A) Axial CT scans reveal cortical breakage (thin arrow) with extraosseous extension containing matrix mineralization (curved arrow) in the left acetabulum. (B) Axial and (C) axial T1-weighted enhanced images with fat suppression show diffusely enhancing intraosseous (arrow) and extraosseous tumor components (curved arrow).
Figure 8
Figure 8
Secondary peripheral chondrosarcoma of the rib in a 34-year-old man. (A) Hip and tibial plain radiographs reveal underlying multiple exostoses. (B) Sagittal CT scan shows a lobulated mass with soft-tissue density (arrow) arising from the rib containing matrix mineralization (curved arrow), suggestive of a cartilage cap of sessile osteochondroma. (C) Sagittal T2-weighted image shows a mass of 2.3 cm in thickness with high signal intensity (arrow).
Figure 9
Figure 9
Secondary central chondrosarcoma of the humerus in a 19-year-old man. (A) Coronal T2-weighted image and (B) coronal T1-weighted enhanced images with fat suppression show multiple intramedullary chondroid tumors (arrowheads) with peripheral and septal enhancement in the humerus, suggesting enchondromatosis. The major lesion shows bone expansion at the metaphysis (arrow) with peritumoral edema and enhancement (curved arrow). (C) Axial T1-weighted and (D) enhanced images show a peripherally enhancing major lesion (arrow) with cortical remodeling (curved arrow).
Figure 10
Figure 10
Secondary central chondrosarcoma of the humerus in an 81-year-old woman. The residual enchondroma in the red box (narrow scalloping) is combined with the additional features of chondrosarcoma in the blue box (cortical thinning and deep scalloping).
Figure 11
Figure 11
Periosteal chondrosarcoma grade 1 of the humerus in a 66-year-old man. (A) Radiograph shows a juxtacortical mass with Codman’s triangles (arrow) in the humerus. Note the associated cortical thinning (curved arrow). (B) Coronal and (C) axial T2-weighted images with fat suppression show a juxtacortical mass with high signal intensity and lobular margins (arrows). The mass has caused cortical erosion (curved arrow) but no evident marrow invasion.
Figure 12
Figure 12
Clear cell chondrosarcoma of the distal femur in a 31-year-old man. (A) Axial CT scan shows an osteolytic lesion with a thin sclerotic margin at the distal femur (arrow). (B) Sagittal T1-weighted enhanced image with fat suppression shows a heterogeneously enhancing lesion with mild peritumoral enhancement at the distal femoral epiphysis (curved arrows).
Figure 13
Figure 13
Dedifferentiated chondrosarcoma of the humerus in a 54-year-old man. (A) Plain radiograph shows an extensive mixed lytic and sclerotic lesion in the humerus with endosteal scalloping (arrow). Note the chondral-type mineralization in the intramedullary cavity (arrowhead) and the densely osteoid-type mineralization at the juxtacortical area (curved arrow). (B) Axial CT scan also reveals the intramedullary chondral-type (arrowhead) and the juxtacortical dense osteoid-type (curved arrow) mineralization. (C) Coronal T2-weighted images with fat suppression show high signal intramedullary lesion (arrows) with osteoblastic extraosseous extension (curved arrow), suggesting a dedifferentiated component of osteosarcoma.
Figure 14
Figure 14
Extraskeletal myxoid chondrosarcoma of the right thigh in a 46-year-old man. (A) Axial CT scan reveals a lobulated, low-density soft tissue mass (arrows) without chondral-type mineralization between the vastus lateralis and biceps femoris muscles extending to the subcutaneous fat layer (arrowhead). (B,C) Axial T2-weighted and T1-weighted enhanced images show a soft tissue mass with high signal intensity and peripheral rim and septal enhancement.
Figure 15
Figure 15
Atypical cartilaginous tumor of the proximal femur in a 22-year-old man. (A) Axial CT scan reveals a low-density intramedullary mass with chondral-type mineralization (arrow) in the proximal femur. (B,C) Coronal T2-weighted fat-suppressed and T1-weighted enhanced images show an intramedullary mass of 3 cm in size with high signal intensity and the peripheral rim and septal enhancement. Note the peritumoral edema with enhancement (curved arrows).
Figure 16
Figure 16
Birmingham Atypical Cartilaginous Tumor Imaging Protocol applied to cartilage lesions in the proximal humerus and around the knee [79]. (A) Cartilage lesion < 4 cm, focal endosteal scalloping ≤10% or 36° of lesion circumference on the axial image with the greatest involvement; generalized endosteal scalloping ≥10% or 36° of lesion circumference on the axial image with the greatest involvement; MRI change = increase in longitudinal length of lesion ≥1 cm and/or development of aggressive features including increasing endosteal scalloping. (B) Cartilage lesion > 4 cm. (C) Cartilage lesion of any size with aggressive features (bone expansion and/or cortical thickening, periostitis, cortical destruction, and soft tissue mass).
Figure 17
Figure 17
A 35-year-old man presenting with wrist pain. (A) Plain radiographs reveal a lobulated lytic lesion with chondroid matrix mineralization (arrowhead) and bone expansion (arrows) in the distal radius. (B,C) Coronal and sagittal T2-weighted fat-suppressed images show an intramedullary high signal mass with deep and extensive endosteal scalloping (arrowheads) and bone expansion (arrows). (D) Axial T1-weighted enhanced image shows peripheral rim and septal enhancement. Note the volar cortical thinning or defect (curved arrow). This lesion was noted as an atypical cartilaginous tumor at the initial incisional biopsy but was revealed as chondrosarcoma grade 2 at extended curettage.
Figure 18
Figure 18
Chondrosarcoma grade 2 of the scapula in a 58-year-old man. (A) Plain radiograph shows a lobulated intramedullary mass with chondral-type mineralization and bone expansion (arrows) in the scapular body. (B) Axial and sagittal CT scans show a large intramedullary mass with cortical destruction (curved arrows). (C) Coronal and axial T2-weighted images show focal extraosseous soft tissue masses (arrows).
Figure 19
Figure 19
Atypical cartilaginous tumor of the humerus in an 81-year-old woman. (A) Plain radiograph demonstrates an intramedullary mass with prominent chondroid matrix mineralization (arrows) in the humerus. (B) Coronal T1-weighted image shows a lobulated intramedullary mass with areas of entrapped medullary fat (arrowheads).

References

    1. Murphey M.D., Walker E.A., Wilson A.J., Kransdorf M.J., Temple H.T., Gannon F.H. From the archives of the AFIP: Imaging of primary chondrosarcoma: Radiologic-pathologic correlation. Radiographics. 2003;23:1245–1278. doi: 10.1148/rg.235035134. - DOI - PubMed
    1. Marco R.A.W., Gitelis S., Brebach G.T., Healey J.H. Cartilage tumors: Evaluation and treatment. Am. Acad. Orthop. Surg. 2000;8:292–304. doi: 10.5435/00124635-200009000-00003. - DOI - PubMed
    1. Ahmed A.R., Tan T.-S., Unni K.K., Collins M.S., Wenger D.E., Sim F.H. Secondary chondrosarcoma in osteochondroma: Report of 107 patients. Clin. Orthop. Relat. Res. 2003;411:193–206. doi: 10.1097/01.blo.0000069888.31220.2b. - DOI - PubMed
    1. Altay M., Bayrakci K., Yildiz Y., Erekul S., Saglik Y. Secondary chondrosarcoma in cartilage bone tumors: Report of 32 patients. J. Orthop. Sci. 2007;12:415–423. doi: 10.1007/s00776-007-1152-z. - DOI - PubMed
    1. Douis H., Saifuddin A. The imaging of cartilaginous bone tumours. II. Chondrosarcoma. Skelet. Radiol. 2013;42:611–626. doi: 10.1007/s00256-012-1521-3. - DOI - PubMed

LinkOut - more resources