Review
. 2023 Feb 23;25(3):408.
doi: 10.3390/e25030408.

Tsallis q-Statistics in Seismology

Affiliations
Review

Tsallis q-Statistics in Seismology

Leonardo Di G Sigalotti et al. Entropy (Basel). .

Abstract

Non-extensive statistical mechanics (or q-statistics) is based on the so-called non-additive Tsallis entropy. Since its introduction by Tsallis, in 1988, as a generalization of the Boltzmann-Gibbs equilibrium statistical mechanics, it has steadily gained ground as a suitable theory for the description of the statistical properties of non-equilibrium complex systems. Therefore, it has been applied to numerous phenomena, including real seismicity. In particular, Tsallis entropy is expected to provide a guiding principle to reveal novel aspects of complex dynamical systems with catastrophes, such as seismic events. The exploration of the existing connections between Tsallis formalism and real seismicity has been the focus of extensive research activity in the last two decades. In particular, Tsallis q-statistics has provided a unified framework for the description of the collective properties of earthquakes and faults. Despite this progress, our present knowledge of the physical processes leading to the initiation of a rupture, and its subsequent growth through a fault system, remains quite limited. The aim of this paper was to provide an overview of the non-extensive interpretation of seismicity, along with the contributions of the Tsallis formalism to the statistical description of seismic events.

Keywords: Tsallis q-entropy; complex systems; earthquakes; non-extensive statistical mechanics; seismicity.


Conflict of interest statement

The authors declare no conflict of interest. The funders had no role in the design of the study; in the collection, analyses, or interpretation of data; in the writing of the manuscript, or in the decision to publish the results.

Figures

Figure 1
Figure 1
Schematic drawing showing two fault blocks with rough surfaces moving relative to fragmentary material between them. The motion of the blocks between points a and b in the figure is hindered by the presence of fragments. Here r and r denote the size of the fragments. The white arrows indicate motion of the blocks and the black ones indicate motion of the fragments. From Sotolongo-Costa and Posadas [36] (their Figure 1).
Figure 2
Figure 2
Temporal variation of the qM-index (solid line) over increasing cumulative time windows and the associated standard deviation (dashed lines). The vertical line on the right marks the date of the Kobe earthquake (Japan). From Papadakis et al. [66] (their Figure 3).
Figure 3
Figure 3
Cumulative distribution of the number of earthquakes as a function of magnitude for the seismicity in Iran (red squares) and California (blue diamonds). Fitting curves for the Iranian data (dashed line) and the Californian data (dotted line) were obtained using the q-stretched exponential cumulative distribution given by Equation (55). From Darooneh and Mehri [38] (their Figure 1). (Online version in color).
Figure 4
Figure 4
Normalized cumulative magnitude distribution function for MMthr=1 (open circles) and the model of Equation (49) (blue solid line) for the seismicity of the West Corinth rift, Greece. The dashed line represents the GR scaling relation (1) for b=1.51. From Michas et al. [55] (their Figure 5a). (Online version in color).
Figure 5
Figure 5
Frequency–magnitude distribution of the number of earthquakes as a function of magnitude for the seismicity in the volcanic field of the Yellowstone National Park for the period 1996–2016. The red solid line draws the best fit to the observed data (squares) using Equation (49). The dashed-line curves represent 95% confidence intervals. From Chochlaki et al. [41] (their Figure 10). (Online version in color).
Figure 6
Figure 6
Time evolution of the non-extensive indices q and r regarding the preparatory process of the 2004 Sumatra–Andaman (magnitude 9.0) and the 2011 Honshu (magnitude 9.1) mega-earthquakes. From Vallianatos and Sammonds [35] (their Figure 2). (Online version in color).
Figure 7
Figure 7
Time variation of the entropic indices qM and qT for the raw (top) and a declustered San Andreas Fault catalog (bottom). The error bars refer to 95% confidence intervals and the vertical dashed lines indicate the occurrence of earthquakes with local magnitude 5.9. From Efstathiou et al. [69] (their Figure 6).
Figure 8
Figure 8
(Left) Cumulative distribution P(>T) as given by Equation (63) (solid line) and ordinary exponential (dashed line) for the entire dataset of the earthquake activity in the western Corinth rift (open circles) and for MMc (crosses). (Right) q-exponential function, Gamma distribution as given by Equation (64) and q-generalized Gamma distribution as given by Equation (65) (dashed line) compared to the same observed data of the left frame. From Michas et al. [55] (their Figures 6a and 7b). (Online version in color).
Figure 9
Figure 9
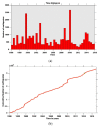
(a) Seismicity rate and (b) cumulative number of earthquakes in the Yellowstone volcanic field from 1996 to 2016. All events with M>Mc=1.5 are included. From Chochlaki et al. [41] (their Figure 2). (Online version in color).
Figure 10
Figure 10
Time variation of the entropic q-index at several sliding windows after the occurrence of the M7.8 earthquake on 22 December 2010. A precursory increase of q is observed prior to the Tohoku M9.0 mega-earthquake on 12 March 2011. From Varotsos et al. [110] (their Figure 7). (Online version in color).
Figure 11
Figure 11
Normalized Tsallis entropy, Sq, for 25 segments of the time series of the 10 kHz magnetic field strength associated with the 7 Sepetember 1999 M5.9 Athens earthquake for varying values of the q-index. The yellow bars indicate the values of entropy far from the time of earthquake occurrence, while the green and red bars with lower entropies are indicative of higher degrees of organization and correspond to values of the entropy closer to the earthquake occurrence. From Kalimeri et al. [43] (their Figure 4). (Online version in color).

References

    1. Telesca L., Lapenna V., Macchiato M. Spatial variability of the time-correlated behaviour in Italian seismicity. Earth Planet. Sci. Lett. 2003;212:279–290. doi: 10.1016/S0012-821X(03)00286-3. - DOI
    1. Huang Q. Seismicity changes prior to the Ms8.0 Wenchuan earthquake in Sichuan, China. Geophys. Res. Lett. 2008;35:L23308. doi: 10.1029/2008GL036270. - DOI
    1. Lennartz S., Livina V.N., Bunde A., Havlin S. Long-term memory in earthquakes and the distribution of interoccurrence times. EPL. 2008;81:69001. doi: 10.1209/0295-5075/81/69001. - DOI
    1. Telesca L., Lovallo M. Non-uniform scaling features in central Italy seismicity: A non-linear approach in investigating seismic patterns and detection of possible earthquake precursors. Geophys. Res. Lett. 2009;36:L01308. doi: 10.1029/2008GL036247. - DOI
    1. Lennartz S., Bunde A., Turcotte D.L. Modelling seismic catalogues by cascade models: Do we need long-term magnitude correlations? Geophys. J. Int. 2011;184:1214–1222. doi: 10.1111/j.1365-246X.2010.04902.x. - DOI

LinkOut - more resources