. 2023 Mar 7;24(6):5081.
doi: 10.3390/ijms24065081.

Exosomal miRNA Biomarker Panel for Pancreatic Ductal Adenocarcinoma Detection in Patient Plasma: A Pilot Study

Affiliations

Exosomal miRNA Biomarker Panel for Pancreatic Ductal Adenocarcinoma Detection in Patient Plasma: A Pilot Study

Amy Makler et al. Int J Mol Sci. .

Abstract

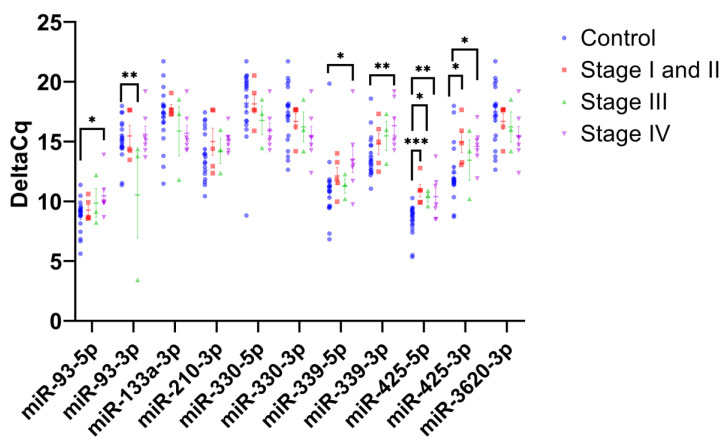
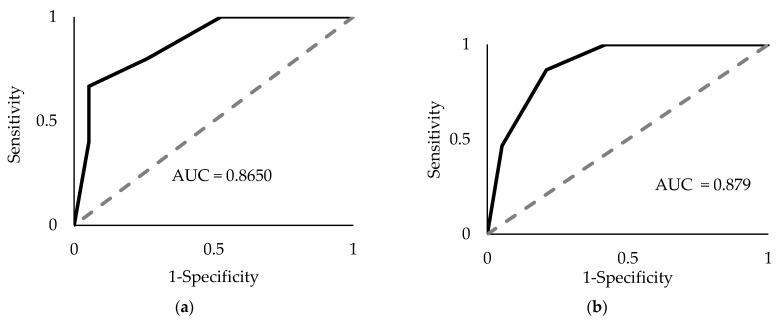
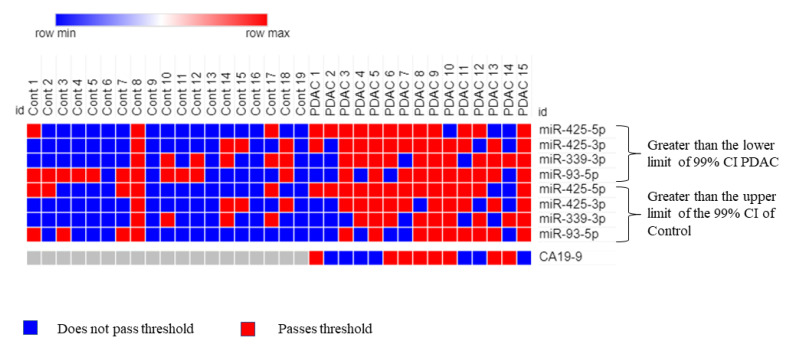
Pancreatic ductal adenocarcinoma (PDAC) is rapidly becoming one of the leading causes of cancer-related deaths in the United States, and with its high mortality rate, there is a pressing need to develop sensitive and robust methods for detection. Exosomal biomarker panels provide a promising avenue for PDAC screening since exosomes are highly stable and easily harvested from body fluids. PDAC-associated miRNAs packaged within these exosomes could be used as diagnostic markers. We analyzed a series of 18 candidate miRNAs via RT-qPCR to identify the differentially expressed miRNAs (p < 0.05, t-test) between plasma exosomes harvested from PDAC patients and control patients. From this analysis, we propose a four-marker panel consisting of miR-93-5p, miR-339-3p, miR-425-5p, and miR-425-3p with an area under the curve (AUC) of the receiver operator characteristic curve (ROC) of 0.885 with a sensitivity of 80% and a specificity of 94.7%, which is comparable to the CA19-9 standard PDAC marker diagnostic.

Keywords: biomarker panel; diagnostics; exosomes; microRNA; pancreatic ducal adenocarcinoma; plasma.


Conflict of interest statement

The authors declare no conflict of interest.

Figures

Figure 1
Figure 1
Exosomal miRNA expression levels in PDAC patient plasma compared to control. The scatterplot shows the average ΔCq values for 11 mature miRNAs in PDAC samples (N = 15) and control samples (N = 19). Student’s t-test was used to establish significance, where *, **, and *** denote p < 0.05, p < 0.01, and p < 0.001, respectively.
Figure 2
Figure 2
PDAC stage-specific expression levels of plasma exosomal miRNAs. The scatterplot shows the average ΔCq values for 11 mature miRNAs in PDAC samples separated by staging, early stage (stage I and II, N = 5), mid stage (stage III, N = 3) and late stage (stage IV, N = 7), and compared to control samples (N = 19). Student’s t-test was used to establish significance, where *, **, and *** denote p < 0.05, p < 0.01, and p < 0.001, respectively.
Figure 3
Figure 3
Receiver operator characteristic (ROC) area under the curve (AUC) analyses. The four-miRNA panel (miR-93-5p, miR-339-3p, miR-425-5p, and miR-425-3p) underwent ROC analysis using the upper limits of the average control ΔCq thresholds (a) and using the lower limit of the average PDAC ΔCq thresholds (b). The values are based off the average ΔCqs for each miRNA in either control or PDAC plasma samples with 99% CI for all such values.
Figure 4
Figure 4
Receiver operator characteristic (ROC) area under the curve (AUC) analysis of the combined four-miRNA panel using two thresholds. Sensitivity = 80%, specificity = 94.7%; AUC = 0.885, CI 99% 0.74–1.00, p < 1 × 10⁻¹⁰.
Figure 5
Figure 5
Analyzing PDAC and control samples using the combined four-miRNA biomarker panel. The heatmap shows which samples surpassed the two thresholds (ΔCq is greater than the upper limit of the control for each miRNA AND ΔCq is greater than the lower limit of PDAC for each miRNA, 99% CI), indicating a positive hit for PDAC. Red indicates a positive hit and blue indicates a negative hit. Columns labeled as “Cont” represent control plasma samples while columns labeled as “PDAC” represent plasma from patients with pancreatic cancer. PDAC 1, 2, 3, 4, and 5 represent early-stage (I and II) pancreatic cancer; PDAC 6, 7, and 12 represent mid-stage (stage III) pancreatic cancer; and PDAC 8, 9, 10, 11, 13, 14, and 15 represent late-stage (stage IV) pancreatic cancer. CA19-9 values are added for comparison where the threshold is the medically established value of >37 U/mL.

References

    1. Siegel R.L., Miller K.D., Fuchs H.E., Jemal A. Cancer Statistics, 2022. CA Cancer J. Clin. 2022;72:7–33. doi: 10.3322/caac.21708. - DOI - PubMed
    1. Lee T., Teng T.Z.J., Shelat V.G. Carbohydrate Antigen 19-9—Tumor Marker: Past, Present, and Future. World J. Gastrointest. Surg. 2020;12:468. doi: 10.4240/wjgs.v12.i12.468. - DOI - PMC - PubMed
    1. Kim S., Park B.K., Seo J.H., Choi J., Choi J.W., Lee C.K., Chung J.B., Park Y., Kim D.W. Carbohydrate Antigen 19-9 Elevation without Evidence of Malignant or Pancreatobiliary Diseases. Sci. Rep. 2020;10:8820. doi: 10.1038/s41598-020-65720-8. - DOI - PMC - PubMed
    1. Bertino G., Ardiri A.M., Calvagno G.S., Malaguarnera G., Interlandi D., Vacante M., Bertino N., Lucca F., Madeddu R., Motta M. Carbohydrate 19.9 Antigen Serum Levels in Liver Disease. Biomed. Res. Int. 2013;2013:531640. doi: 10.1155/2013/531640. - DOI - PMC - PubMed
    1. Teng D., Wu K., Sun Y., Zhang M., Wang D., Wu J., Yin T., Gong W., Ding Y., Xiao W., et al. Significant Increased CA199 Levels in Acute Pancreatitis Patients Predicts the Presence of Pancreatic Cancer. Oncotarget. 2018;9:12745. doi: 10.18632/oncotarget.23993. - DOI - PMC - PubMed