. 2023 Mar 7;24(6):5103.
doi: 10.3390/ijms24065103.

Data-Independent Acquisition Proteomics Reveals the Effects of Red and Blue Light on the Growth and Development of Moso Bamboo (Phyllostachys edulis) Seedlings

Affiliations

Data-Independent Acquisition Proteomics Reveals the Effects of Red and Blue Light on the Growth and Development of Moso Bamboo (Phyllostachys edulis) Seedlings

Ke Li et al. Int J Mol Sci. .

Abstract

Moso bamboo is a rapidly growing species with significant economic, social, and cultural value. Transplanting moso bamboo container seedlings for afforestation has become a cost-effective method. The growth and development of the seedlings is greatly affected by the quality of light, including light morphogenesis, photosynthesis, and secondary metabolite production. Therefore, studies on the effects of specific light wavelengths on the physiology and proteome of moso bamboo seedlings are crucial. In this study, moso bamboo seedlings were germinated in darkness and then exposed to blue and red light conditions for 14 days. The effects of these light treatments on seedling growth and development were observed and compared through proteomics analysis. Results showed that moso bamboo has higher chlorophyll content and photosynthetic efficiency under blue light, while it displays longer internode and root length, more dry weight, and higher cellulose content under red light. Proteomics analysis reveals that these changes under red light are likely caused by the increased content of cellulase CSEA, specifically expressed cell wall synthetic proteins, and up-regulated auxin transporter ABCB19 in red light. Additionally, blue light is found to promote the expression of proteins constituting photosystem II, such as PsbP and PsbQ, more than red light. These findings provide new insights into the growth and development of moso bamboo seedlings regulated by different light qualities.

Keywords: blue light; data-independent acquisition proteomics; growth and development; moso bamboo; red light.


Conflict of interest statement

The authors declare no conflict of interest.

Figures

Figure 1
Figure 1
Effects of red and blue light treatments on the growth and development of moso bamboo seedlings. (A) The representative phenotypic image of moso bamboo seedlings under different light treatments. After the seeds germinated in the dark, they were transferred to red light (650 nm), blue light (450 nm) and dark conditions for 14 days. Scale bar = 3 cm. (BG) Quantification of the root length (the length of the primary root) (B), stem length (C), internode length (the length between the second and third leaf) (D), leaf width (the width of the widest position of the second leaf) (E), leaf area (the area of the second leaf) (F), dry weight (G) of the bamboo seedlings treated with different light conditions. Data are presented as mean ± SD (n = 15 seedlings). Significant differences were analyzed by two-tailed Student’s t-test (ns p > 0.05, ** p < 0.01, *** p < 0.001, **** p < 0.0001).
Figure 2
Figure 2
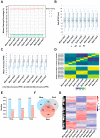
Quantitative proteomic analysis. (A) The percentage of peptides containing one (green dots), two (blue dots) or no missed cleavages (red dots) in each sample. The “rep” represents “replication”, the same as below. (B) The delta RT/iRT is the difference between a peptide theoretical and empirical RT/iRT, computed from the linear iRT/RT regression function [27]. (C) The plot of mass accuracy before and after calibration. These plots display the mass accuracy for all identified peptides at the precursor (MS1) level. The mass accuracy is calculated by dividing the (observed m/z-theoretical m/z) by the theoretical m/z (in ppm). (D) The sample correlation matrix shows correlation of peptide/protein group quantities between all samples. (E) The numbers of identified proteins and quantified proteins in the moso bamboo samples under blue light, dark light and red light conditions. The blue bar represents the number of identified proteins. The red bar represents the number of quantified proteins (the proteins identified by all three replicates). (F) Venn diagram showing the specific quantified and shared quantified proteins of the moso bamboo seedlings under different light conditions. (G) Heat map of expression profiles for the shared quantified proteins in moso bamboo seedlings under different light conditions.
Figure 3
Figure 3
Gene ontology analyses of moso bamboo proteins under red light and blue light conditions. (A) The number of specific quantified proteins in moso bamboo under different light conditions. Blue_Red represents the group of proteins identified under red and blue light, but not in the dark. (B) Gene ontology (GO) enrichment analysis of the red light-specific quantified proteins. (C) Interactive graph of the gene ontology enrichment analysis of the proteins in Blue_Red in (A). The color of the bubble corresponds to the Log10 (FDR value of the GO term). The size of the bubble corresponds to the Log10 (number of annotations for the GO term ID in selected species in the EBI GOA database). (D) The heatmap showing the expression levels of specific quantified light stimulated proteins in Blue-Red.
Figure 4
Figure 4
Differences in protein expression in moso bamboo under red and blue light treatments. (A) Scatter plot showing the association between the blue light-responsive proteins and the red light-responsive proteins in moso bamboo. The dashed lines indicate Log2 (FC) = ±1. The steel blue and dark red plots indicated the co-upregulated/downregulated proteins under red and blue light treatments. Green and orange plots indicated the proteins regulated in the opposite direction between red and blue light treatments. Red and navy plots indicated the proteins upregulated/downregulated under blue light and unchanged under red light. Purple and cyan plots indicated the proteins upregulated/downregulated under red light and unchanged under blue light. Gray plots indicated the proteins with p value > 0.01. (B) GO enrichment analysis of the blue and red light co-responsive proteins shown in (A). (C) GO enrichment analysis of the blue light-specific responsive proteins shown in (A). (D) GO enrichment analysis of the red light-specific responsive proteins shown in (A).
Figure 5
Figure 5
Differences in the regulation of photosynthesis-related proteins in moso bamboo seedlings under blue and red light. (A) Expression differences in the photosynthesis KEGG pathway-related DEPs in moso bamboo seedlings under different light treatments. (B) Expression differences in the carbon fixation in photosynthetic organism pathway-related DEPs under different light treatments. The arrows indicate the direction of substrate transformation. Heat maps were used to indicate the expression levels of the DEGs encoding the enzymes. (EC:4.1.1.39), ribulose-bisphosphate carboxylase large chain; (EC:2.7.2.3), phosphoglycerate kinase; (EC:1.2.1.13), glyceraldehyde-3-phosphate dehydrogenase (NADP+); (EC:4.1.2.13), fructose-bisphosphate aldolase, class I; (EC:3.1.3.11), fructose-1,6-bisphosphatase I; (EC:2.2.1.1), transketolase; (EC:3.1.3.37), sedoheptulose-1,7-bisphosphatase; (EC:5.3.1.6), ribose 5-phosphate isomerase A; (EC:2.7.1.19), phosphoribulokinase; (EC:5.3.1.1), triosephosphate isomerase (TIM).
Figure 6
Figure 6
Comparison of chlorophyll content and fluorescence kinetic parameters of moso bamboo seedlings under red and blue light. (AF) Chlorophyll concentrations (A), PS1 over reduced centers (B), Fv/Fm (C), Phi2 (D), qL (E) and PhiNPQ (F) for moso bamboo seedlings under different light treatments. Data are presented as mean ± SD (n = 10 biological replicates). Significant differences were analyzed by two-tailed Student’s t-test (ns p > 0.05, * p < 0.05, *** p < 0.001, **** p < 0.0001).
Figure 7
Figure 7
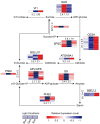
Expression differences in the starch and sucrose metabolic KEGG pathway-related DEPs of moso bamboo seedlings under different light treatments. The arrows indicate the direction of substrate transformation. The numbers in the boxes represent the EC numbers of the enzymes involved in the reactions. Heat maps were used to indicate the expression levels of the DEPs encoding the enzymes. (EC:3.2.1.26), beta-fructofuranosidase; (EC:2.4.1.13), sucrose synthase; (EC:2.4.1.12), cellulose synthase (UDP-forming); (EC:3.2.1.4), endoglucanase; (EC:3.2.1.21), beta-glucosidase; (EC:5.4.2.2), phosphoglucomutase; (EC:2.7.7.27), glucose-1-phosphate adenylyltransferase; (EC:2.4.1.21), starch synthase; (EC:2.4.1.18), 1,4-alpha-glucan branching enzyme; (EC:2.4.1.1), glycogen phosphorylase; (EC:2.4.1.14), sucrose-phosphate synthase; (EC:3.1.3.24), sucrose-6-phosphatase.
Figure 8
Figure 8
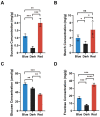
Comparison of soluble sugar and starch contents in moso bamboo seedlings under different light treatments. (AD) Differences in sucrose (A), starch (B), fructose (C), and glucose (D) in moso bamboo under different light treatments. Data are presented as mean ± SD (n = 3 biological replicates). Significant differences were analyzed by two-tailed Student’s t-test (ns p > 0.05, * p < 0.05, ** p < 0.01, *** p < 0.001, **** p < 0.0001).
Figure 9
Figure 9
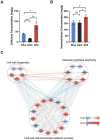
Compared to blue light, red light promotes the formation of cell wall components in moso bamboo seedlings. (A,B) Cellulose (A) and hemicellulose (B) contents of moso bamboo seedlings under different light conditions. Data are presented as mean ± SD (n = 3 biological replicates). Significant differences were analyzed by two-tailed Student’s t-test (ns p > 0.05, * p < 0.05, ** p < 0.01, *** p < 0.001). (C) Correlation analysis of DEP expression levels between cell wall biogenesis, cell wall macromolecule catabolic process and cellulose synthesis pathways. The color of the node indicates the number of proteins with co-expression relationships (from left to right, the color bar indicates the number of proteins increases in turn), and the connecting lines indicate a significant co-expression relationship between the two connected proteins. The color of the line connecting two proteins is used to indicate the correlation between the proteins. The color of the line is between 0 and 1, indicating that there is a positive correlation between the two proteins. Contrarily, it shows that there is a negative correlation between the two proteins.

References

    1. Ramakrishnan M., Yrjälä K., Vinod K.K., Sharma A., Cho J., Satheesh V., Zhou M. Genetics and genomics of moso bamboo (phyllostachys edulis): Current status, future challenges, and biotechnological opportunities toward a sustainable bamboo industry. Food Energy Secur. 2020;9:e229. doi: 10.1002/fes3.229. - DOI
    1. Wei Q., Jiao C., Ding Y., Gao S., Guo L., Chen M., Hu P., Xia S., Ren G., Fei Z. Cellular and molecular characterizations of a slow-growth variant provide insights into the fast growth of bamboo. Tree Physiol. 2018;38:641–654. doi: 10.1093/treephys/tpx129. - DOI - PubMed
    1. Chen Z., Li M., Liu S., Chen X., Zhang W., Zhu Q., Kohnen M.V., Wang Q. The function and photoregulatory mechanisms of cryptochromes from moso bamboo (phyllostachys edulis) Front. Plant Sci. 2022;13:866057. doi: 10.3389/fpls.2022.866057. - DOI - PMC - PubMed
    1. Wei Q., Guo L., Jiao C., Fei Z., Chen M., Cao J., Ding Y., Yuan Q. Characterization of the developmental dynamics of the elongation of a bamboo internode during the fast growth stage. Tree Physiol. 2019;39:1201–1214. doi: 10.1093/treephys/tpz063. - DOI - PubMed
    1. Panee J. Potential medicinal application and toxicity evaluation of extracts from bamboo plants. J. Med. Plant Res. 2015;9:681–692. - PMC - PubMed

Substances

LinkOut - more resources