. 2023 Mar 7;24(6):5122.
doi: 10.3390/ijms24065122.

A Comprehensive and Integrative Approach to MeCP2 Disease Transcriptomics

Affiliations

A Comprehensive and Integrative Approach to MeCP2 Disease Transcriptomics

Alexander J Trostle et al. Int J Mol Sci. .

Abstract

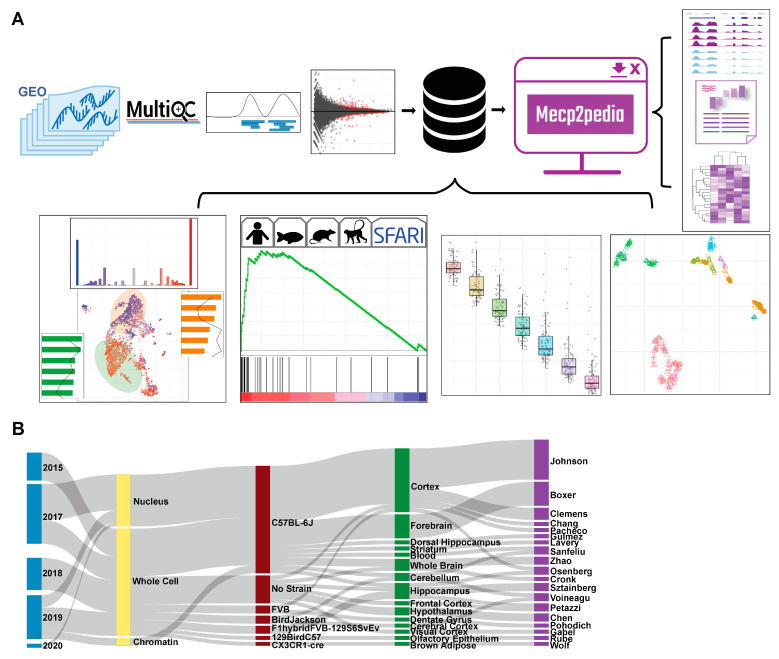
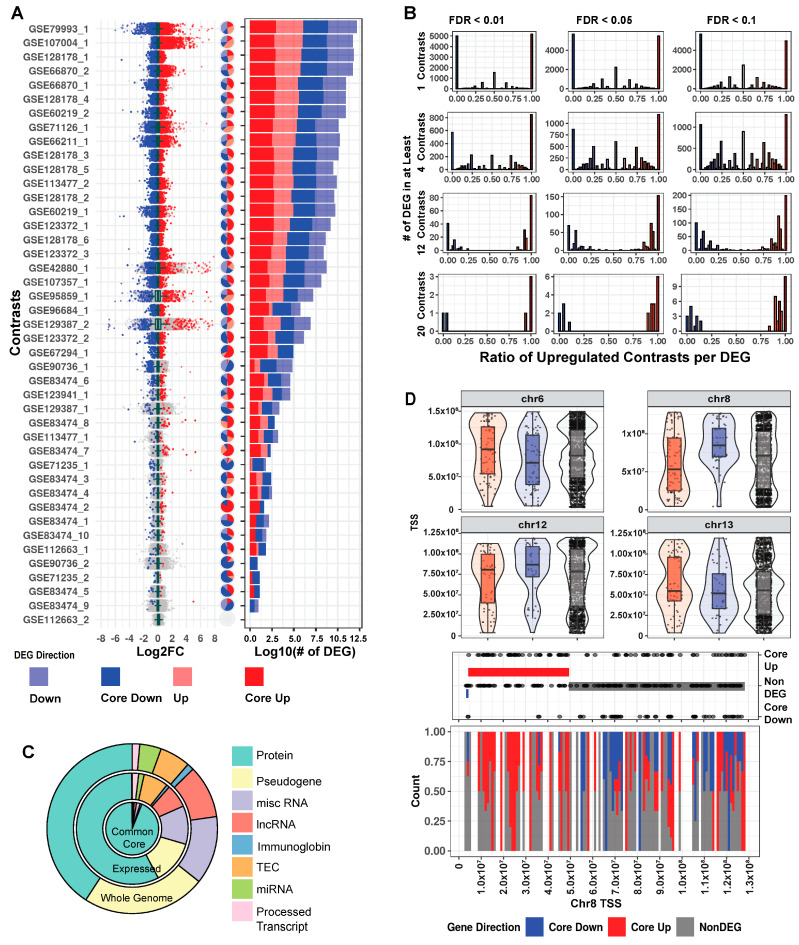
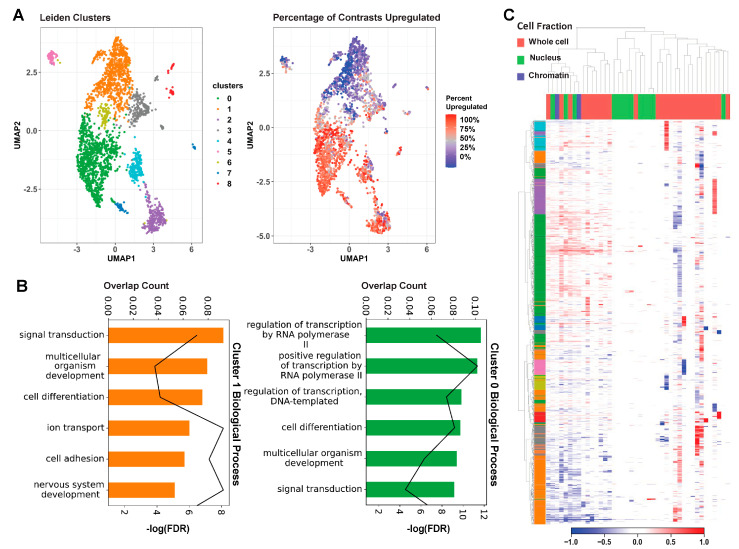
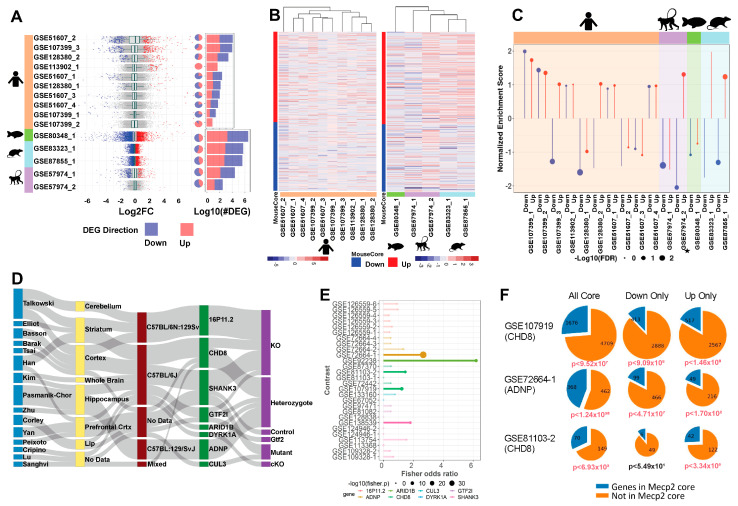
Mutations in MeCP2 result in a crippling neurological disease, but we lack a lucid picture of MeCP2's molecular role. Individual transcriptomic studies yield inconsistent differentially expressed genes. To overcome these issues, we demonstrate a methodology to analyze all modern public data. We obtained relevant raw public transcriptomic data from GEO and ENA, then homogeneously processed it (QC, alignment to reference, differential expression analysis). We present a web portal to interactively access the mouse data, and we discovered a commonly perturbed core set of genes that transcends the limitations of any individual study. We then found functionally distinct, consistently up- and downregulated subsets within these genes and some bias to their location. We present this common core of genes as well as focused cores for up, down, cell fraction models, and some tissues. We observed enrichment for this mouse core in other species MeCP2 models and observed overlap with ASD models. By integrating and examining transcriptomic data at scale, we have uncovered the true picture of this dysregulation. The vast scale of these data enables us to analyze signal-to-noise, evaluate a molecular signature in an unbiased manner, and demonstrate a framework for future disease focused informatics work.

Keywords: MeCP2; MeCP2 duplication syndrome; RNA-seq; Rett syndrome; data portal; differential expression analysis; meta-analysis; mouse models.


Conflict of interest statement

The authors declare no competing interests.

Figures

Figure 1
Figure 1
Overview of data and workflow. (A) Workflow for portal data and analysis. Processing is uniform and unbiased. Quality, track, and DEG analysis results are available in an intuitive and comparable manner through our portal. (B) Sankey plot on major characteristics per contrast of the collected mouse data (date, cell fraction, strain, tissue, first author). Metadata were collected with sequence data and then standardized.
Figure 2
Figure 2
Mouse transcriptome common core. (A) Distribution of log2 fold change across contrasts with significant (FDR < 0.01) DEGs. Dark blue and dark red, respectively, indicate genes that are core down and core up, and pale blue/pale red, respectively, indicate down and up DEG. Pie charts with the same annotation colors show what percentage of each contrast’s DEGs falls into each category. Stacked bar charts with the same annotation colors show each contrast’s DEG quantity. (B) Histograms of significantly up and downregulated genes cut for different FDR thresholds and the number of total contrasts in which a DEG appears. Genes at the extreme ratios of 0 or 1 percent upregulated are highly concordant across contrasts, whereas genes that fall into the middle are discordant. For consistency in this analysis, we inverted the direction of fold change for the four contrasts of the TG model. (C). Genes as annotated by Gencode and condensed into eight broad categories. We considered 53,661 genes from our annotation and found 32,539 that passed our expression filter in at least one contrast. The common core (FDR < 0.01 in at least four contrasts) is comprised of 2971 genes. (D). Exploration of genome location trends in the common core. All non-DEGs are plotted in the upper portion of the panel, and violin plots show areas of gene density. Chromosome 8 was selected for further examination in the lower half of the panel, with baseline genes in equal quantity to the core genes (150) also plotted. CBS method is used to identify trends in the up/down/baseline genes. The bands on middle dot plot show these CBS results, and the lower stack plot shows the density of up, down, and baseline genes on chromosome 8.
Figure 3
Figure 3
Unsupervised clustering on core genes. (A). The left UMAP plot colors each gene by cluster, assigned through unsupervised Leiden clustering. The right UMAP plot displays the percentage of contrasts in which the gene was upregulated on a spectrum of red (upregulated in all contrasts) to blue (downregulated in all contrasts). We can see that the green and orange clusters roughly encompass the up and downregulated genes. (B). Results of GO analysis on Leiden clusters 0 and 1. The bar colors correspond to cluster. Bar length represents the proportion of genes enriched with the term in the cluster, and the line plot represents the FDR of the enrichment. (C) Heatmap of contrasts (columns) by genes (rows). Contrasts are labelled based on the experiment’s cell fraction, and genes are labelled based on their Leiden cluster. We can see the general downregulation in the orange cluster and the upregulation in the green cluster. We can also see from this figure that the other clusters are generally caused by extreme deviations in one or two studies.
Figure 4
Figure 4
Mouse transcriptome translation to other models. (A). Distribution of log2 fold change across contrasts with significant (FDR < 0.01) DEGs. Blue and red, respectively, indicate down and up DEGs. Pie charts with the same annotation coloring show the percentage of each contrast’s DEGs in each category. Stacked bar charts with the same annotation color show each contrasts’ DEG quantity. The upper 7 contrasts are human data, and the lower 5 are other species. (B). Heatmaps of log2 fold change plotted to compare direction of dysregulation to the consensus from mouse data. Genes examined are the mouse common core, and plots are annotated on mouse core down and mouse core up. (C). Per-contrast visualization of GSEA normalized enrichment score and FDR. Direction and color of line represents normalized enrichment score, and point size represents log10(FDR). Contrasts are grouped and shaded corresponding to their model of origin. MDS model is annotated with a small star. (D). Sankey plot of ASD contrast metadata characteristics. From left to right: first author, tissue, strain, target gene, and experimental procedure. (E). Fisher’s exact test results. Points sized by –log10(p-value), length determined by odds ratio, data colored by gene. Points are opaque, and overlap to MeCP2 core is considered significant if the Fisher p-value is less than 0.05. (F). Pie charts show the magnitude of overlap between selected ASD contrasts and the MeCP2 common core. Down and up only show genes changed in the same direction in both sets. p-values beneath each plot show the Fisher’s exact test significance of the overlap for each intersection, colored red if the p-value is less than 0.05.
Figure 5
Figure 5
Downsampling analysis. (A,B). Large contrasts from MeCP2 and lesional psoriatic skin data were downsampled to smaller and more common experimental sample number, and DEG analysis was run on these subsets. Box plot and jitter points are plotted for resultant DEG numbers under each condition. Cutoffs for MeCP2 are sample numbers 9 through 3. Cutoffs for psoriatic data are sample numbers 8 through 3. Each cutoff number was repeated 100 times, with random samples discarded each time. Results are plotted at FDR < 0.01. MeCP2 data are fold change (FC) cutoff at any FC, FC > 10%, and FC > 20%. Psoriatic skin data are FC cutoff at any FC, FC > 10%, and FC > 200%. Curves indicate the percent of DEGs remaining at continuous |log2 fold change| cutoffs. Horizontal line indicates 50% of genes removed.
Figure 6
Figure 6
Technical variation/batch effect analysis. (A) UMAP visualization of raw and corrected data from MeCP2 and AD. (B). Comparison of cell type-matched (microglia), male-to-female contrasts by DEG overlap, and direction of misregulation. DEG are FDR < 0.01 and any fold change.

References

    1. Costa F.F. Big data in biomedicine. Drug Discov. Today. 2014;19:433–440. doi: 10.1016/j.drudis.2013.10.012. - DOI - PubMed
    1. Lonsdale J., Thomas J., Salvatore M., Phillips R., Lo E., Shad S., Hasz R., Walters G., Garcia F., Young N., et al. The Genotype-Tissue Expression (GTEx) project. Nat. Genet. 2013;45:580–585. doi: 10.1038/ng.2653. - DOI - PMC - PubMed
    1. Lachmann A., Torre D., Keenan A.B., Jagodnik K.M., Lee H.J., Wang L., Silverstein M.C., Ma’ayan A. Massive mining of publicly available RNA-seq data from human and mouse. Nat. Commun. 2018;9:1366. doi: 10.1038/s41467-018-03751-6. - DOI - PMC - PubMed
    1. Drysdale R.A., Crosby M.A. FlyBase Consortium. FlyBase: Genes and gene models. Nucleic Acids Res. 2005;33:D390–D395. doi: 10.1093/nar/gki046. - DOI - PMC - PubMed
    1. Smith J.R., Hayman G.T., Wang S.J., Laulederkind S., Hoffman M.J., Kaldunski M.L., Tutaj M., Thota J., Nalabolu H.S., Ellanki S., et al. The Year of the Rat: The Rat Genome Database at 20: A multi-species knowledgebase and analysis platform. Nucleic Acids Res. 2020;48:D731–D742. doi: 10.1093/nar/gkz1041. - DOI - PMC - PubMed

Substances