. 2023 Mar 13;24(6):5479.
doi: 10.3390/ijms24065479.

IL-1 Mediates Chronic Stress-Induced Hyperalgesia Accompanied by Microglia and Astroglia Morphological Changes in Pain-Related Brain Regions in Mice

Affiliations

IL-1 Mediates Chronic Stress-Induced Hyperalgesia Accompanied by Microglia and Astroglia Morphological Changes in Pain-Related Brain Regions in Mice

Barbara Fülöp et al. Int J Mol Sci. .

Abstract

Chronic stress causes several pain conditions including fibromyalgia. Its pathophysiological mechanisms are unknown, and the therapy is unresolved. Since the involvement of interleukin-1 (IL-1) has been described in stress and inflammatory pain but no data are available regarding stress-induced pain, we studied its role in a chronic restraint stress (CRS) mouse model. Female and male C57Bl/6J wild-type (WT) and IL-1αβ-deficient (knock-out: IL-1 KO) mice were exposed to 6 h of immobilization/day for 4 weeks. Mechanonociception, cold tolerance, behavioral alterations, relative thymus/adrenal gland weights, microglia ionized calcium-binding adaptor molecule 1 (IBA1) and astrocyte glial fibrillary acidic protein (GFAP) integrated density, number and morphological transformation in pain-related brain regions were determined. CRS induced 15-20% mechanical hyperalgesia after 2 weeks in WT mice in both sexes, which was significantly reduced in female but not in male IL-1 KOs. Increased IBA1+ integrated density in the central nucleus of amygdala, primary somatosensory cortex hind limb representation part, hippocampus cornu ammonis area 3 (CA3) and periaqueductal gray matter (PAG) was present, accompanied by a cell number increase in IBA1+ microglia in stressed female WTs but not in IL-1 KOs. CRS induced morphological changes of GFAP+ astrocytes in WT but not in KO mice. Stress evoked cold hypersensitivity in the stressed animals. Anxiety and depression-like behaviors, thymus and adrenal gland weight changes were detectable in all groups after 2 but not 4 weeks of CRS due to adaptation. Thus, IL-1 mediates chronic stress-induced hyperalgesia in female mice, without other major behavioral alterations, suggesting the analgesic potentials of IL-1 in blocking drugs in stress-related pain syndromes.

Keywords: central pain sensitization; chronic immobilization; cytokines; fibromyalgia-like pain syndrome; hyperalgesia; neuroinflammation.


Conflict of interest statement

The authors declare no conflict of interest.

Figures

Figure 1
Figure 1
Baseline mechanonociceptive threshold (A), cold tolerance (B) and body weight (C) values of female and male wild-type (WT) and Interleukine-1-deficient (knock-out: KO) mice at the beginning of the experiment. Data are presented as the means ± SEM of n = 7–36 animals with individual plots (female WT: 36; female KO: 31; male WT: 7; male KO: 9); two-way analysis of variance (ANOVA), followed by Tukey’s tests; * p < 0.05, *** p < 0.0001 vs. indicated groups.
Figure 2
Figure 2
Effects of chronic restraint stress (CRS) on nociceptive behaviors of wild-type (WT) and Interleukine-1 knock-out (KO) mice. Male (A) and female (C) mechanonociceptive threshold and male (B) and female (D) cold tolerance (paw withdrawal latency) changes are presented compared to the baseline threshold. Data are presented as the means ± SEM (n = 4–19); two-way repeated measurement analysis of variance (ANOVA), followed by Tukey’s tests; *** p < 0.001 vs. KO stressed group; * p < 0.05 vs. KO non-stressed group; # p < 0.05, ## p < 0.01, ### p < 0.001, #### p < 0.0001 vs. respective non-stressed groups.
Figure 3
Figure 3
Chronic restraint stress (CRS)-induced weight changes of stress-sensitive organs in wild-type (WT) and Interleukine-1 knock-out (KO) female animals. Thymus weights after 2 weeks (A) and 4 weeks (B); adrenal gland weights after 2 weeks (C) and 4 weeks (D) of CRS. Data are presented as the means ± SEM of n = 6–12 animals with individual plots; two-way analysis of variance (ANOVA), followed by Tukey’s tests; * p < 0.05, *** p < 0.001 vs. respective control group.
Figure 4
Figure 4
Effects of chronic restraint stress (CRS) on depression-like behavior in wild-type (WT) and Interleukine-1 knock-out (KO) female animals. Tail suspension test (TST) shows time spent immobile after 2 weeks (A) and 4 weeks (B) of restraint. Immobility time shown in the forced swim test (FST) after 2 weeks (C) and after 4 weeks (D) of CRS. Data are presented as the means ± SEM of n = 6–12 animals with individual plots; two-way analysis of variance (ANOVA), followed by Tukey’s tests; * p < 0.05, ** p < 0.01 vs. own control group.
Figure 5
Figure 5
Behavioral alterations induced by chronic restraint stress (CRS) in female wild-type (WT) and Interleukine-1 knock-out (KO) mice detected with the light–dark box test (LDB). Time spent in the lit compartment after 2 weeks (A) and after 4 weeks (B); the number of entries into the light after 2 weeks (C) and 4 weeks (D). Data are presented as the means ± SEM in case of A&B (animals with individual plots) and as the median ± IQR in case of C&D (n = 8–15); two-way analysis of variance (ANOVA), followed by Tukey’s tests; Kruskal–Wallis test, followed by Dunn’s test; * p < 0.05 vs. indicated group.
Figure 6
Figure 6
Behavioral alterations induced by chronic restraint stress (CRS) in wild-type (WT) and Interleukine-1 knock-out (KO) female mice detected with an open field test (OFT). The distance moved (A) and the time spent on moving (B) in the OFT. Data are presented as the means ± SEM of n = 8–12 animals with individual plots; two-way analysis of variance (ANOVA), followed by Tukey’s tests; * p < 0.05, ** p < 0.01 vs. own control group.
Figure 7
Figure 7
Diagrams show the ionized calcium-binding adaptor molecule 1 (IBA1) integrated density, the number of IBA1+ cells and the IBA1 activation score of microglia examined in the somatosensory cortex–hind limb representation part (S1HL—(A)). Representative images show the IBA1+ microglia cells in S1HL (B). Chronic restraint stress (CRS), Wild-type (WT), Interleukine-1 knock-out (KO). Data are presented as the means ± SEM of n = 5–7 animals with individual plots; two-way analysis of variance (ANOVA), followed by Tukey’s tests; ** p < 0.01 vs. respective group.
Figure 7
Figure 7
Diagrams show the ionized calcium-binding adaptor molecule 1 (IBA1) integrated density, the number of IBA1+ cells and the IBA1 activation score of microglia examined in the somatosensory cortex–hind limb representation part (S1HL—(A)). Representative images show the IBA1+ microglia cells in S1HL (B). Chronic restraint stress (CRS), Wild-type (WT), Interleukine-1 knock-out (KO). Data are presented as the means ± SEM of n = 5–7 animals with individual plots; two-way analysis of variance (ANOVA), followed by Tukey’s tests; ** p < 0.01 vs. respective group.
Figure 8
Figure 8
Diagrams show the Ionized calcium-binding adaptor molecule 1 (IBA1) integrated density, the number of IBA1+ cells and the IBA1 activation score of microglia examined in the hippocampus CA3 region (CA3—(A)). Representative images show the IBA1+ microglia cells in CA3 (B). Chronic restraint stress (CRS), Wild-type (WT), Interleukine-1 knock-out (KO). Data are presented as the means ± SEM of n = 5–7 animals with individual plots; two-way analysis of variance (ANOVA), followed by Tukey’s tests; *** p < 0.001 vs. respective group.
Figure 8
Figure 8
Diagrams show the Ionized calcium-binding adaptor molecule 1 (IBA1) integrated density, the number of IBA1+ cells and the IBA1 activation score of microglia examined in the hippocampus CA3 region (CA3—(A)). Representative images show the IBA1+ microglia cells in CA3 (B). Chronic restraint stress (CRS), Wild-type (WT), Interleukine-1 knock-out (KO). Data are presented as the means ± SEM of n = 5–7 animals with individual plots; two-way analysis of variance (ANOVA), followed by Tukey’s tests; *** p < 0.001 vs. respective group.
Figure 9
Figure 9
Diagrams show the Ionized calcium-binding adaptor molecule 1 (IBA1) integrated density, the number of IBA1+ cells and the IBA1 activation score of microglia examined in the Central Amygdala (CeA—(A)). Representative images show the IBA1+ microglia cells in CeA (B). Chronic restraint stress (CRS), Wild-type (WT), Interleukine-1 knock-out (KO). Data are presented as the means ± SEM of n = 5–7 animals with individual plots; two-way analysis of variance (ANOVA), followed by Tukey’s tests; ** p < 0.01 vs. respective group.
Figure 9
Figure 9
Diagrams show the Ionized calcium-binding adaptor molecule 1 (IBA1) integrated density, the number of IBA1+ cells and the IBA1 activation score of microglia examined in the Central Amygdala (CeA—(A)). Representative images show the IBA1+ microglia cells in CeA (B). Chronic restraint stress (CRS), Wild-type (WT), Interleukine-1 knock-out (KO). Data are presented as the means ± SEM of n = 5–7 animals with individual plots; two-way analysis of variance (ANOVA), followed by Tukey’s tests; ** p < 0.01 vs. respective group.
Figure 10
Figure 10
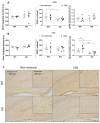
Diagrams show the Ionized calcium-binding adaptor molecule 1 (IBA1) integrated density, the number of IBA1+ cells and the IBA1 activation score of microglia examined in the Periaqueductal gray (PAG—(A)). Representative images show the IBA1+ microglia cells in PAG (B). Chronic restraint stress (CRS), Wild-type (WT), Interleukine-1 knock-out (KO). Data are presented as the means ± SEM of n = 5–7 animals with individual plots; two-way analysis of variance (ANOVA), followed by Tukey’s tests; * p < 0.05, ** p < 0.01 vs. respective group.
Figure 10
Figure 10
Diagrams show the Ionized calcium-binding adaptor molecule 1 (IBA1) integrated density, the number of IBA1+ cells and the IBA1 activation score of microglia examined in the Periaqueductal gray (PAG—(A)). Representative images show the IBA1+ microglia cells in PAG (B). Chronic restraint stress (CRS), Wild-type (WT), Interleukine-1 knock-out (KO). Data are presented as the means ± SEM of n = 5–7 animals with individual plots; two-way analysis of variance (ANOVA), followed by Tukey’s tests; * p < 0.05, ** p < 0.01 vs. respective group.
Figure 11
Figure 11
Diagrams show the Glial fibrillary acidic protein (GFAP) integrated density, the number of GFAP+ cells and the GFAP activation score of astrocytes examined in the periaqueductal gray matter (PAG—(A)) and the hippocampus cornu ammonis area 3 (CA3—(B)). Representative images show the GFAP+ astroglia cells in CA3 (C). Chronic restraint stress (CRS), Wild-type (WT), Interleukine-1 knock-out (KO). Data are presented as the means ± SEM of n = 5–7 animals with individual plots; two-way analysis of variance (ANOVA), followed by Tukey’s tests; * p < 0.05, *** p < 0.001 vs. respective group.
Figure 12
Figure 12
Experimental design including the timing of the baseline measurements, chronic restraint stress (CRS), nociceptive and behavioral tests and perfusion. DPA: dynamic plantar esthesiometry; LDB: light–dark box test; OFT: open field test; TST: tail suspension test; FST: forced swim test.

References

    1. National Institute for Health and Care Excellence . NICE Chronic Pain (Primary and Secondary) in over 16s: Assessment of All Chronic Pain and Management of Chronic Primary Pain. National Institute for Health and Care Excellence (NICE); London, UK: 2021. - PubMed
    1. Scholz J., Finnerup N.B., Attal N., Aziz Q., Baron R., Bennett M.I., Benoliel R., Cohen M., Cruccu G., Davis K.D., et al. The IASP Classification of Chronic Pain for ICD-11: Chronic Neuropathic Pain. Pain. 2019;160:53. doi: 10.1097/j.pain.0000000000001365. - DOI - PMC - PubMed
    1. Nicholas M., Vlaeyen J.W.S., Rief W., Barke A., Aziz Q., Benoliel R., Cohen M., Evers S., Giamberardino M.A., Goebel A., et al. The IASP Classification of Chronic Pain for ICD-11: Chronic Primary Pain. Pain. 2019;160:28–37. doi: 10.1097/j.pain.0000000000001390. - DOI - PubMed
    1. Gatzounis R., den Hollander M., Meulders A. Optimizing Long-Term Outcomes of Exposure for Chronic Primary Pain from the Lens of Learning Theory. J. Pain. 2021;22:1315–1327. doi: 10.1016/j.jpain.2021.04.012. - DOI - PubMed
    1. Vincent A., Lahr B.D., Wolfe F., Clauw D.J., Whipple M.O., Oh T.H., Barton D.L., St. Sauver J. Prevalence of Fibromyalgia: A Population-Based Study in Olmsted County, Minnesota, Utilizing the Rochester Epidemiology Project. Arthritis Care Res. 2013;65:786–792. doi: 10.1002/acr.21896. - DOI - PMC - PubMed

LinkOut - more resources