Origin of Elevated S-Glutathionylated GAPDH in Chronic Neurodegenerative Diseases
- PMID: 36982600
- PMCID: PMC10056234
- DOI: 10.3390/ijms24065529
Origin of Elevated S-Glutathionylated GAPDH in Chronic Neurodegenerative Diseases
Abstract
H2O2-oxidized glyceraldehyde-3-phosphate dehydrogenase (GAPDH) catalytic cysteine residues (Cc(SH) undergo rapid S-glutathionylation. Restoration of the enzyme activity is accomplished by thiol/disulfide SN2 displacement (directly or enzymatically) forming glutathione disulfide (G(SS)G) and active enzyme, a process that should be facile as Cc(SH) reside on the subunit surface. As S-glutathionylated GAPDH accumulates following ischemic and/or oxidative stress, in vitro/silico approaches have been employed to address this paradox. Cc(SH) residues were selectively oxidized and S-glutathionylated. Kinetics of GAPDH dehydrogenase recovery demonstrated that glutathione is an ineffective reactivator of S-glutathionylated GAPDH compared to dithiothreitol. Molecular dynamic simulations (MDS) demonstrated strong binding interactions between local residues and S-glutathione. A second glutathione was accommodated for thiol/disulfide exchange forming a tightly bound glutathione disulfide G(SS)G. The proximal sulfur centers of G(SS)G and Cc(SH) remained within covalent bonding distance for thiol/disulfide exchange resonance. Both these factors predict inhibition of dissociation of G(SS)G, which was verified by biochemical analysis. MDS also revealed that both S-glutathionylation and bound G(SS)G significantly perturbed subunit secondary structure particularly within the S-loop, region which interacts with other cellular proteins and mediates NAD(P)+ binding specificity. Our data provides a molecular rationale for how oxidative stress elevates S-glutathionylated GAPDH in neurodegenerative diseases and implicates novel targets for therapeutic intervention.
Keywords: glutathione; glyceraldehyde-3-phosphate dehydrogenase; hydrogen peroxide; molecular dynamic simulation; neurodegenerative disease; oxidative stress; redox signaling.
Conflict of interest statement
The authors declare no conflict of interest.
Figures


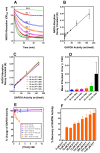
 ) Time course of the decline in total mol of S-glutathionylated subunits GAPDH/mol tetramer measured following the removal of all unbound G(SH) and G(SS)G after subunit denaturation and washing in the retentate following Microcon® spin separation (see text for details). (b
  ) Time course of unbound reduced G(SH) recovered and measured in the eluate following Microcon® spin separation. (c
  ) Time course of unbound G(SS)G recovered and measured in the eluate following Microcon® spin separation. Note: the data represents 2 mol equivalents of G(SH) derived from 1 mol equivalent of G(SS)G in the Promega protocol). (d
  ) The total number of G(SH) equivalents bound to GAPDH over the time course of the incubation of S-glutathionylated GAPDH with 1 mM G(SH) is shown as the sum of measurements. (a), (b), (c) The associated cumulative SD of the triplicate samples. The black dashed line represents the theoretical maximal G(SH) binding capacity of the four active sites within the GAPDH tetramer. The data show the combined mean values ± SD from two separate experiments with technical triplicates.

Similar articles
-
S-glutathionylation of glyceraldehyde-3-phosphate dehydrogenase induces formation of C150-C154 intrasubunit disulfide bond in the active site of the enzyme.Biochim Biophys Acta Gen Subj. 2017 Dec;1861(12):3167-3177. doi: 10.1016/j.bbagen.2017.09.008. Epub 2017 Sep 19. Biochim Biophys Acta Gen Subj. 2017. PMID: 28935607
-
The thioredoxin-independent isoform of chloroplastic glyceraldehyde-3-phosphate dehydrogenase is selectively regulated by glutathionylation.FEBS J. 2007 Jan;274(1):212-26. doi: 10.1111/j.1742-4658.2006.05577.x. Epub 2006 Nov 28. FEBS J. 2007. PMID: 17140414
-
Studies on the mechanism of oxidative modification of human glyceraldehyde-3-phosphate dehydrogenase by glutathione: catalysis by glutaredoxin.Biochem Biophys Res Commun. 1998 Jun 18;247(2):481-6. doi: 10.1006/bbrc.1998.8695. Biochem Biophys Res Commun. 1998. PMID: 9642155
-
Influence of Oxidative Stress on Catalytic and Non-glycolytic Functions of Glyceraldehyde-3-phosphate Dehydrogenase.Curr Med Chem. 2020;27(13):2040-2058. doi: 10.2174/0929867325666180530101057. Curr Med Chem. 2020. PMID: 29848267 Review.
-
[The biological significance of oxidative modifications of cysteine residues in proteins illustrated with the example of glyceraldehyde-3-phosphate dehydrogenase].Postepy Hig Med Dosw (Online). 2014 Mar 12;68:280-90. doi: 10.5604/17322693.1093929. Postepy Hig Med Dosw (Online). 2014. PMID: 24662796 Review. Polish.
Cited by
-
The Role of S-Glutathionylation in Health and Disease: A Bird's Eye View.Nutrients. 2024 Aug 18;16(16):2753. doi: 10.3390/nu16162753. Nutrients. 2024. PMID: 39203889 Free PMC article. Review.
-
Robust AMBER Force Field Parameters for Glutathionylated Cysteines.Int J Mol Sci. 2023 Oct 9;24(19):15022. doi: 10.3390/ijms241915022. Int J Mol Sci. 2023. PMID: 37834470 Free PMC article.
-
Neurodegenerative Disease: From Molecular Basis to Therapy.Int J Mol Sci. 2024 Jan 12;25(2):967. doi: 10.3390/ijms25020967. Int J Mol Sci. 2024. PMID: 38256040 Free PMC article.
References
-
- Gerszon J., Rodacka A. Oxidatively modified glyceraldehyde-3-phosphate dehydrogenase in neurodegenerative processes and the role of low molecular weight compounds in counteracting its aggregation and nuclear translocation. Ageing Res. Rev. 2018;48:21–31. doi: 10.1016/j.arr.2018.09.003. - DOI - PubMed
MeSH terms
Substances
LinkOut - more resources
Full Text Sources
Medical
Research Materials
Miscellaneous

