. 2023 Mar 14;24(6):5577.
doi: 10.3390/ijms24065577.

Diapause-Linked Gene Expression Pattern and Related Candidate Duplicated Genes of the Mountain Butterfly Parnassius glacialis (Lepidoptera: Papilionidae) Revealed by Comprehensive Transcriptome Profiling

Affiliations

Diapause-Linked Gene Expression Pattern and Related Candidate Duplicated Genes of the Mountain Butterfly Parnassius glacialis (Lepidoptera: Papilionidae) Revealed by Comprehensive Transcriptome Profiling

Chengyong Su et al. Int J Mol Sci. .

Abstract

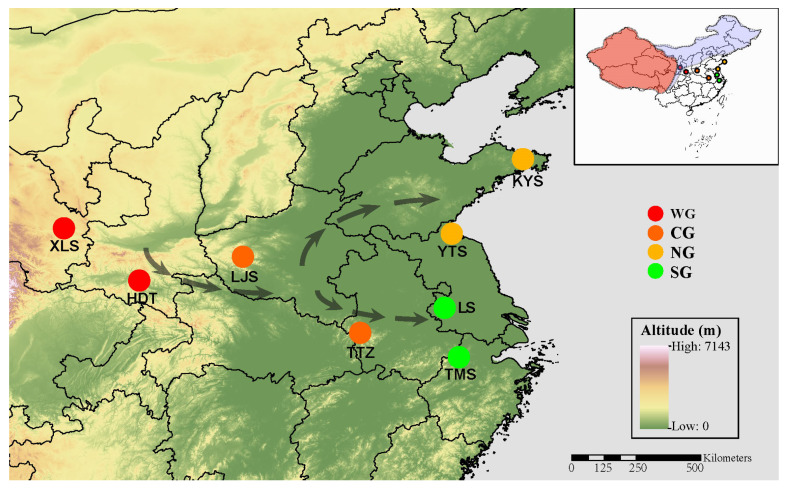
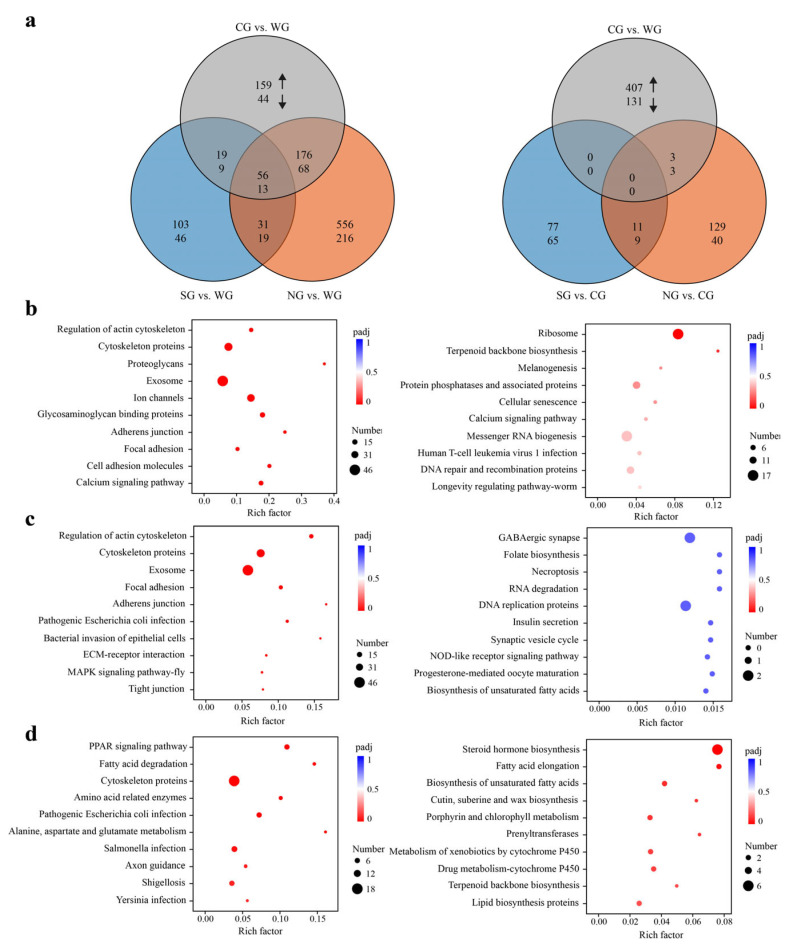
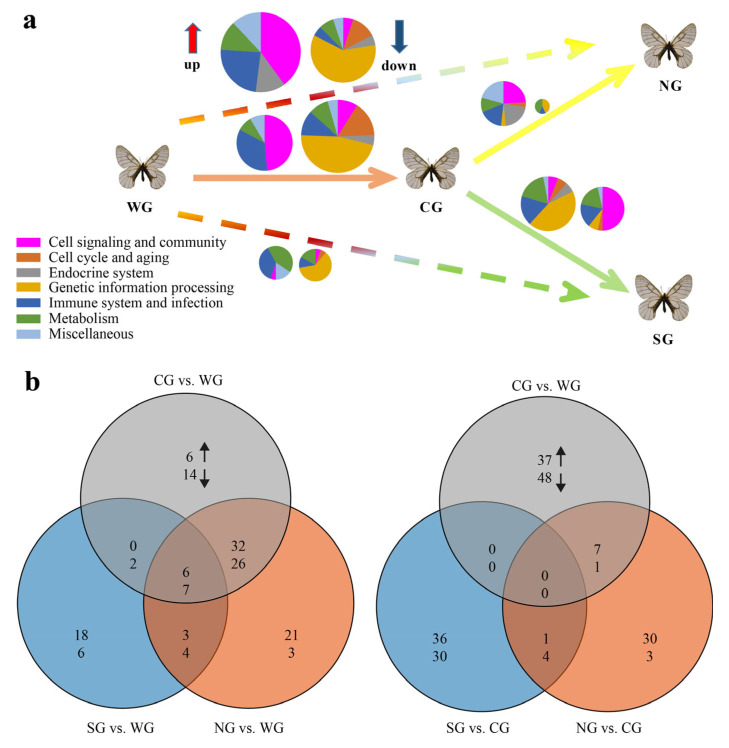
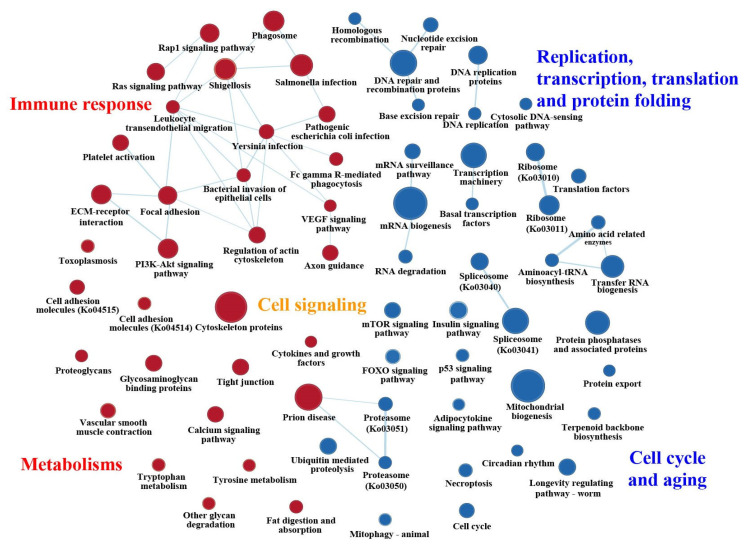
The mountain butterfly Parnassius glacialis is a representative species of the genus Parnassius, which probably originated in the high-altitude Qinhai-Tibet Plateau in the Miocene and later dispersed eastward into relatively low-altitude regions of central to eastern China. However, little is known about the molecular mechanisms underlying the long-term evolutionary adaptation to heterogeneous environmental conditions of this butterfly species. In this study, we obtained the high-throughput RNA-Seq data from twenty-four adult individuals in eight localities, covering nearly all known distributional areas in China, and firstly identified the diapause-linked gene expression pattern that is likely to correlate with local adaptation in adult P. glacialis populations. Secondly, we found a series of pathways responsible for hormone biosynthesis, energy metabolism and immune defense that also exhibited unique enrichment patterns in each group that are probably related to habitat-specific adaptability. Furthermore, we also identified a suite of duplicated genes (including two transposable elements) that are mostly co-expressed to promote the plastic responses to different environmental conditions. Together, these findings can help us to better understand this species' successful colonization to distinct geographic areas from the western to eastern areas of China, and also provide us with some insights into the evolution of diapause in mountain Parnassius butterfly species.

Keywords: Parnassius glacialis; Transcriptome; diapause; environmental adaptation; genome.


Conflict of interest statement

The authors declare no conflict of interest.

Figures

Figure 1
Figure 1
Geographic distribution of Parnassius glacialis from eight sampling localities. The proposed dispersal pattern is shown with arrows. WG, western group; CG, central group; NG, northeastern group; and SG, southeastern group (similarly hereinafter). Main distribution areas of other species of the genus Parnassius with high (in red) and low diversity (in light blue) in China and adjacent regions are shown in the upper right.
Figure 2
Figure 2
Overview of transcriptional changes among groups based on differential expression analysis. (a) Venn diagrams showing overlaps of DEGs with increased (upward arrow) or decreased (downward arrow) transcript abundance in five pairs of comparisons. (bd) KEGG enrichment results of the DEGs (left: up-regulated; right: down-regulated) in pairwise comparisons of NG vs. WG, CG vs. WG, and SG vs. WG, respectively. For each comparison, only the top ten pathways with the most significant enrichment are shown.
Figure 3
Figure 3
Overview of enriched KEGG pathways based on gene set enrichment analysis. (a) The pie charts indicating quantitative (shown by the relative size of the pie) and qualitative (colors of sectors) aspects of the transcriptional change (up-regulation, left pie; down-regulation, right pie) resulted from the long-term evolutionary adaptations to different habitats following the dispersal eastwards. The size of each pie is directly proportional to the percentage of enriched KEGG pathways (excluding those related to human diseases) detected for the respective comparison (e.g., CG vs. WG). The color of each sector codes for the high-level functional category (for more details, see Table S5). (b) Venn diagrams showing overlaps of enriched KEGG pathways enhanced (upward arrow) or inhibited (downward arrow) in five pairs of comparisons.
Figure 4
Figure 4
Enrichment map for the shared pathways in at least two groups out of NG, CG and SG in comparison to WG. Circles in red and blue show enhanced and inhibited pathways, respectively, with the size indicating the number of genes belonging to each KEGG pathway. The line thickness, which represents the degree of overlap between two pathways, is shown in light blue. More detailed information is available in Table S5.
Figure 5
Figure 5
Enrichment plot of ten up-regulated and three down-regulated gene clusters based on gene set enrichment analysis. The upper portion of the plot shows the running enrichment score for the overall gene set. The lower portion of the plot shows where the members of the gene set appear in the ranked list of genes. More detailed gene information is available in the text.
Figure 6
Figure 6
Eight representative chromosomal maps of P. glacialis with the distribution of the enriched gene clusters on the chromosome. Red, blue and black show up-regulated, down-regulated and non-changed (or not expressed) genes based on gene set enrichment analysis, respectively, with most of them harboring moderate expression changes. The left scale indicates the size of each chromosome. A complete chromosomal map of P. glacialis with the distribution of each enriched gene cluster is available in Figure S3.
Figure 7
Figure 7
WGCNA of all expressed genes in the WCN dataset. (a) Hierarchical clustering tree (gene dendrogram) showing 16 modules of genes co-expressed by WGCNA. The major tree branches constitute 16 modules, labeled with different colors. (b) Module−locality relationship. Each row represents a module. Each column represents a specific sampling locality. The correlation coefficient between module and locality is represented by the value in each cell at the row−column intersection, with the p-value shown in parentheses. (c,d) KEGG enrichment analyses of the genes in the turquoise and blue modules, respectively. For each module, only the top ten pathways with the most significant enrichment are shown.
Figure 8
Figure 8
WGCNA of all expressed genes in the WCS dataset. (a) Hierarchical clustering tree (gene dendrogram) showing 25 modules of genes co-expressed by WGCNA. The major tree branches constitute 25 modules, labeled with different colors. (b) Module−locality relationship. Each row represents a module. Each column represents a specific sampling locality. The correlation coefficient between module and locality is represented by the value in each cell at the row−column intersection, with the p-value shown in parentheses. (cg) KEGG enrichment analyses of the genes in the yellow, blue, green, brown and tan modules, respectively. For each module, only the top ten pathways with the most significant enrichment are shown.
Figure 9
Figure 9
Validation expression patterns in P. glacialis representative samples determined by qPCR. Genes of the sample XLS1 were used for normalizing the relative expressions of the corresponding genes of the other five samples. Relative expression level was calculated using the 2−ΔΔCt method. The left ordinate represents the qPCR-based expression levels and the right ordinate represents the RNA-seq-based expression levels. The error bar represents three repetitions.

Similar articles

Cited by

References

    1. Zhang J., Marshall K.E., Westwood J.T., Clark M.S., Sinclair B.J. Divergent transcriptomic responses to repeated and single cold exposures in Drosophila melanogaster. J. Exp. Biol. 2011;214:4021–4029. doi: 10.1242/jeb.059535. - DOI - PubMed
    1. Chown S.L., Gaston K.J. Macrophysiology for a changing world. Proc. R. Soc. B-Biol. Sci. 2008;275:1469–1478. doi: 10.1098/rspb.2008.0137. - DOI - PMC - PubMed
    1. Sorensen J.G., Schou M.F., Kristensen T.N., Loeschcke V. Thermal fluctuations affect the transcriptome through mechanisms independent of average temperature. Sci. Rep. 2016;6:30975. doi: 10.1038/srep30975. - DOI - PMC - PubMed
    1. Lindestad O., Wheat C.W., Nylin S., Gotthard K. Local adaptation of photoperiodic plasticity maintains life cycle variation within latitudes in a butterfly. Ecology. 2019;100:e02550. doi: 10.1002/ecy.2550. - DOI - PubMed
    1. McBryan T.L., Anttila K., Healy T.M., Schulte P.M. Responses to temperature and hypoxia as interacting stressors in fish: Implications for adaptation to environmental change. Integr. Comp. Biol. 2013;53:648–659. doi: 10.1093/icb/ict066. - DOI - PubMed

LinkOut - more resources