. 2023 Mar 15;24(6):5646.
doi: 10.3390/ijms24065646.

Integrative Analysis of the Ethanol Tolerance of Saccharomyces cerevisiae

Affiliations

Integrative Analysis of the Ethanol Tolerance of Saccharomyces cerevisiae

Ivan Rodrigo Wolf et al. Int J Mol Sci. .

Abstract

Ethanol (EtOH) alters many cellular processes in yeast. An integrated view of different EtOH-tolerant phenotypes and their long noncoding RNAs (lncRNAs) is not yet available. Here, large-scale data integration showed the core EtOH-responsive pathways, lncRNAs, and triggers of higher (HT) and lower (LT) EtOH-tolerant phenotypes. LncRNAs act in a strain-specific manner in the EtOH stress response. Network and omics analyses revealed that cells prepare for stress relief by favoring activation of life-essential systems. Therefore, longevity, peroxisomal, energy, lipid, and RNA/protein metabolisms are the core processes that drive EtOH tolerance. By integrating omics, network analysis, and several other experiments, we showed how the HT and LT phenotypes may arise: (1) the divergence occurs after cell signaling reaches the longevity and peroxisomal pathways, with CTA1 and ROS playing key roles; (2) signals reaching essential ribosomal and RNA pathways via SUI2 enhance the divergence; (3) specific lipid metabolism pathways also act on phenotype-specific profiles; (4) HTs take greater advantage of degradation and membraneless structures to cope with EtOH stress; and (5) our EtOH stress-buffering model suggests that diauxic shift drives EtOH buffering through an energy burst, mainly in HTs. Finally, critical genes, pathways, and the first models including lncRNAs to describe nuances of EtOH tolerance are reported here.

Keywords: CRISPR–Cas9; data integration; lncRNAs; lncRNA–protein interactions; membraneless organelles; omics; systems biology.


Conflict of interest statement

The authors declare no conflict of interest.

Figures

Figure 1
Figure 1
Experimental design. (A) Setting the phenotypes. PS: physiological solution; red and blue circles: treatment and control, respectively. The box shows examples of plates used to determine the highest EtOH tolerance. The experimental conditions that allowed or inhibited growth are represented by gray and black boxes, respectively. *: The highest EtOH level. (B) Time-course experiment. (C) Further experiments and hypothesis testing using mutants.
Figure 2
Figure 2
Cell growth and flow cytometry assays were used to evaluate EtOH stress severity. (A) Growth curve analyses of the populations of untreated cells, cells treated with the highest EtOH level previously defined, and the population rebound experiments (growth curves of the populations of cells inoculated in pure YPD medium after 1 h of treatment with the highest tolerated EtOH level). (B) Percentages of live and dead cells of each strain under control and treatment conditions. (C) Percentages of live cells of each phenotype under control and treatment conditions. The numbers above the bars are the “rate” comparing the average of the LT strains divided by the average of the HT strains. Hence, a rate > 1 indicates more live cells of the LT strains. *: Rate between LT divided by HT.
Figure 3
Figure 3
LncRNA propagation analysis of lncRNA–protein subnetworks associated with EtOH stress-responsive genes. The node colors are related to the biological functions depicted at the bottom of the picture. Only lncRNAs and proteins related to differentially expressed genes were evaluated in this analysis. The conjectures and basis for assigning the functions of lncRNAs presented here are reported in the “Supplementary Text” (“Discussion”, topic “1”).
Figure 4
Figure 4
Essential subsystems showing phenotypic differences using BMA64-1A and S288C as models. (A) Comparison between the networks modeled based on the time-course and KEGG data. The dotted line delimits the communities with expression activation profiles. (B) Overview of the time-course expression profiles from the data shown in (A) under stress. (C) Analysis of information flow from pathways labeled with “*”. (D) Time-course landscapes of the crucial genes we suggest triggering the differences in the expression phenotype of cells under stress. (E) Population rebound after stress relief in WT and BMA64-1A CTA1Δ strains. (F) Spot test of the BMA64-1A CTA1Δ strain. The white dots (nodes) in (A) and (C) are genes/proteins.
Figure 5
Figure 5
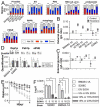
Analysis of genes related to EtOH stress-responsive storage and degradation mechanisms and external conditions of the medium for EtOH-stressed cells. (A) The numbers above the bars indicate the percentage of genes related to EtOH stress-responsive storage and degradation systems that were not differentially expressed (D,E) or upregulated. PB, P-bodies. SG, stress granules. PSG proteasome storage granules. RNA cat. proc., RNA catabolic process. PPPR, protein polyubiquitination and positive regulation of ubiquitination. PDNR, protein deubiquitination and negative regulation of ubiquitination. The full list of affected genes is reported in the Supplementary Text, ‘Results’, topic ‘4.3.5.’ (B,C) Glucose and glycerol levels. Each Y value represents a concentration rate between 1 and 0 h within the control and treatment groups. Therefore, higher values indicate lower glycerol yield or estimated glucose consumption after 1 h. (D) Western blot results. C and T over the bands indicate the control and treatment groups. (E) Normalized YPD pH level (see Equations (1) and (2) in the Supplementary Text, ‘Methods’, topic ‘3.1’). In the right box is depicted the colors and shapes of this graphic. (F) Cell growth in the pH quantification experiment (E). *, adjusted p value < 0.0001.
Figure 6
Figure 6
EtOH stress-buffering model based on the diauxic shift. The CoA indicates acetyl-CoA. This model was based on the integration of several datasets reported in Figure 3, Figure 4 and Figure 5, Table 2, Supplementary Tables S5, S6, S14 and S15, Supplementary Figures S2G–I, S5, S8, S10–S12 and S27.
Figure 7
Figure 7
Subsystem model harboring the lncRNA transcr_20548, the diauxic shift, and EtOH stress-buffering genes. (A) BMA64-1A and S288C subnetworks. Small boxes represent the time-course data for each gene. Nodes with the same color have a similar time-course profile. These subnetworks were manually curated, including published data, information from the SGD database, and transcriptome time-course data from BMA64-1A and S288C. (B) BMA64-1A subnetwork dynamic network simulations of ordinary differential equations based on the transcriptome time-course of treatment conditions that simulate gene expression in virtual BMA64-1A WT and mutants. (C) Population rebound after stress relief in WT and BMA64-1A CRISPR–Cas9 mutants. * indicates a p value < 0.01. (D) EtOH tolerance spot test.

References

    1. Xiao T., Khan A., Shen Y., Chen L., Rabinowitz J.D. Glucose Feeds the Tricarboxylic Acid Cycle via Excreted Ethanol in Fermenting Yeast. Nat. Chem. Biol. 2022;18:1380–1387. doi: 10.1038/s41589-022-01091-7. - DOI - PubMed
    1. Auesukaree C. Molecular Mechanisms of the Yeast Adaptive Response and Tolerance to Stresses Encountered during Ethanol Fermentation. J. Biosci. Bioeng. 2017;124:133–142. doi: 10.1016/j.jbiosc.2017.03.009. - DOI - PubMed
    1. Morard M., Macías L.G., Adam A.C., Lairón-Peris M., Pérez-Torrado R., Toft C., Barrio E. Aneuploidy and Ethanol Tolerance in Saccharomyces cerevisiae. Front. Genet. 2019;10:82. doi: 10.3389/fgene.2019.00082. - DOI - PMC - PubMed
    1. Yang J., Tavazoie S. Regulatory and Evolutionary Adaptation of Yeast to Acute Lethal Ethanol Stress. PLoS ONE. 2020;15:e0239528. doi: 10.1371/journal.pone.0239528. - DOI - PMC - PubMed
    1. Šoštarić N., Arslan A., Carvalho B., Plech M., Voordeckers K., Verstrepen K.J., van Noort V. Integrated Multi-Omics Analysis of Mechanisms Underlying Yeast Ethanol Tolerance. J. Proteome Res. 2021;20:3840–3852. doi: 10.1021/acs.jproteome.1c00139. - DOI - PMC - PubMed

MeSH terms

LinkOut - more resources