. 2023 Mar 15;24(6):5651.
doi: 10.3390/ijms24065651.

Shared Genes of PPARG and NOS2 in Alzheimer's Disease and Ulcerative Colitis Drive Macrophages and Microglia Polarization: Evidence from Bioinformatics Analysis and Following Validation

Affiliations

Shared Genes of PPARG and NOS2 in Alzheimer's Disease and Ulcerative Colitis Drive Macrophages and Microglia Polarization: Evidence from Bioinformatics Analysis and Following Validation

Longcong Dong et al. Int J Mol Sci. .

Abstract

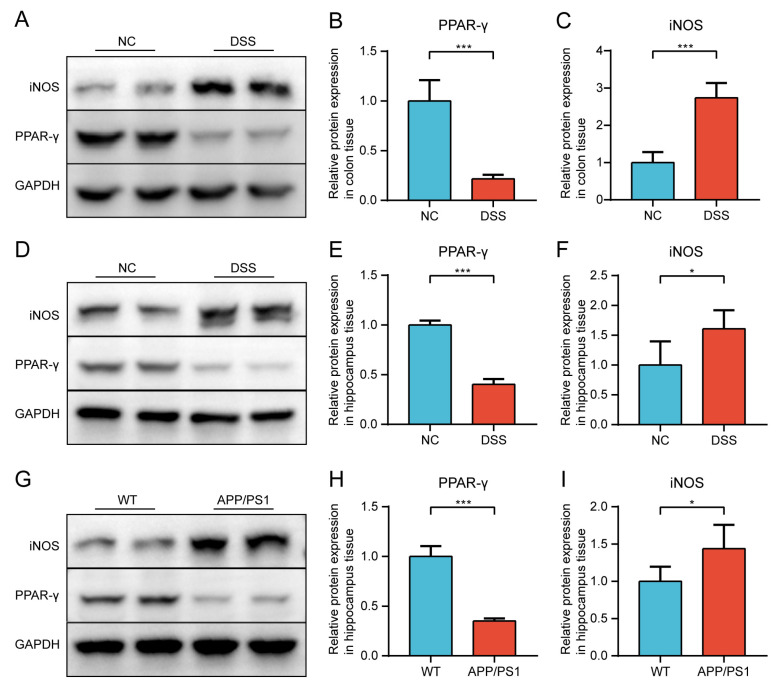
Emerging evidence shows that peripheral systemic inflammation, such as inflammatory bowel disease (IBD), has a close even interaction with central nervous disorders such as Alzheimer's disease (AD). This study is designed to further clarify the relationship between AD and ulcerative colitis (UC, a subclass of IBD). The GEO database was used to download gene expression profiles for AD (GSE5281) and UC (GSE47908). Bioinformatics analysis included GSEA, KEGG pathway, Gene Ontology (GO), WikiPathways, PPI network, and hub gene identification. After screening the shared genes, qRT-PCR, Western blot, and immunofluorescence were used to verify the reliability of the dataset and further confirm the shared genes. GSEA, KEGG, GO, and WikiPathways suggested that PPARG and NOS2 were identified as shared genes and hub genes by cytoHubba in AD and UC and further validated via qRT-PCR and Western blot. Our work identified PPARG and NOS2 are shared genes of AD and UC. They drive macrophages and microglia heterogeneous polarization, which may be potential targets for treating neural dysfunction induced by systemic inflammation and vice versa.

Keywords: Alzheimer’s disease; NOS2; PPARG; bioinformatics; shared gene; ulcerative colitis.


Conflict of interest statement

The authors declare no conflict of interest.

Figures

Figure 1
Figure 1
GSEA for the sample with GSE5281 (AD) and GSE47908 (UC). (a,b) GSEA analysis revealed that the genes of GSE5281 (AD) and GSE47908 (UC) were both enriched in terms of human diseases. (ch) GSEA analysis revealed that the genes of GSE5281 (AD) and GSE47908 (UC) were both enriched in terms of metabolism.
Figure 2
Figure 2
Identified co-DEGs in AD and UC. (a) Volcano plots of DEGs from GSE5281 (AD). (b) Heatmap of DEGs from GSE5281 (AD). (c) Volcano plots of DEGs from GSE47908 (UC). (d) Heatmap of DEGs from GSE47908 (UC). (e) Venn diagram of co-DEGs extracted from DEGs of AD and DEGs of UC.
Figure 3
Figure 3
Functional annotation for co-DEGs. (a) Biological process, (b) cellular component, (c) molecular function, and (d) WikiPathways of the co-DEGs.
Figure 4
Figure 4
Constructed PPI network, determined hub genes, and ROC analysis and validation. (a) PPI network of co-DEGs. (b) CytoHubba to screen the top ten candidate hub genes by the MCC algorithm. ROC curves of hub genes related to PPARG in AD (c) and UC (d).
Figure 5
Figure 5
qRT-PCR results in hippocampus and colon tissues. The relative expression of Pparg (a), Nos2 (b), Cxcl1 (c), Sele (d), and Hsp90ab1 (e) in hippocampus tissues of APP/PS1 mice and WT mice. The relative expression of Pparg (f), Nos2 (g), Cxcl1 (h), Sele (i), and Hsp90ab1 (j) in colon tissues of DSS-induced mice and NC mice. Data are shown as mean ± SD. n = 6 in each group. * p < 0.05, ** p < 0.01, *** p < 0.001 (independent sample t-test, Mann-Whitney U test, and Welch t′ test).
Figure 6
Figure 6
The relative expression was validated via WB. (A) Representative Western blot image of PPAR-γ and iNOS in colon tissues between DSS-induced mice and NC mice. (B) Quantification of Western blot analysis for PPAR-γ. (C) Quantification of Western blot analysis for iNOS. (D) Representative Western blot image of PPAR-γ and iNOS in hippocampus tissues between DSS-induced mice and NC mice. (E) Quantification of Western blot analysis for PPAR-γ. (F) Quantification of Western blot analysis for iNOS. (G) Representative Western blot image of PPAR-γ and iNOS in hippocampus tissues between APP/PS1 mice and WT mice. (H) Quantification of Western blot analysis for PPAR-γ. (I) Quantification of Western blot analysis for iNOS. Data are shown as mean ± SD. n = 6 in each group. * p < 0.05, *** p < 0.001 (independent sample t-test).
Figure 7
Figure 7
The PPAR-γ expression in different groups. (a) Colon was stained with anti-PPAR-γ in the NC group and DSS group. (b) Hippocampus was stained with anti-PPAR-γ in the NC group and DSS group. (c) Hippocampus was stained with anti-PPAR-γ in the WT group and APP/PS1 group. (Red expresses PPAR-γ+ cells, and blue expresses Dapi. The white arrow expresses PPAR-γ+ cells.). Magnification ×200, n = 3 in each group.
Figure 8
Figure 8
M1 macrophage polarization was promoted, and M2 macrophage polarization was suppressed in the colon of DSS-induced mice. (a) Macrophages of the colon were double-stained with anti-iNOS and anti-F4/80 antibodies and were observed on the fluorescent image. (Red expresses iNOS+ cells, green expresses F4/80+ cells, and blue expresses Dapi. The white arrow expresses F4/80+iNOS+ cells). (b) Macrophages of the colon were double-stained with anti-Arg1 and anti-F4/80 antibodies and were observed on the fluorescent image. (Red expresses Arg1+ cells, green expresses F4/80+ cells, and blue expresses Dapi. The white arrow expresses F4/80+Arg1+ cells). Magnification × 200, n = 3 in each group.
Figure 9
Figure 9
M1 microglia polarization was promoted, and M2 microglia polarization was suppressed in the hippocampus of DSS-induced mice. (a) Microglia of the hippocampus were double-stained with anti-iNOS, and anti-Iba1 antibodies were observed on the fluorescent image. (Red expresses iNOS+ cells, green expresses Iba1+ cells, and blue expresses Dapi. The white arrow expresses Iba1+iNOS+ cells). (b) Microglia of the hippocampus were double-stained with anti-Arg1, and anti-Iba1 antibodies were observed on the fluorescent image. (Red expresses Arg1+ cells, green expresses Iba1+ cells, and blue expresses Dapi. The white arrow expresses Iba1+Arg1+ cells). Magnification ×200, n = 3 in each group.
Figure 10
Figure 10
M1 microglia polarization was promoted, and M2 microglia polarization was suppressed in the hippocampus of APP/PS1 mice. (a) Microglia of the hippocampus were double-stained with anti-iNOS and anti-Iba1 antibody and was observed on the fluorescent image. (Red expresses iNOS+ cells, green expresses Iba1+ cells, and blue expresses Dapi. The white arrow expresses Iba1+iNOS+ cells). (b) Microglia of the hippocampus were double-stained with anti-Arg1 and anti-Iba1 antibodies and were observed on the fluorescent image. (Red expresses Arg1+ cells, green expresses Iba1+ cells, and blue expresses Dapi. The white arrow expresses Iba1+Arg1+ cells). Magnification ×200, n = 3 in each group.
Figure 11
Figure 11
Summary and flow chart of the study. Firstly, PPARG and NOS2 were the shared genes of AD and UC through bioinformatics analysis of GSE5281 (AD) and GSE47908 (UC) in the GEO database. Then, DSS-induced mice and APP/PS1 mice were used to further verify the results of bioinformatics analysis and explore the potential relationship between the two diseases. The expression level of Arg1 (a biomarker of M2-type polarization) in the macrophages of the colon and microglia of the hippocampus (DSS-induced mice) and microglia of the hippocampus (APP/PS1 mice) decreased significantly, while the expression level of iNOS (a biomarker of M1-type polarization) increased significantly were confirmed.

References

    1. Marizzoni M., Cattaneo A., Mirabelli P., Festari C., Lopizzo N., Nicolosi V., Mombelli E., Mazzelli M., Luongo D., Naviglio D., et al. Short-Chain Fatty Acids and Lipopolysaccharide as Mediators Between Gut Dysbiosis and Amyloid Pathology in Alzheimer’s Disease. J. Alzheimer’s Dis. 2020;78:683–697. doi: 10.3233/JAD-200306. - DOI - PubMed
    1. Osadchiy V., Martin C.R., Mayer E.A. The Gut-Brain Axis and the Microbiome: Mechanisms and Clinical Implications. Clin. Gastroenterol. Hepatol. 2019;17:322–332. doi: 10.1016/j.cgh.2018.10.002. - DOI - PMC - PubMed
    1. Lee H.S., Lobbestael E., Vermeire S., Sabino J., Cleynen I. Inflammatory bowel disease and Parkinson’s disease: Common pathophysiological links. Gut. 2021;70:408–417. doi: 10.1136/gutjnl-2020-322429. - DOI - PubMed
    1. Li Y., Chen Y., Jiang L., Zhang J., Tong X., Chen D., Le W. Intestinal Inflammation and Parkinson’s Disease. Aging Dis. 2021;12:2052–2068. doi: 10.14336/AD.2021.0418. - DOI - PMC - PubMed
    1. Liao P.H., Chiang H.L., Shun C.T., Hang J.F., Chiu H.M., Wu M.S., Lin C.H. Colonic Leucine-Rich Repeat Kinase 2 Expression Is Increased and Associated With Disease Severity in Patients With Parkinson’s Disease. Front. Aging Neurosci. 2021;13:819373. doi: 10.3389/fnagi.2021.819373. - DOI - PMC - PubMed