. 2023 Mar 17;24(6):5730.
doi: 10.3390/ijms24065730.

Inappropriate Expression of PD-1 and CTLA-4 Checkpoints in Myeloma Patients Is More Pronounced at Diagnosis: Implications for Time to Progression and Response to Therapeutic Checkpoint Inhibitors

Affiliations

Inappropriate Expression of PD-1 and CTLA-4 Checkpoints in Myeloma Patients Is More Pronounced at Diagnosis: Implications for Time to Progression and Response to Therapeutic Checkpoint Inhibitors

Anna Kulikowska de Nałęcz et al. Int J Mol Sci. .

Abstract

Multiple myeloma (MM) is a hematologic malignancy characterized by severely profound immune dysfunction. Therefore, the efficacy of drugs targeting the immune environments, such as immune checkpoint inhibitors (ICIs), is of high clinical importance. However, several clinical trials evaluating ICIs in MM in different therapeutic combinations revealed underwhelming results showing a lack of clinical efficacy and excessive side effects. The underlying mechanisms of resistance to ICIs observed in the majority of MM patients are still under investigation. Recently, we demonstrated that inappropriate expression of PD-1 and CTLA-4 on CD4 T cells in active MM is associated with adverse clinical outcomes and treatment status. The aim of the current study was to determine the usefulness of immune checkpoint expression assessment as a predictive biomarker of the response to therapeutic inhibitors. For this purpose, along with checkpoint expression estimated by flow cytometry, we evaluated the time to progression (TTP) of MM patients at different clinical stages (disease diagnosis and relapse) depending on the checkpoint expression level; the cut-off point (dividing patients into low and high expressors) was selected based on the median value. Herein, we confirmed the defective levels of regulatory PD-1, CTLA-4 receptors, and the CD69 marker activation in newly diagnosed (ND) patients, whereas relapsed/refractory patients (RR) exhibited their recovered values and reactivity. Additionally, substantially higher populations of senescent CD4+CD28- T cells were found in MM, primarily in NDMM subjects. These observations suggest the existence of two dysfunctional states in MM CD4 T cells with the predominance of immunosenescence at disease diagnosis and exhaustion at relapse, thus implying different responsiveness to the external receptor blockade depending on the disease stage. Furthermore, we found that lower CTLA-4 levels in NDMM patients or higher PD-1 expression in RRMM patients may predict early relapse. In conclusion, our study clearly showed that the checkpoint level in CD4 T cells may significantly affect the time to MM progression concerning the treatment status. Therefore, when considering novel therapies and potent combinations, it should be taken into account that blocking PD-1 rather than CTLA-4 might be a beneficial form of immunotherapy for only a proportion of RRMM patients.

Keywords: CTLA-4; PD-1; clinical response; immune checkpoint inhibitors; multiple myeloma; time to progression.


Conflict of interest statement

The authors declare no conflict of interest.

Figures
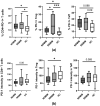
Figure 1
Figure 1
PD-1 expression on PB CD4 T cell subtypes of MM patients in the different clinical stages and healthy controls. (a) Frequency of PD-1-expressing CD4+ T cells (identified as CD3+CD4+), Treg (identified as CD4+CD127), and Teff (identified as CD4+CD127+) cells in healthy controls (HC) (n = 20) and patient subgroups (NDMM and RRMM) (n = 26 and n = 14, respectively). (b) PD-1 level (determined as mean fluorescence intensity) in CD4+ T cells, Treg, and Teff cells in HC (n = 20), NDMM (n = 26), and RRMM (n = 14) patients. Boxes and whiskers show 25th and 75th interquartile range and minimum–maximum, respectively; the median is the central line in each box. The differences between the studied groups were statistically evaluated using Kruskal–Wallis, ANOVA, and Mann–Whitney U tests. * p < 0.05, *** p < 0.001.
Figure 2
Figure 2
CTLA-4 expression on PB CD4 T cell subtypes of MM patients in the different clinical stages and healthy controls. (a) Frequency of CTLA-4 expressing CD4+ T cells (identified as CD3+CD4+), Treg (identified as CD4+CD127), and Teff (identified as CD4+CD127+) cells in healthy controls (HC) (n = 20) and patient subgroups (NDMM and RRMM) (n = 26 and n = 14, respectively). (b) CTLA-4 level (determined as mean fluorescence intensity) in CD4+ T cells, Treg, and Teff cells in HC (n = 20), NDMM (n = 26), and RRMM (n = 14) patients. Boxes and whiskers show 25th and 75th interquartile range and minimum–maximum, respectively; the median is the central line in each box. The differences between the studied groups were statistically evaluated using Kruskal–Wallis, ANOVA, and Mann–Whitney U tests. * p < 0.05, ** p < 0.01, *** p < 0.001.
Figure 3
Figure 3
Influence of CTLA-4 expression on the time to progression (TTP). (a) TTP in patients with high and low CTLA-4 expression in CD4+ T cells (shown as CTLA-4 fluorescence intensity) identified as >median and ≤median values, respectively, in the whole patient cohort (MM) (n = 40) and patient subgroups (NDMM and RRMM) (n = 26 and n = 14, respectively). (b) TTP in patients with high and low CTLA-4 expression in Teff cells (shown as CTLA-4 fluorescence intensity) identified as >median and ≤median values, respectively, in the whole patient cohort (MM) (n = 40). The log-rank test was performed for the Kaplan–Meier curves.
Figure 4
Figure 4
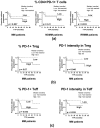
Influence of PD-1 expression on the time to progression (TTP). (a) TTP in patients with high and low frequency of PD-1 positive CD4+ T cells identified as >median and ≤median values, respectively, in the whole patient cohort (MM) (n = 40) and patient subgroups (NDMM and RRMM) (n = 26 and n = 14, respectively). (b) TTP in patients with high and low PD-1 expression in Treg cells (shown as the frequency of PD-1+ Treg cells and as PD-1 fluorescence intensity in Treg), identified as >median and ≤median values, respectively, in the whole patient cohort (MM) (n = 40). (c) TTP in patients with high and low expression of PD-1 in Teff cells (shown as frequency of PD-1+ Teff and as PD-1 fluorescence intensity in Teff) identified as >median and ≤median values, respectively, in the whole patient cohort (MM) (n = 40). The log-rank test was performed for the Kaplan–Meier curves.
Figure 5
Figure 5
Markers of CD4 T cell reactivity. (a) Expression of the CD69 activation marker on CD4+ T cells in PB of healthy controls (HC) (n = 20) and patient subgroups (NDMM and RRMM) (n = 26 and n = 14, respectively). (b) Frequency of CD28 lacking CD4+ T cells at the different MM stages. Boxes and whiskers show 25th and 75th interquartile range and minimum–maximum, respectively; the median is the central line in each box. The differences between the studied groups were statistically evaluated using Kruskal–Wallis, ANOVA, and Mann–Whitney U tests. * p < 0.05, *** p < 0.001.
Figure 6
Figure 6
Predictive significance of the clinico-pathological characteristics of MM patients. (a) Levels of β2-microblobulin, (b) anemia, and (c) percentages of circulating plasmacytes (PLCs) affect the time to progression (TTP) of MM patients (n = 40). The log-rank test was performed for the Kaplan–Meier curves.

Similar articles

Cited by

References

    1. Favaloro J., Brown R., Aklilu E., Yang S., Suen H., Hart D., Fromm P., Gibson J., Khoo L., Ho P.J., et al. Myeloma skews regulatory and pro-inflammatory T helper 17 cell balance in favor of a suppressive state. Leuk. Lymphoma. 2015;55:1090–1098. doi: 10.3109/10428194.2013.825905. - DOI - PubMed
    1. Favaloro J., Liyadipitiya T., Brown R., Yang S., Suen H., Woodland N., Nassif N., Hart D., Fromm P., Weatherburn C., et al. Myeloid derived suppressor cells are numerically, functionally, and phenotypically different in patients with multiple myeloma. Leuk. Lymphoma. 2014;55:2893–2900. doi: 10.3109/10428194.2014.904511. - DOI - PubMed
    1. Brown R., Suen H., Favaloro J., Yang S., Ho P.J., Gibson J., Joshua D. Trogocytosis generates acquired regulatory T cells adding further complexity to the dysfunctional immune response in multiple myeloma. Oncoimmunology. 2012;1:1658–1660. doi: 10.4161/onci.22032. - DOI - PMC - PubMed
    1. Brown R.D., Pope B., Murray A., Esdale W., Sze D.M., Gibson J., Ho P.J., Hart D., Joshua D. Dendritic cells from patients with myeloma are numerically normal but functionally defective as they fail to up-regulate CD80 (B7-1) expression after huCD40LT stimulation because of inhibition by transforming growth factor-β1 and interleukin-10. Blood. 2001;98:2992–2998. doi: 10.1182/blood.V98.10.2992. - DOI - PubMed
    1. Bryant C., Suen H., Brown R., Yang S., Favaloro J., Aklilu E., Gibson J., Ho P.J., Iland H., Fromm P., et al. Long-term survival in multiple myeloma is associated with a distinct immunological profile, which includes proliferative cytotoxic T cell clones and a favourable Treg/Th17 balance. Blood Cancer J. 2013;3:e148. doi: 10.1038/bcj.2013.34. - DOI - PMC - PubMed

Substances