. 2023 Mar 7;12(6):2094.
doi: 10.3390/jcm12062094.

Human Digital Twin for Personalized Elderly Type 2 Diabetes Management

Affiliations

Human Digital Twin for Personalized Elderly Type 2 Diabetes Management

Padmapritha Thamotharan et al. J Clin Med. .

Abstract

Managing Elderly type 2 diabetes (E-T2D) is challenging due to geriatric conditions (e.g., co-morbidity, multiple drug intake, etc.), and personalization becomes paramount for precision medicine. This paper presents a human digital twin (HDT) framework to manage E-T2D that exploits various patient-specific data and builds a suite of models exploiting the data for prediction and management to personalize diabetes treatment in E-T2D patients. These models include mathematical and deep-learning ones that capture different patient aspects. Consequently, the HDT virtualizes the patient from different viewpoints using an HDT that mimics the patient and has interfaces to update the virtual models simultaneously from measurements. Using these models the HDT obtains deeper insights about the patient. Further, an adaptive patient model fusing this information and a learning-based model predictive control (LB-MPC) algorithm are proposed. The geriatric conditions are captured as model parameters and constraints while solving the LB-MPC to personalize the insulin infusion for E-T2D management. The HDT is deployed on and illustrated with 15 patients using clinical trials and simulations. Our results show that HDT helps improve the time-in-range from 3-75% to 86-97% and reduces insulin infusion by 14-29%.

Keywords: Elderly type 2 diabetes (E-T2D); digital twin (DT); human digital twin (HDT); internet of medical things (IoMT); learning-based model predictive control (LB-MPC); personalization; precision medicine.


Conflict of interest statement

The authors declare no conflict of interest.

Figures

Figure 1
Figure 1
HDT architecture.
Figure 2
Figure 2
Precision Treatment Methods Through HDT—The HDT framework leads to new data, novel models that create additional knowledge, and improved decision support through new degrees of freedom.
Figure 3
Figure 3
IoMT Architecture—Data transfer using IoT sensor devices from patients’ (left), mounted devices to edge nodes (center) to the HDT architecture and finally to medical personnel and caretakers using a mobile app.
Figure 4
Figure 4
Simulated web page view of the patient’s data.
Figure 5
Figure 5
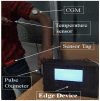
Real-time patient data collection system using temperature sensor, pulse oximeter, CGM, sensor tag, and Edge device to display the data.
Figure 6
Figure 6
Structure of the LSTM Network for Blood Glucose Level Predictions.
Figure 7
Figure 7
BGL prediction using time segmentation.
Figure 8
Figure 8
LSTM prediction result for P1.
Figure 9
Figure 9
LSTM prediction result for P2.
Figure 10
Figure 10
Structured Time-Series Analysis—The y-axis in the upper panel is BGL (mg/dL), and the time interval is 15 min.
Figure 11
Figure 11
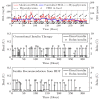
Time-Series Analysis: Motif Discovery between days of a P1. (Top) Dependent variable (BGL) versus time whereas the bottom show independent (controllable) behaviors (insulin) and CHO in food.
Figure 12
Figure 12
Time-Series Analysis: Motif Discovery between days of P1—The upper panel shows a dependent variable (BGL) versus time whereas the lower panel shows independent (controllable) behaviors (insulin) and the dependent variable CHO.
Figure 13
Figure 13
Model predictions for P1–P5—The time step is 15 min, and the BGL is predicted for one step ahead.
Figure 14
Figure 14
Testing Protocol.
Figure 15
Figure 15
Patient data.
Figure 16
Figure 16
Snap-shot of one day data collected from a patient.
Figure 17
Figure 17
Vital Sign Monitoring Using Mobile App—Top figure shows the body temperature data, the middle shows the heart rate data, and the bottom figure shows SpO2 data.
Figure 18
Figure 18
ACF and PACF plot for P1.
Figure 19
Figure 19
Time-Series Analysis: Motif Discovery between days 9 and 10 of P1.
Figure 20
Figure 20
Motif Discovery between patient P1&P4: Motif shows days with similar patterns. Patient P4 has lower BGL than P1 due to active lifestyle and relatively lower co-morbid conditions.
Figure 21
Figure 21
Time-Series Analysis: Motif Discovery between P4&P13P4 has a lower magnitude of BGL profile even with high average CHO and less insulin infusion.
Figure 22
Figure 22
Explanations for three randomly selected samples of patient P1. (a): An actual sample in the hyperglycemic range detected with high probability through XAI as basal value of 0.02, (b): sample 2 that is in Euglycemic range being detected with high probability with Insulin actual values, (c): Sample in Euglycemic range detected with probability of 0.64 through basal and bolus.
Figure 23
Figure 23
Explanations for three randomly selected samples of patient P1. (a): Sample showing hyper condition and explained through basal and bolus values even though CHO is low, (b): A hyper glycemic sample explained through basal values even when the food CHO is low, and (c): random sample detected to be hyper glycemic based on basal and bolus values.
Figure 24
Figure 24
Insulin recommendation and BGL for P1—Top panel shows the comparison between uncontrolled BGL variations during the clinical trial and controlled BGL using HDT framework. The middle plot shows insulin infusion during the clinical trial, whereas insulin recommendation from HDT is shown in the bottom plot.
Figure 25
Figure 25
Insulin recommendation and BGL for P2—Comparison between uncontrolled clinical trial and controlled BGL excursions with HDT framework is shown in the top plot. The middle plot shows the insulin recommendation during the clinical trial, and the bottom plot shows the insulin recommendation from HDT.
Figure 26
Figure 26
Insulin recommendation and BGL for P13—Comparison between uncontrolled clinical trial and controlled BGL excursions with HDT framework is shown in the top plot. The middle plot shows the insulin recommendation during the clinical trial. The bottom plot shows insulin recommendations from HDT.
Figure 27
Figure 27
Percent improvement in Time in Range for 15 patients.
Figure 28
Figure 28
Percent improvement in hypo events for 15 patients with HDT.
Figure 29
Figure 29
Percent improvement in hyper events for 15 patients with HDT.

References

    1. Cole J.B., Florez J.C. Genetics of diabetes mellitus and diabetes complications. Nat. Rev. Nephrol. 2020;16:377–390. doi: 10.1038/s41581-020-0278-5. - DOI - PMC - PubMed
    1. Ferlita S., Yegiazaryan A., Noori N., Lal G., Nguyen T., To K., Venketaraman V. Type 2 diabetes mellitus and altered immune system leading to susceptibility to pathogens, especially Mycobacterium tuberculosis. J. Clin. Med. 2019;8:2219. doi: 10.3390/jcm8122219. - DOI - PMC - PubMed
    1. Triposkiadis F., Xanthopoulos A., Bargiota A., Kitai T., Katsiki N., Farmakis D., Skoularigis J., Starling R.C., Iliodromitis E. Diabetes mellitus and heart failure. J. Clin. Med. 2021;10:3682. doi: 10.3390/jcm10163682. - DOI - PMC - PubMed
    1. Bellary S., Kyrou I., Brown J.E., Bailey C.J. Type 2 diabetes mellitus in older adults: Clinical considerations and management. Nat. Rev. Endocrinol. 2021;17:534–548. doi: 10.1038/s41574-021-00512-2. - DOI - PubMed
    1. McAdams B.H., Rizvi A.A. An overview of insulin pumps and glucose sensors for the generalist. J. Clin. Med. 2016;5:5. doi: 10.3390/jcm5010005. - DOI - PMC - PubMed

LinkOut - more resources