. 2023 Mar 13;12(6):2207.
doi: 10.3390/jcm12062207.

Clinical Predictors and Prediction Models for rFVIII-Fc Half Life in Real-World People with Severe Hemophilia A

Affiliations

Clinical Predictors and Prediction Models for rFVIII-Fc Half Life in Real-World People with Severe Hemophilia A

Chia-Yau Chang et al. J Clin Med. .

Abstract

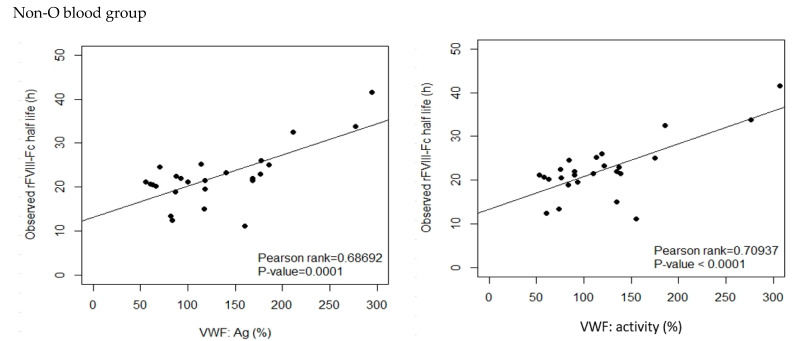
The half life of recombinant factor VIII-Fc (rFVIII-Fc) for people with hemophilia A (PwHA) varies greatly. Understanding the factors influencing the variation and assessment of rFVIII-Fc half life is important for personalized treatment. Eighty-five severe-type PwHA with rFVIII-Fc treatment receiving an evaluation of half life by the Web-Accessible Population Pharmacokinetic (PK) Service-Hemophilia during 2019-2021 were retrospectively enrolled. The 50-patient PK profiles before 2021 were used for analysis and developing prediction models of half life, and the 35-patient PK profiles in 2021 were used for external validation. The patients in the development cohort were aged 8-64, with a median rFVIII-Fc half life of 20.75 h (range, 8.25-41.5 h). By multivariate linear regression analysis, we found two, four, and five predictors of rFVIII-Fc half life for the blood groups non-O, O patients, and overall patients, respectively, including baseline VWF:Ag, BMI, VWF:activity/VWF:Ag ratio, body weight, O blood group, inhibitor history, HCV infection, and hematocrit. The three prediction equations of rFVIII-Fc half life (T) were respectively developed as T for non-O group patients = -0.81 + 0.63 × (BMI, kg/m2) + 6.07 × (baseline VWF:Ag, IU/mL), T for O group patients = -0.68 + 13.30 × (baseline VWF:Ag, IU/mL) + 0.27 × (BW, kg) - 1.17 × (BMI, kg/m2) + 16.02 × (VWF:activity/VWF:Ag ratio), and T for overall patients = -1.76 + 7.24 × (baseline VWF:Ag, IU/mL) - 3.84 × (Inhibitor history) + 2.99 × (HCV infection) - 2.83 × (O blood group) + 0.30 × (Hct, %), which explained 51.97%, 75.17%, and 66.38% of the half life variability, respectively. For external validation, there was a significant correlation between the predicted and observed half lives in the validation cohort. The median half life deviation was +1.53 h, +1.28 h, and +1.79 h for the equations of non-O group, O group, and overall group patients, respectively. In total, eight predictors influencing rFVIII-Fc half life were identified. Prediction equations of rFVIII-Fc half life were developed for the non-O and O blood groups and overall PwHA with a good degree of external validation. The equations could be applied to patients aged 8-64 without the need for PK blood sampling and clinically valuable for personalized therapy.

Keywords: external validation; half life; hemophilia A; pharmacokinetics; prediction model; predictor; rFVIII-Fc.


Conflict of interest statement

The authors state that they have no interests that might be perceived as posing a conflict or bias.

Figures

Figure 1
Figure 1
Distribution of rFVIII-Fc half lives marked by the O and non-O blood groups of the development cohort of the 50 people with hemophilia A (PwHA). The numbers above the bars denote the individual rFVIII-Fc half life (h). The gray-colored bars indicate PwHA with blood group O and appear more on the left side of the figure. The black-colored bars represent PwHA with blood group non-O and appear more on the right side.
Figure 2
Figure 2
Clinical variables, including body weight (BW), body mass index (BMI), baseline VWF:Ag, and baseline VWF:activity, related to the observed rFVIII-Fc half life in the development cohort (n = 46). Both BW and BMI had a weak or moderate positive correlation to half life (p-value < 0.01). Both baseline VWF:Ag and baseline VWF:activity had a strong positive correlation to half life (p-value < 0.0001). The drawn lines show the best fit by univariate linear regression.
Figure 3
Figure 3
Correlation between the observed rFVIII-Fc half life and baseline VWF:Ag and baseline VWF:activity, respectively, in blood group non-O and blood group O patients of the development cohort. For non-O group PwHA (n = 26), baseline VWF:Ag had a moderate positive correlation to the observed rFVIII-Fc half life (p-value < 0.001) and baseline VWF:activity had a strong positive correlation to the observed rFVIII-Fc half life (p-value < 0.001). For O group PwHA (n = 20), both baseline VWF:Ag and baseline VWF:activity had a strong positive correlation to the observed rFVIII-Fc half life (p-value < 0.001). The drawn lines show the best fit by univariate linear regression.
Figure 3
Figure 3
Correlation between the observed rFVIII-Fc half life and baseline VWF:Ag and baseline VWF:activity, respectively, in blood group non-O and blood group O patients of the development cohort. For non-O group PwHA (n = 26), baseline VWF:Ag had a moderate positive correlation to the observed rFVIII-Fc half life (p-value < 0.001) and baseline VWF:activity had a strong positive correlation to the observed rFVIII-Fc half life (p-value < 0.001). For O group PwHA (n = 20), both baseline VWF:Ag and baseline VWF:activity had a strong positive correlation to the observed rFVIII-Fc half life (p-value < 0.001). The drawn lines show the best fit by univariate linear regression.
Figure 4
Figure 4
Correlation between the observed and predicted rFVIII-Fc half life values in the development cohort: (A) for non-O group PwHA (n = 26) (p-rank = 0.74683, p-value < 0.0001); (B) for O group PwHA (n = 20) (P-rank = 0.93213, p-value < 0.0001); (C) for the entire cohort of PwHA (n = 46) (P-rank = 0.82892, p-value < 0.0001). The drawn lines show the best fit by univariate linear regression.
Figure 5
Figure 5
External validation. Correlation between the observed and predicted rFVIII-Fc half life values of the validation cohort: (A) for non-O group PwHA (n = 23) (P-rank = 0.5510, p-value < 0.01); (B) for O group PwHA (n = 12) (P-rank = 0.6157, p-value < 0.05); (C) for the entire cohort of PwHA (n = 35) (P-rank = 0.7815, p-value < 0.0001). The drawn lines show the best fit by univariate linear regression.

References

    1. Manco-Johnson M.J., Abshire T.C., Shapiro A.D., Riske B., Hacker M.R., Kilcoyne R., Ingram J.D., Manco-Johnson M.L., Funk S., Jacobson L., et al. Prophylaxis versus episodic treatment to prevent joint disease in boys with severe hemophilia. N. Engl. J. Med. 2007;357:535–544. doi: 10.1056/NEJMoa067659. - DOI - PubMed
    1. Aledort L.M., Haschmeyer R.H., Pettersson H. A longitudinal study of orthopaedic outcomes for severe factor-VIII-deficient haemophiliacs. The Orthopaedic Outcome Study Group. J. Intern. Med. 1994;236:391–399. doi: 10.1111/j.1365-2796.1994.tb00815.x. - DOI - PubMed
    1. Fischer K., van der Bom J.G., Mauser-Bunschoten E.P., Roosendaal G., Prejs R., de Kleijn P., Grobbee D.E., van den Berg M. The effects of postponing prophylactic treatment on long-term outcome in patients with severe hemophilia. Blood. 2002;99:2337–2341. doi: 10.1182/blood.V99.7.2337. - DOI - PubMed
    1. Schrijvers L.H., Schuurmans M.J., Fischer K. Promoting self-management and adherence during prophylaxis: Evidence-based recommendations for haemophilia professionals. Haemophilia. 2016;22:499–506. doi: 10.1111/hae.12904. - DOI - PubMed
    1. Hermans C., Mancuso M.E., Nolan B., Pasi K.J. Recombinant factor VIII Fc for the treatment of haemophilia A. Eur. J. Haematol. 2021;106:745–761. doi: 10.1111/ejh.13610. - DOI - PMC - PubMed

LinkOut - more resources