. 2023 Mar 15;13(3):794.
doi: 10.3390/life13030794.

In Vitro Effects of Photon Beam and Carbon Ion Radiotherapy on the Perineural Invasion of Two Cell Lines of Neurotropic Tumours

Affiliations

In Vitro Effects of Photon Beam and Carbon Ion Radiotherapy on the Perineural Invasion of Two Cell Lines of Neurotropic Tumours

Alexandra Charalampopoulou et al. Life (Basel). .

Abstract

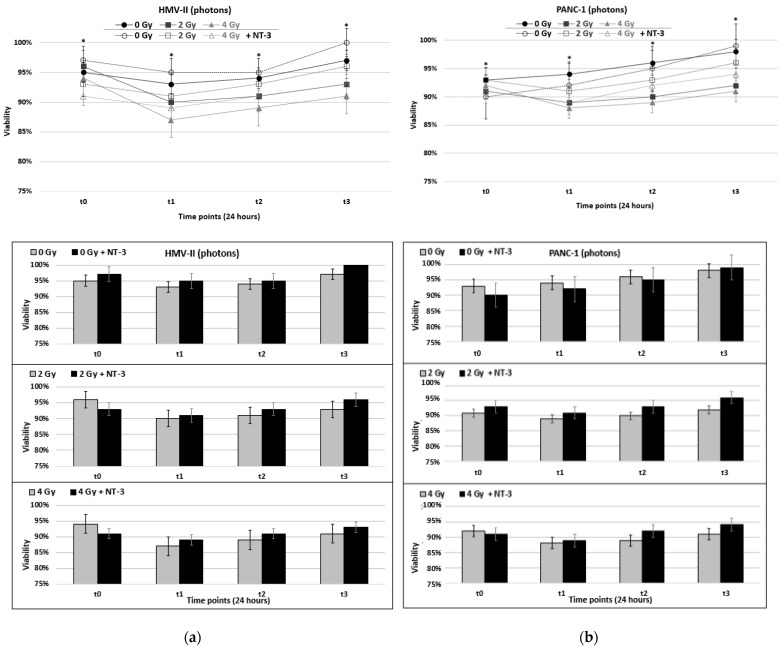
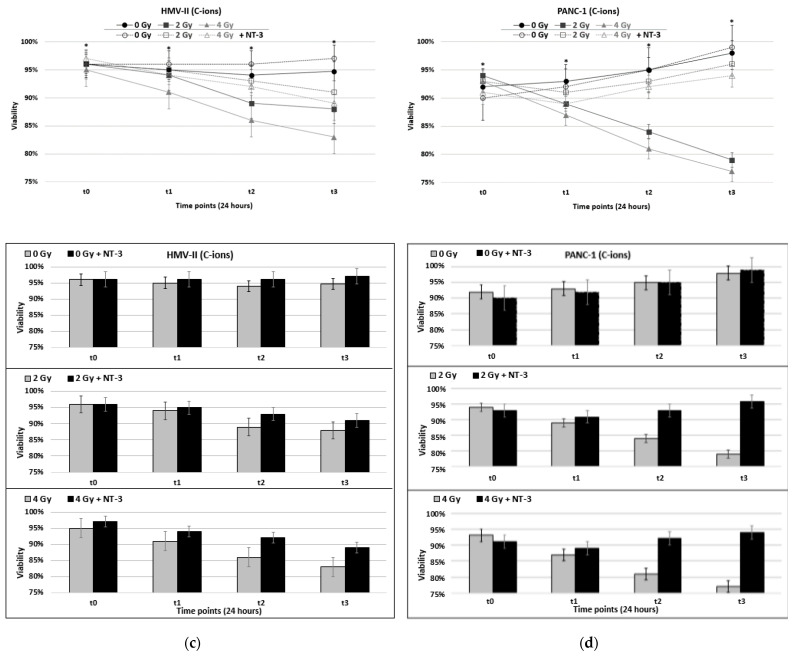
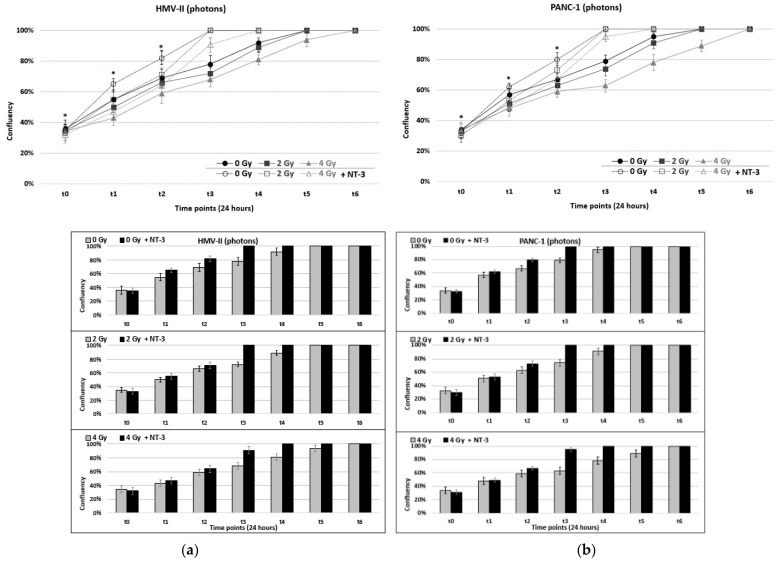
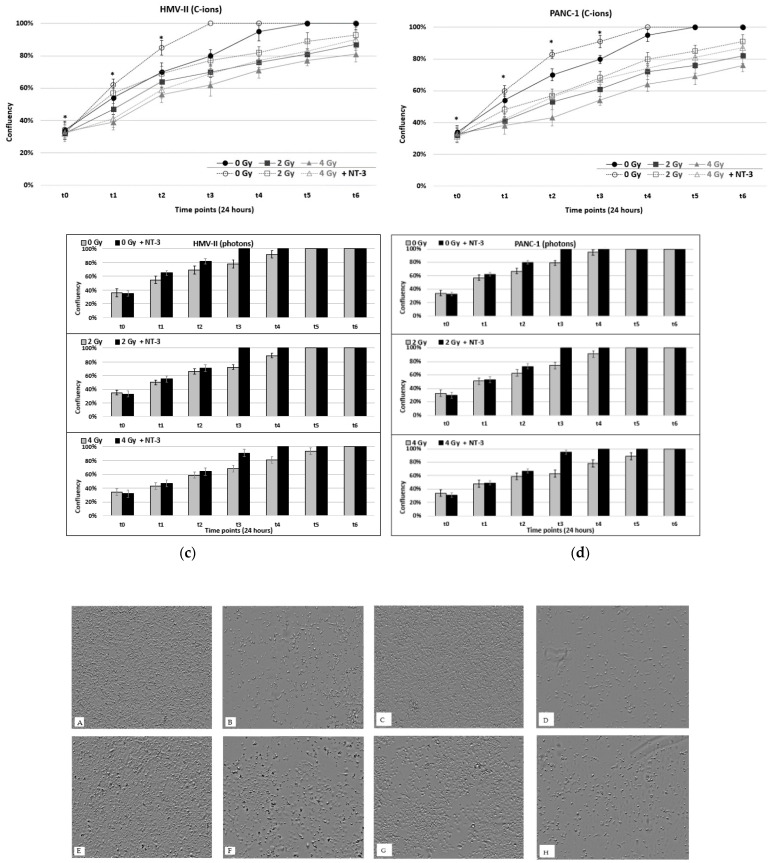
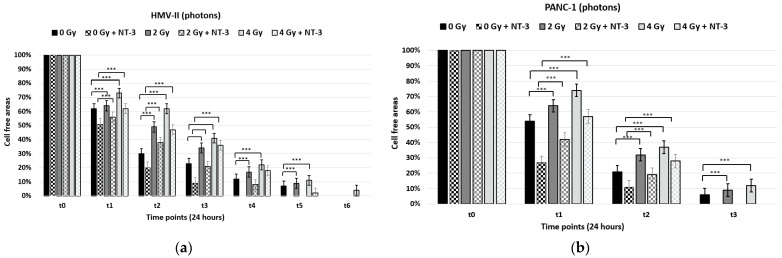
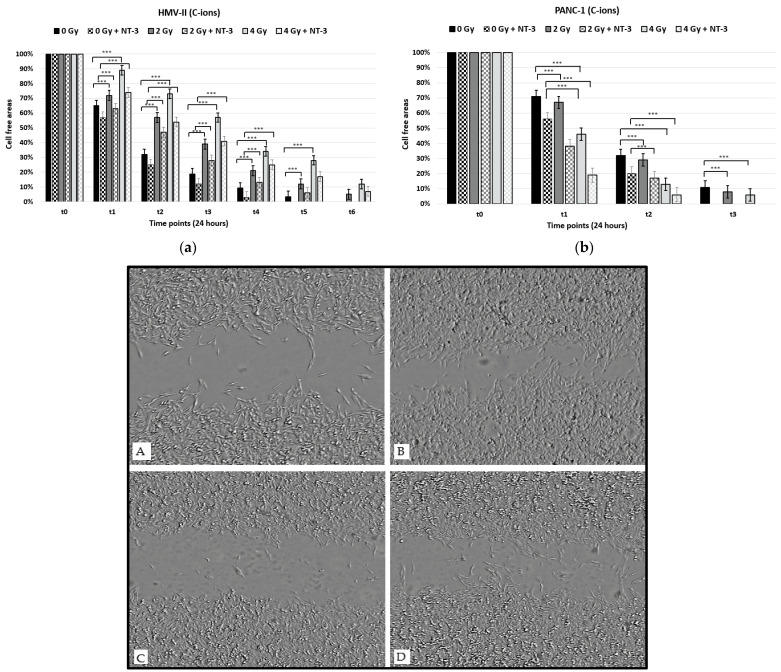
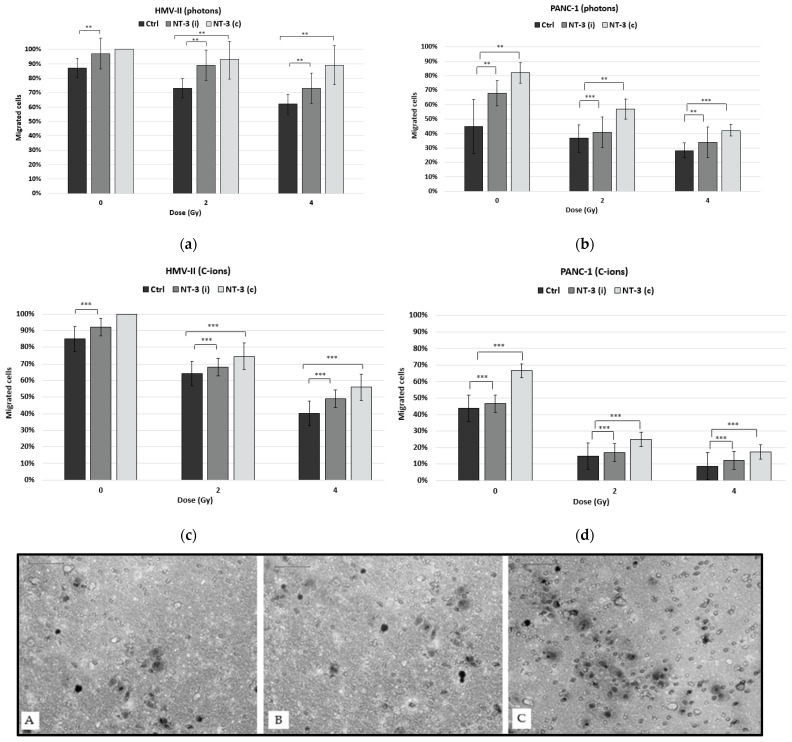
Primary mucosal melanoma (PMM) and pancreatic ductal adenocarcinoma (PDAC) are two aggressive malignancies, characterized by intrinsic radio-chemoresistance and neurotropism, a histological feature resulting in frequent perineural invasion (PNI), supported by neurotrophic factors secreted in the tumour microenvironment (TME), such as neurotrophin-3 (NT-3). Carbon-ion radiotherapy (CIRT) could represent an effective option in unresectable PMM and PDAC. Only a few data about the effects of CIRT on PNI in relation to NT-3 are available in the literature, despite the numerous pieces of evidence revealing the peculiar effects of this type of radiation on tumour cell migration. This in vitro study investigated for the first time the response of PMM and PDAC cells to NT-3 and evaluated the effects of conventional photon beam radiotherapy (XRT) and CIRT on cell viability, proliferation, and migration. Our results demonstrated the greater capacity of C-ions to generally decrease cell viability, proliferation, and migration, while the addition of NT-3 after both types of irradiation determined an increase in these features, maintaining a dose-dependent trend and acting more effectively as a chemoattractant than inductor in the case of migration.

Keywords: NT-3; carbon ions; hadrontherapy; migration; neurotropism; perineural invasion; radiobiology.


Conflict of interest statement

The authors declare no conflict of interest.

Figures

Figure 1
Figure 1
(a,b) Viability after the exposure of HMV-II (a) and PANC-1 (b) cells to photons in control conditions and with the addition of NT-3 to each cell line respectively. (c,d) Viability after the exposure of HMV-II (c) and PANC-1 (d) cells to C-ions in control conditions and with the addition of NT-3 to each cell line respectively. Bar graphs correspond to each condition represented by the line graphs, separately. * stands for p ≤ 0.05 and a statistically significant difference among 0–2 Gy, 0–4 Gy and 0–2 Gy with NT-3, 0–4 Gy with NT-3 for each time point.
Figure 1
Figure 1
(a,b) Viability after the exposure of HMV-II (a) and PANC-1 (b) cells to photons in control conditions and with the addition of NT-3 to each cell line respectively. (c,d) Viability after the exposure of HMV-II (c) and PANC-1 (d) cells to C-ions in control conditions and with the addition of NT-3 to each cell line respectively. Bar graphs correspond to each condition represented by the line graphs, separately. * stands for p ≤ 0.05 and a statistically significant difference among 0–2 Gy, 0–4 Gy and 0–2 Gy with NT-3, 0–4 Gy with NT-3 for each time point.
Figure 2
Figure 2
(a,b) Confluence after the exposure of HMV-II (a) and PANC-1 (b) cells to photons in control conditions and with the addition of NT-3 to each cell line respectively. (c,d) Confluence after the exposure of HMV-II (c) and PANC-1 (d) cells to C-ions in control condition and with the addition of NT-3 to each cell line respectively. Bar graphs correspond to each condition represented by the line graphs, separately. * stands for p ≤ 0.05 and statistically significant differences among 0–2 Gy, 0–4 Gy and 0–2 Gy with NT-3, 0–4 Gy with NT-3 for each time point. (AH). 4 Gy irradiated HMV-II (A,B,E,F) and PANC-1 (C,D,G,H) cells with and without the addition of NT-3, respectively, at time point t3 with photons in the left panel and C-ions in the right one. Images obtained with the OLYMPUS ProviTM CM20 incubation monitoring system.
Figure 2
Figure 2
(a,b) Confluence after the exposure of HMV-II (a) and PANC-1 (b) cells to photons in control conditions and with the addition of NT-3 to each cell line respectively. (c,d) Confluence after the exposure of HMV-II (c) and PANC-1 (d) cells to C-ions in control condition and with the addition of NT-3 to each cell line respectively. Bar graphs correspond to each condition represented by the line graphs, separately. * stands for p ≤ 0.05 and statistically significant differences among 0–2 Gy, 0–4 Gy and 0–2 Gy with NT-3, 0–4 Gy with NT-3 for each time point. (AH). 4 Gy irradiated HMV-II (A,B,E,F) and PANC-1 (C,D,G,H) cells with and without the addition of NT-3, respectively, at time point t3 with photons in the left panel and C-ions in the right one. Images obtained with the OLYMPUS ProviTM CM20 incubation monitoring system.
Figure 3
Figure 3
Scratch migration assay after the exposure of HMV-II (a) and PANC-1 (b) cells to photons without and with the addition of NT-3 to each cell line, respectively. *** stands for p ≤ 0.001 and extremely significant statistical differences.
Figure 4
Figure 4
Scratch migration assay after the exposure of HMV-II (a) and PANC-1 (b) cells to C-ions without and with the addition of NT-3 to each cell line, respectively. *** stands for p ≤ 0.001 and extremely significant statistical differences. (AD): 4 Gy photon-irradiated and C-ion irradiated HMV-II cells at time point t2 in the control condition (A,C) and with the addition of NT-3 (B,D). Images obtained with the OLYMPUS ProviTM CM20 incubation monitoring system.
Figure 5
Figure 5
Transwell migration assay after the exposure of HMV-II and PANC-1 cells to photons (a,b) and C-ions (c,d). NT-3 was tested both as an inductor [NT-3 (i)] and as a chemoattractant [NT-3 (c)]. ** stands for p ≤ 0.01 and highly significant statistical differences, and *** stands for p ≤ 0.001 and extremely significant statistical differences. (AC): 2 Gy C-ion irradiated PANC-1 cells in control condition (A), with NT-3 added as an inductor (B), or with NT-3 added as chemoattractant (C).

References

    1. Xing F., Saidou J., Watabe K. Cancer associated fibroblasts (CAFs) in tumor microenvironment. Front. Biosci. Landmark Ed. 2010;15:166–179. doi: 10.2741/3613. - DOI - PMC - PubMed
    1. Demir I.E., Friess H., Ceyhan G.O. Nerve-cancer interactions in the stromal biology of pancreatic cancer. Front. Physiol. 2012;3:97. doi: 10.3389/fphys.2012.00097. - DOI - PMC - PubMed
    1. Taș F., Erturk K. Neurotropism as a prognostic factor in cutaneous melanoma patients. Neoplasma. 2018;65:304–308. doi: 10.4149/neo_2018_170426N312. - DOI - PubMed
    1. Benda J.A., Platz C.E., Anderson B. Malignant Melanoma of the Vulva: A Clinical-Pathologic Review of 16 Cases. Int. J. Gynecol. Pathol. 1986;5:202–216. doi: 10.1097/00004347-198609000-00002. - DOI - PubMed
    1. Prasad M.L., Patel S.G., Busam K.J. Primary mucosal desmoplastic melanoma of the head and neck. Am. J. Clin. Pathol. 2002;118:648. doi: 10.1002/hed.10384. - DOI - PubMed