Apocynin Ameliorates Monosodium Glutamate Induced Testis Damage by Impaired Blood-Testis Barrier and Oxidative Stress Parameters
- PMID: 36983977
- PMCID: PMC10052003
- DOI: 10.3390/life13030822
Apocynin Ameliorates Monosodium Glutamate Induced Testis Damage by Impaired Blood-Testis Barrier and Oxidative Stress Parameters
Abstract
Background: the aim of this study was to investigate the effects of apocynin (APO) on hormone levels, the blood-testis barrier, and oxidative biomarkers in monosodium glutamate (MSG) induced testicular degeneration.
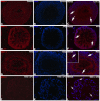
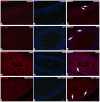
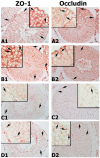
Methods: Sprague Dawley male rats (150-200 g; n = 32) were randomly distributed into four groups: control, APO, MSG, and MSG + APO. MSG and MSG + APO groups were administered MSG (120 mg/kg) for 28 days. Moreover, the APO and MSG + APO groups received APO (25 mg/kg) during the last five days of the experiment. All administrations were via oral gavage. Finally, biochemical analyses were performed based on the determination of testosterone, follicle-stimulating hormone (FSH), luteinizing hormone (LH), malondialdehyde (MDA), glutathione (GSH), and superoxide dismutase (SOD), as well as light and transmission electron microscopic examinations, assessment of sperm parameters, ZO-1, occludin, NOX-2, and TUNEL immunohistochemistry were evaluated.
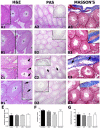
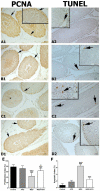
Results: MSG increased both the oxidative stress level and apoptosis, decreased cell proliferation, and caused degeneration in testis morphology including in the blood-testis barrier. Administration of apocynin reversed all the deteriorated morphological and biochemical parameters in the MSG + APO group.
Conclusions: apocynin is considered to prevent testicular degeneration by maintaining the integrity of the blood-testis barrier with balanced hormone and oxidant/antioxidant levels.
Keywords: NOX-2; apocynin; blood-testis barrier; monosodium glutamate; ultrastructure.
Conflict of interest statement
The authors declare no conflict of interest.
Figures





Similar articles
-
The Effects of Apocynin on Monosodium Glutamate Induced Liver Damage of Rats.Heliyon. 2023 Jun 15;9(7):e17327. doi: 10.1016/j.heliyon.2023.e17327. eCollection 2023 Jul. Heliyon. 2023. PMID: 37449146 Free PMC article.
-
Testicular Effect of Selenium Nanoparticles on Monosodium Glutamate Induced Alteration in Male Albino Rats.Pak J Biol Sci. 2023 Jan;26(7):347-359. doi: 10.3923/pjbs.2023.347.359. Pak J Biol Sci. 2023. PMID: 37902076
-
Apocynin reduces cytotoxic effects of monosodium glutamate in the brain: A spectroscopic, oxidative load, and machine learning study.Spectrochim Acta A Mol Biomol Spectrosc. 2022 Oct 15;279:121495. doi: 10.1016/j.saa.2022.121495. Epub 2022 Jun 9. Spectrochim Acta A Mol Biomol Spectrosc. 2022. PMID: 35700610
-
Multifaceted impacts of monosodium glutamate on testicular morphology: insights into pyroptosis and therapeutic potential of resveratrol.Folia Morphol (Warsz). 2025;84(1):151-166. doi: 10.5603/fm.99434. Epub 2024 Jun 6. Folia Morphol (Warsz). 2025. PMID: 38842078
-
Disruptive consequences of monosodium glutamate on male reproductive function: A review.Curr Res Toxicol. 2024 Jan 9;6:100148. doi: 10.1016/j.crtox.2024.100148. eCollection 2024. Curr Res Toxicol. 2024. PMID: 38287921 Free PMC article. Review.
Cited by
-
Rutin and Moringa oleifera leaf extract prevent monosodium glutamate-induced testicular toxicity in adult male albino rats.Front Vet Sci. 2025 May 9;12:1566471. doi: 10.3389/fvets.2025.1566471. eCollection 2025. Front Vet Sci. 2025. PMID: 40417365 Free PMC article.
-
Monosodium glutamate exacerbated the lipopolysaccharide-induced reproductive toxicity of male Wistar rats.BMC Pharmacol Toxicol. 2025 Aug 1;26(1):140. doi: 10.1186/s40360-025-00982-4. BMC Pharmacol Toxicol. 2025. PMID: 40751218 Free PMC article.
-
The Effects of Apocynin on Monosodium Glutamate Induced Liver Damage of Rats.Heliyon. 2023 Jun 15;9(7):e17327. doi: 10.1016/j.heliyon.2023.e17327. eCollection 2023 Jul. Heliyon. 2023. PMID: 37449146 Free PMC article.
-
The Protective Role of L-Cysteine in the Regulation of Blood-Testis Barrier Functions-A Brief Review.Genes (Basel). 2024 Sep 12;15(9):1201. doi: 10.3390/genes15091201. Genes (Basel). 2024. PMID: 39336792 Free PMC article. Review.
-
Is the use of anthracyclines implicated in myocardial injury? Investigating the cardio modulatory effects of naringenin and apocynin in doxorubicin-induced cardiotoxicity in rats.Toxicol Rep. 2025 Aug 21;15:102116. doi: 10.1016/j.toxrep.2025.102116. eCollection 2025 Dec. Toxicol Rep. 2025. PMID: 40893793 Free PMC article.
References
-
- Zanfirescu A., Ungurianu A., Tsatsakis A.M., Nițulescu G.M., Kouretas D., Veskoukis A., Tsoukalas D., Engin A.B., Aschner M., Margină D. A review of the alleged health hazards of monosodium glutamate. Compr. Rev. Food Sci. Food Saf. 2019;18:1111–1134. doi: 10.1111/1541-4337.12448. - DOI - PMC - PubMed
-
- Shin J.-W., Seol I.-C., Son C.-G. Interpretation of animal dose and human equivalent dose for drug development. J. Korean Med. 2010;31:1–7.
Grants and funding
LinkOut - more resources
Full Text Sources
Miscellaneous

