Review
. 2023 Mar 10;16(6):2248.
doi: 10.3390/ma16062248.

Recent Advances in Electro-Optic Response of Polymer-Stabilized Cholesteric Liquid Crystals

Affiliations
Review

Recent Advances in Electro-Optic Response of Polymer-Stabilized Cholesteric Liquid Crystals

Kyung Min Lee et al. Materials (Basel). .

Abstract

Cholesteric liquid crystals (CLC) are molecules that can self-assemble into helicoidal superstructures exhibiting circularly polarized reflection. The facile self-assembly and resulting optical properties makes CLCs a promising technology for an array of industrial applications, including reflective displays, tunable mirror-less lasers, optical storage, tunable color filters, and smart windows. The helicoidal structure of CLC can be stabilized via in situ photopolymerization of liquid crystal monomers in a CLC mixture, resulting in polymer-stabilized CLCs (PSCLCs). PSCLCs exhibit a dynamic optical response that can be induced by external stimuli, including electric fields, heat, and light. In this review, we discuss the electro-optic response and potential mechanism of PSCLCs reported over the past decade. Multiple electro-optic responses in PSCLCs with negative or positive dielectric anisotropy have been identified, including bandwidth broadening, red and blue tuning, and switching the reflection notch when an electric field is applied. The reconfigurable optical response of PSCLCs with positive dielectric anisotropy is also discussed. That is, red tuning (or broadening) by applying a DC field and switching by applying an AC field were both observed for the first time in a PSCLC sample. Finally, we discuss the potential mechanism for the dynamic response in PSCLCs.

Keywords: cholesteric liquid crystals; electro-optic response; ion-trapping mechanism; polymer stabilization.


Conflict of interest statement

The authors declare no conflict of interest.

Figures

Scheme 1
Scheme 1
Schematic description of selective reflection.
Figure 1
Figure 1
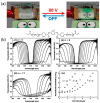
(a) Photographs illustrating the transmission and reflection of PSCLC with a thickness of 15 µm at 0 V (left) and 80 V (right). (b) Transmission spectra of PSCLC from (i) C3M (n = 3), (ii) C6M (n = 6), (iii) C11M (n = 11) before and during application of DC voltages, and (iv) a summary of the bandwidth change as a function of the DC field. Adapted from ref. [42].
Figure 2
Figure 2
(a) Transmission spectra of a PSCLC formulated with 1 wt.% Irgacure 369 and a chiral liquid crystal monomer (SL04151, inset) and cured at 80–100 mW cm−2 for 3 min with increasing voltage from 0 V to 160 V. (b) Variation in reflection wavelength of a PSCLC with 5 wt.% polymer concentration in an experiment in which DC voltages of 50 V, 60 V, 69 V, and 87 V. The voltages were directly applied to the cells and continuously applied for 30 min. POM images in reflection images increasing DC voltages from 0 V to 75 V. The red triangle indicates the notch position of PSCLC and the blue dashed line represents the applied DC field. Cells with a thickness of 15 µm were used. Adapted from ref. [46].
Figure 3
Figure 3
(a) Blue shifting of the selective reflection of a 15 µm thick PSCLC at (i) 0 V, (ii) 15 V, (iii) 20 V, (iv) 25 V, and (v) 35 V. (b) The wavelength of the selective reflection is plotted as a function of applied DC voltage. Photographs of the reflection at (i) 0 V, (ii) 19 V, (iii) 23 V, and (iv) 36 V are provided as insets. The PSCLC shown was cured at 700 mW cm−2 for 30 min. Adapted from ref. [48].
Figure 4
Figure 4
(a) Red shifting tuning of the selective reflection of a 15-µm thick PSCLC by the application of DC voltage of 0, 30, 50, and 60 V DC. (b) Reflection switching of the PSCLC band gap is induced by the application of 150 V AC. (c) Reconfiguration of the selective reflection (tuning and switching) is illustrated in sequential transmission spectra (i) 0, (ii) 40, (iii) 60, and (iv) 70 V DC. Reflection switching of (i–iv) was included with 150 V AC at 1 kHz. The one-sided arrows represent the shift of the reflective band and the vertical double-sided arrows represent the transition between reflective and transparent states. The sample was formulated by mixing 0.4 wt.% I-369, 6 wt.% SL04151, 3 wt.% R1011, and 90.6 wt.% E7 prepared by exposure to a 100 mW cm−2 365 nm wavelength UV light for 3 min. Control of color in PSCLC optical elements separated into four addressable pixels: (d) 0 V (IR), (e) 3 V of DC field was applied to the upper right pixel (red), (f) 6 V of DC field was concurrently applied to the upper left pixel (green), (g) 9 V of DC field was concurrently applied to the bottom left pixel (blue), and (h) 250 V of AC field at 1 kHz was applied to the bottom right pixel (homeotropic). Adapted from ref. [51].
Figure 5
Figure 5
Bistable switching behavior of PSCLCs with (a) 30 μm gap thickness: normal mode with (i) 0 V, (ii) 210 V DC, (iii) OFF (0 V), (iv) −45 V DC, and (v) OFF (0 V), (b) (i) 0 V, (ii) 100 V AC, (iii) OFF (0 V), (iv) 45 V DC, and (v) 0 V, and (c) photographs of samples with 15 μm thickness at (i) 50 V AC, (ii) 0 V, (iii) 100 V DC, and (iv) 0 V. Adapted from ref. [49].
Figure 6
Figure 6
Response time of PSCLCs with 30 μm thickness. An optical setup employing a photodetector connected to an oscilloscope measured the relative intensity of light transmission as the PSCLC was subjected to (a) at (i) 0 V, (ii) 210 V DC, (iii) 0 V, (iv) −45 V DC, (v) 0 V, (vi) 100 V AC with 1 kHz, and (vii) 0 V over various time intervals. (b) The transmission of unpolarized light at 500 nm to measure the response time is illustrated. Adapted from ref. [49].
Figure 7
Figure 7
Transmission spectra of a negative ∆ε PSCLC with 5 ± 0.2 µm thickness showing a (a) reflective to transparent or (b,c) transparent to reflective switching response by application of a DC voltage. (d) Spectra for the relaxation to the off state from 23 V DC. Adapted from ref. [50].
Figure 8
Figure 8
(a) Transmission spectra of a negative ∆ε PSCLC with 3 ± 0.2 µm thickness for DC voltages up to 40 V DC. (b) Peak position during the switching of the same PSCLC using various DC voltages. The arrows indicate the times at which the DC voltage was changed to the value indicated. (c) Photographs of the reflection color of the PSCLC as a function of the applied DC voltage. Adapted from ref. [50].
Figure 9
Figure 9
Time evolution of the intensity of the light transmitted by PSCLCs with (a, b) 3 ± 0.2 µm and (c, d) 5 ± 0.2 µm thickness when a DC voltage is switched on and off. For the PSCLC with 3 µm, a 40 V DC voltage is (a) directly applied at t ~ 450 ms and (b) removed at t ~ 1850 ms. Rise and fall times are ~30 ms and ~150 ms. For the PSCLC with 5-µm thickness, 45 V DC are (c) applied at t ~ 450 ms and (d) removed at t ~ 2300 ms. Rise and fall times are ~50 ms and ~200 ms. Adapted from ref. [50].
Figure 10
Figure 10
Transmission spectra of negative ∆ε PSCLCs with various cell thicknesses and DC voltages in the ranges shown above each graph: (a) 14.1 ± 0.3 µm thickness, 0 V to 90 V DC, (b) 10.3 ± 0.3 µm, 0 V to 60 V DC, (c) 7.6 ± 0.2 µm, 0 V to 55 V DC, (d) 4.9 ± 0.2 µm, 0 V to 30 V DC, (e) 3.6 ± 0.2 µm, 0 V to 30 V DC and (f) 2.5 ± 0.2 µm, 0 V to 25 V DC. Composition: 0.4 wt.% I-369, 6 wt.% SL04151, 5 wt.% R1011, 4 wt.% R811, and 84.6 wt.% MCL 2079. Adapted from ref. [50].
Figure 11
Figure 11
Transmission spectra of PSCLCs formulated with 3.5 wt.% R1011, 90.5 wt.% MLC-2079, and (a) 6 wt.% as-received C3M with an initial ion density of 7.6 × 10¹³ ions cm−3, (b) 6 wt.% purified C3M with an initial ion density of 1.6 × 10¹³ ions cm−3, and (c) 6 wt.% residual C3M with an initial ion density of 1.0 × 10¹⁴ ions cm−3. Adapted from ref. [79]. The arrows in (a) and (b) represent the bandwidth broadening and the arrow in (c) indicates the shift of the reflection band in CLC.
Figure 12
Figure 12
(a) Reflection images of PSCLC prepared with 1 wt.% Irgacure 369 at (i) 0 V, (ii) during application of 20 V DC and (iii) UV exposure during application of 20 V DC. (b) Transmission spectra at (i) 0 V, (ii) during application of 40 V DC, and (iii) during application of 40 V DC in the presence of 50 mW cm−2 of UV light. Adapted from ref. [78].
Figure 13
Figure 13
Transmission spectra (unpolarized white light probe) collected from sample CLC with a thickness of 30 µm as a function of incidence angle. The initial notch position of the sample is 1080 nm. Adapted from ref. [91].
Figure 14
Figure 14
Variation of the optical properties of PSCLC with DC field: (a,b) transmission spectra at θ = 0° for unpolarized light and (c,d) transmission spectra at θ = 60° for unpolarized light. Adapted from ref. [91]. A 30-μm thick PSCLC was used for bandwidth broadening of the reflection band (a,c), and a PSCLC with a thickness of 15 μm was used for red tuning response (b,d).
Figure 15
Figure 15
Schematic of the polymer network in a deformable PSCLC with Δε < 0: (a) with no applied field, (b) with a DC field applied between the top and bottom substrates. The blue lines represent the polymer network, the grey horizontal bars are the low-molecular weight CLC molecules, (+) and (−) are the free cationic and anionic impurities and ⊕ are trapped cationic impurities. Adapted from ref. [50].
Figure 16
Figure 16
Polarizing confocal microphotographs of the polymer-stabilized cholesteric liquid crystal in the absence and presence of a DC electrical field. (a) 0 V µm−1 and (b) 1.1 V µm−1. The dashed lines are a guide to the eye. Adapted from ref. [41].
Figure 17
Figure 17
(a) Map of the fluorescence intensity by three-photon excitation along a 2D cross-section of a PSCLC without or with an applied DC field (reflection notch at 2.45 µm at zero field and ~15 µm cell thickness): (i) 0 V µm−1, (ii) 0.5 V µm−1, (iii) 1.0 V µm−1, and (iv) 2.5 V µm−1. The vertical direction is along the cell normal and the helical axis, the horizontal direction is parallel to the cell substrates. The white arrow labeled ‘‘P’’ in (i) is the polarization direction of the excitation light. The polarity of the DC voltage is indicated by the “(+)”and “(−)“ signs. (b) Magnitude of the half pitch through the cell thickness as obtained from the fluorescence images in (a) for the following values of the electric field: (●) 0 V µm−1, (▲) 0.5 V µm−1, (■) 1.0 V µm−1, (▼) 2.0 V µm−1, and (♦) 2.5 V µm−1. Composition of the CLC mixture: 0.2 wt.% I-369, 4 wt.% SL04151, 2 wt.% RM23, 2 wt.% CB15, and 91.8 wt.% MLC 2079. The PSCLC was formed by curing the mixture with exposure to 365 nm UV light at 100 mW cm−2 for 5 min. Adapted from ref. [46].

References

    1. Geelhaar T., Griesar K., Reckmann B. 125 Years of Liquid Crystals—A Scientific Revolution in the Home. Angew. Chem. Int. Ed. 2013;52:8798–8809. doi: 10.1002/anie.201301457. - DOI - PubMed
    1. Kitzerow H.-S., Bahr C. Chirality in Liquid Crystals. Springer; New York, NY, USA: 2001.
    1. Wu S.T., Yang D.-K. Reflective Liquid Crystal Displays. Wiley; Chichester, UK: 2001.
    1. Blinov L.M. Electro-Optical and Magneto-Optical Properties of Liquid Crystals. Wiley; New York, BY, USA: 1983.
    1. Yang D.-K., Chien C.-C., Donna J.W. Cholesteric liquid crystal/ polymer dispersion for hazy-free light shutters. Appl. Phys. Lett. 1992;60:3102–3104. doi: 10.1063/1.106765. - DOI

LinkOut - more resources