Review
. 2023 Mar 13;59(3):561.
doi: 10.3390/medicina59030561.

Overview and New Insights into the Metabolic Syndrome: Risk Factors and Emerging Variables in the Development of Type 2 Diabetes and Cerebrocardiovascular Disease

Affiliations
Review

Overview and New Insights into the Metabolic Syndrome: Risk Factors and Emerging Variables in the Development of Type 2 Diabetes and Cerebrocardiovascular Disease

Melvin R Hayden. Medicina (Kaunas). .

Abstract

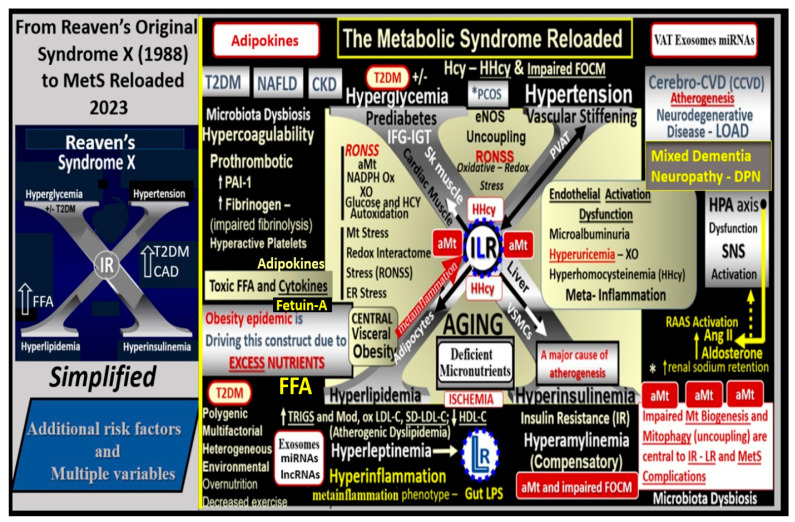
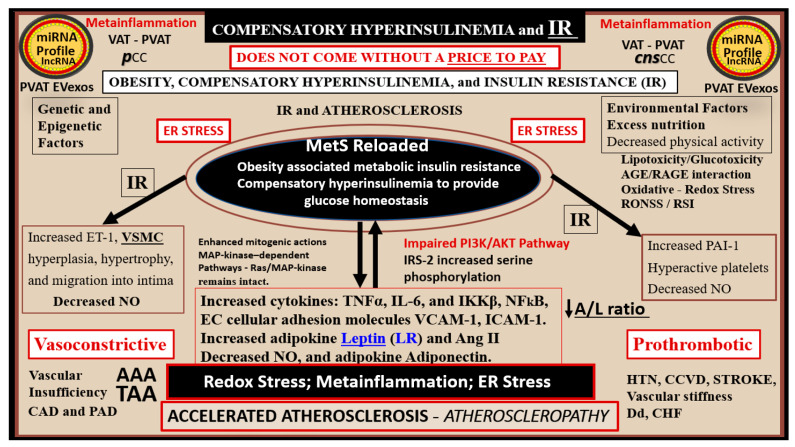
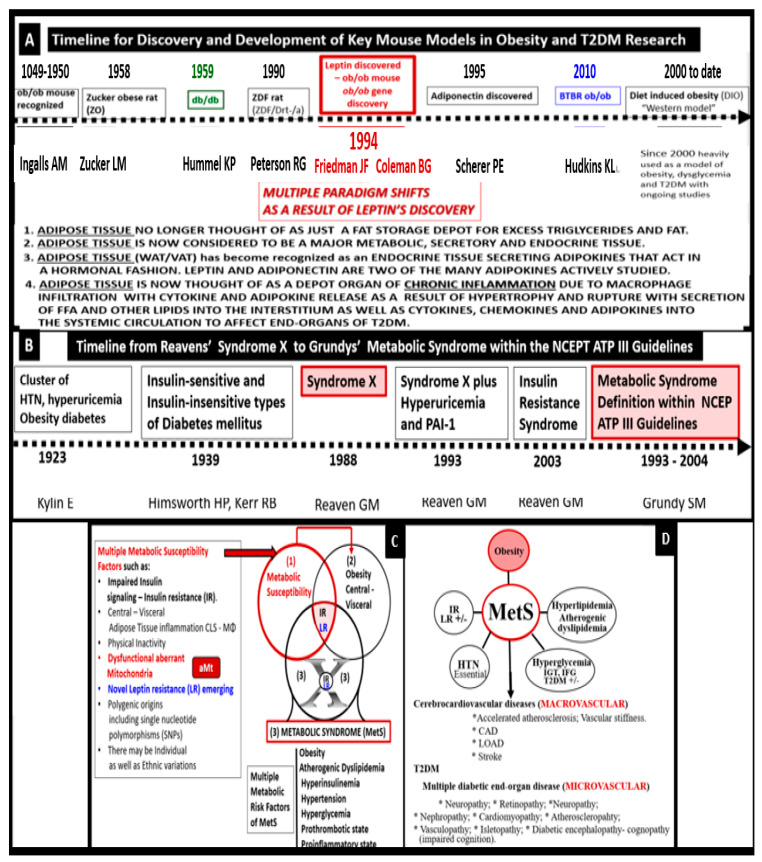
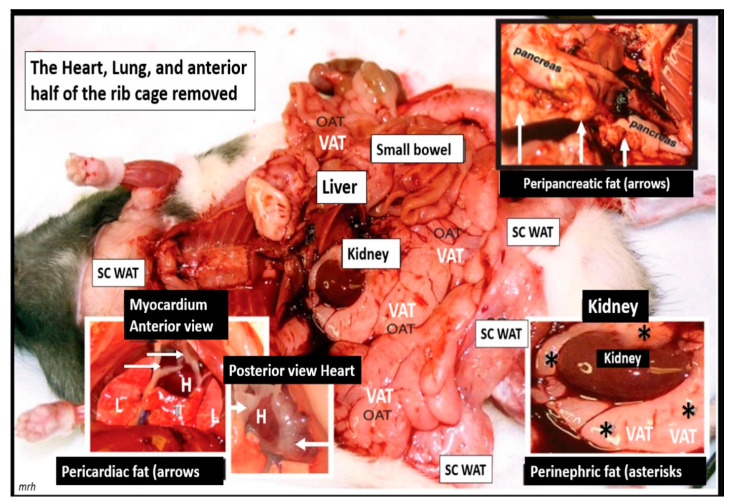
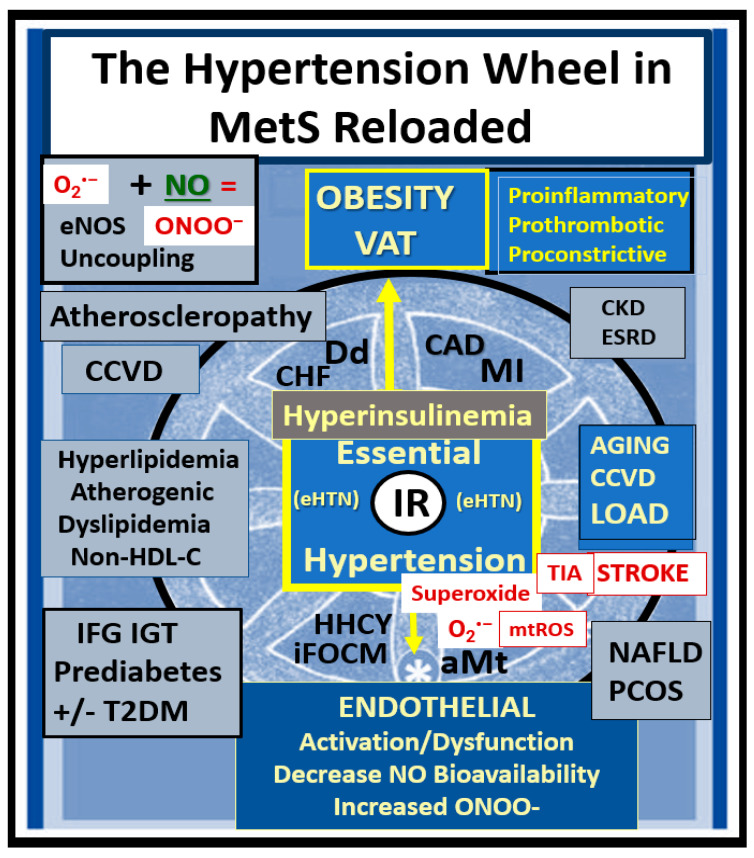
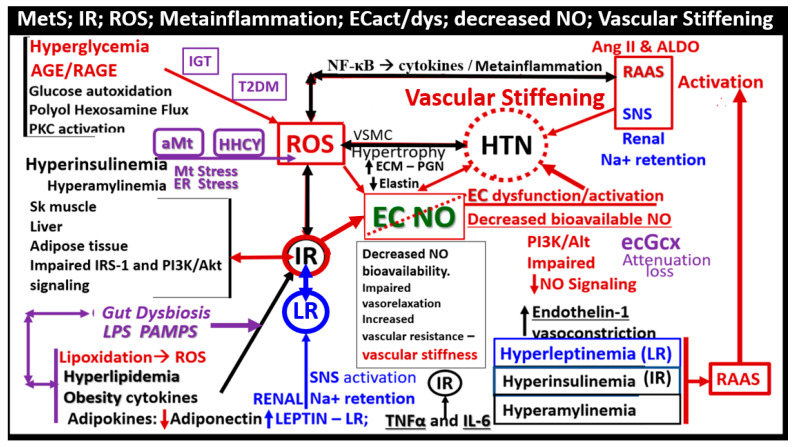
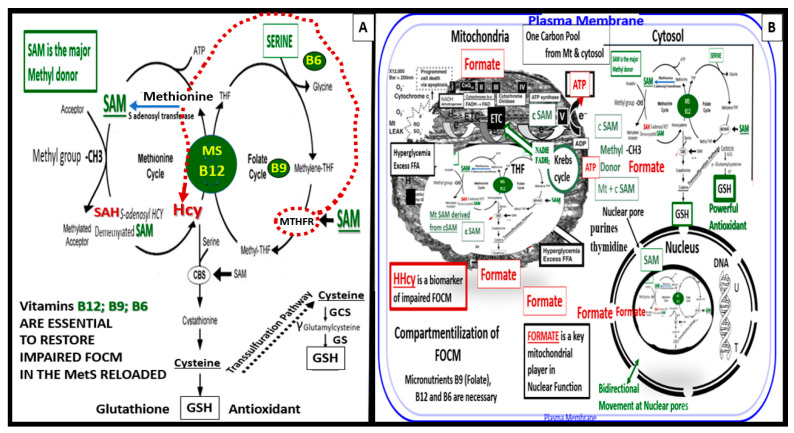
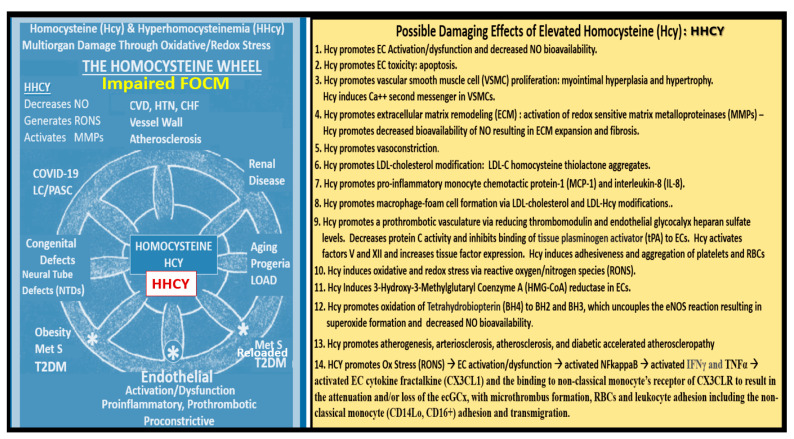
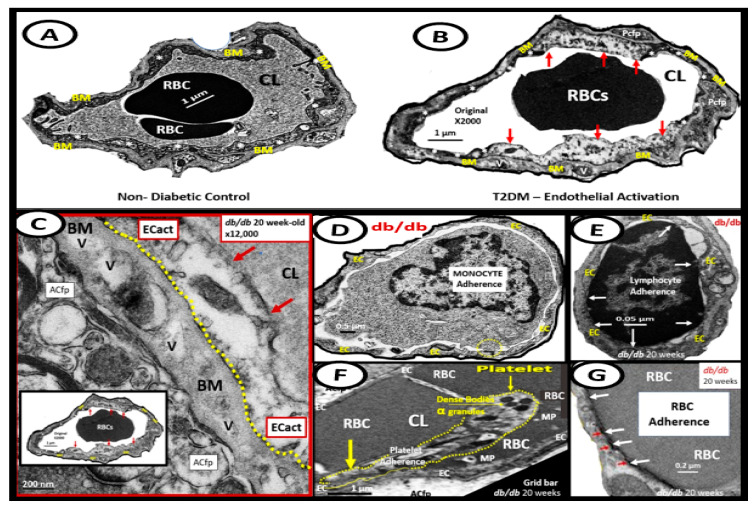
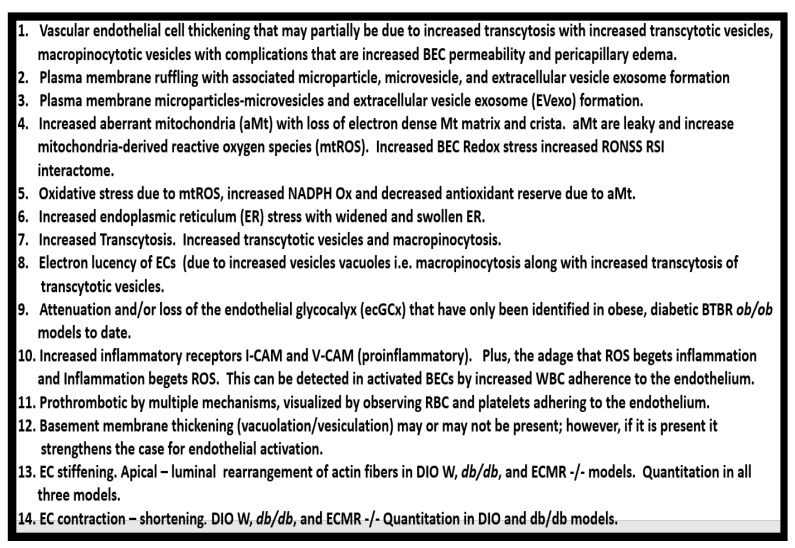
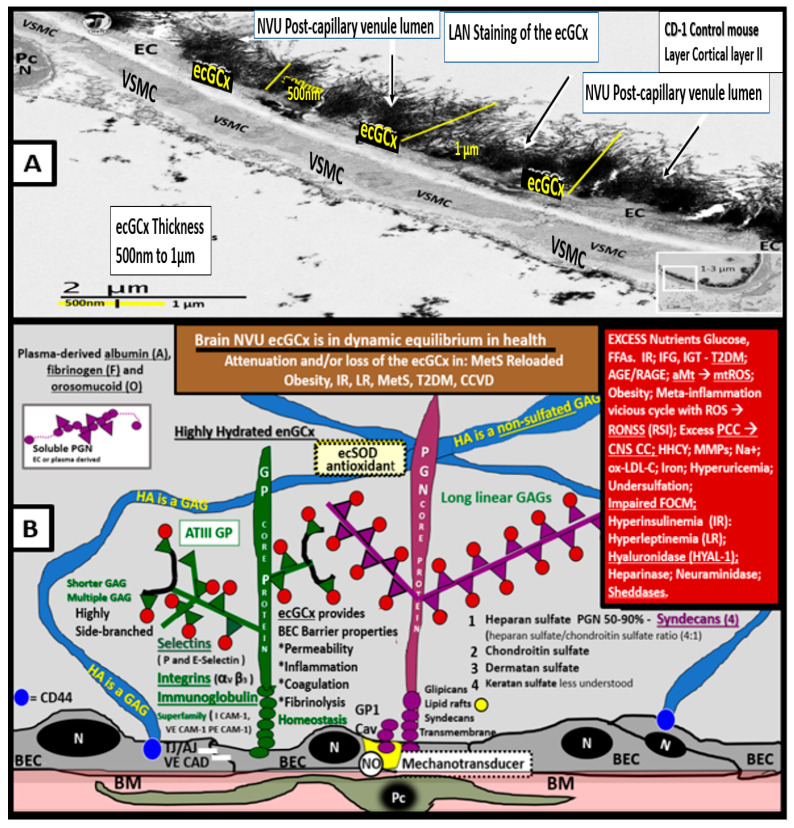
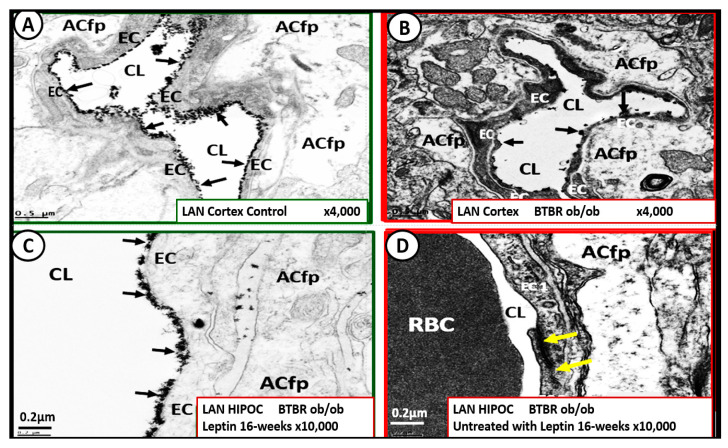
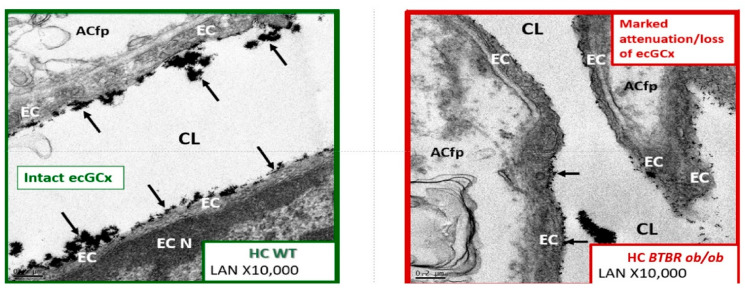
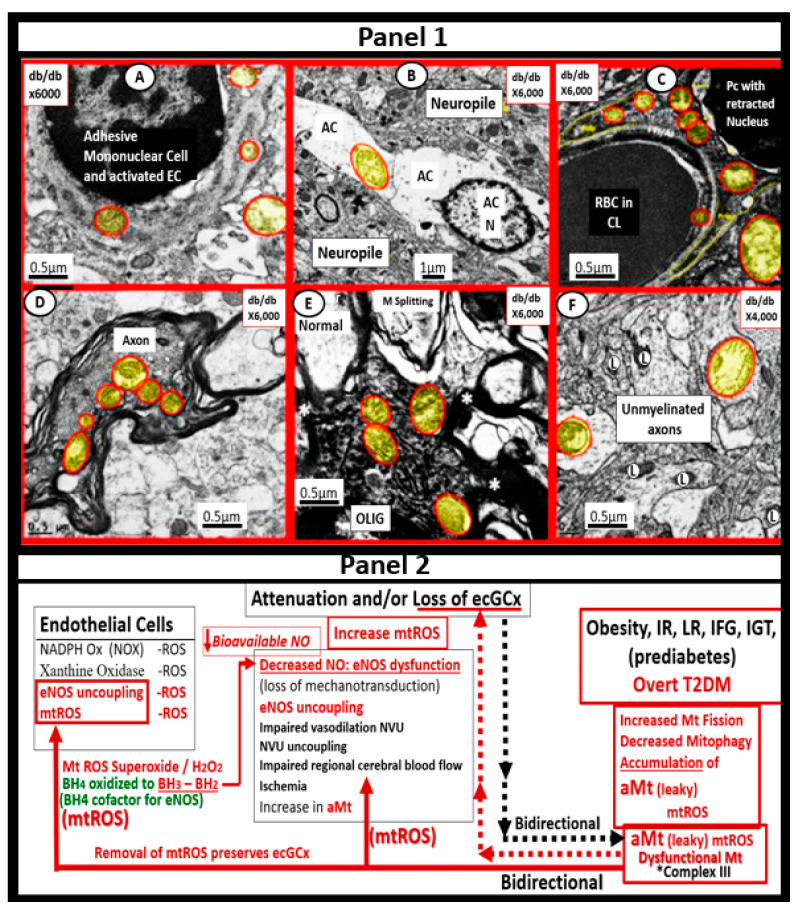
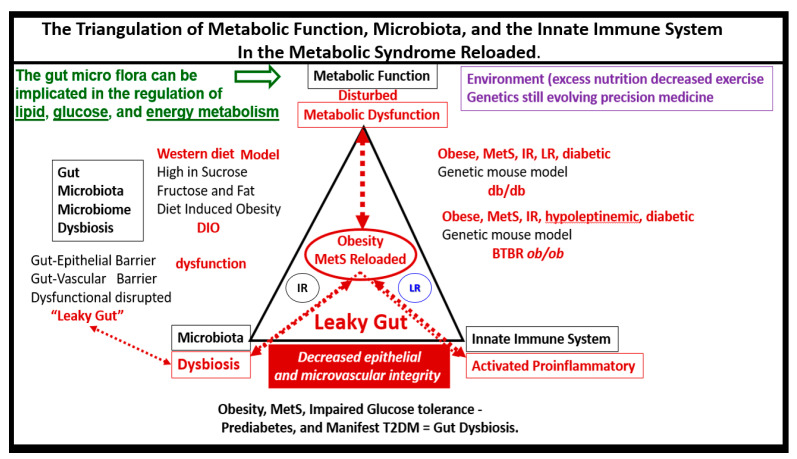
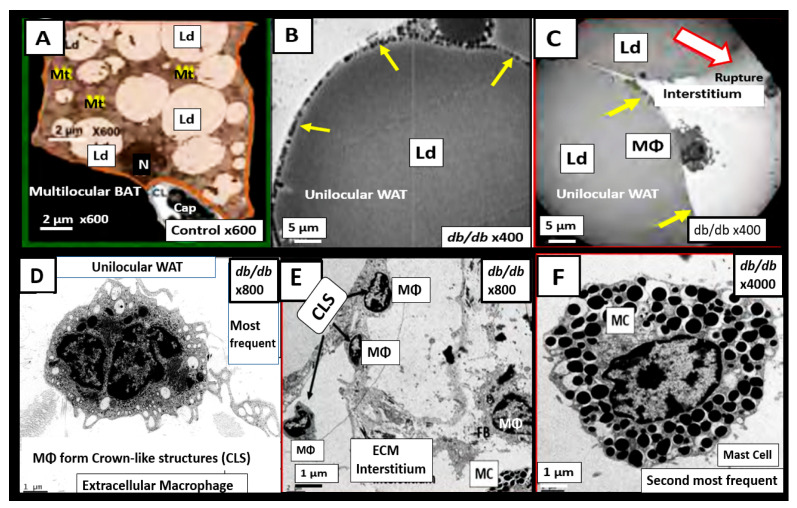
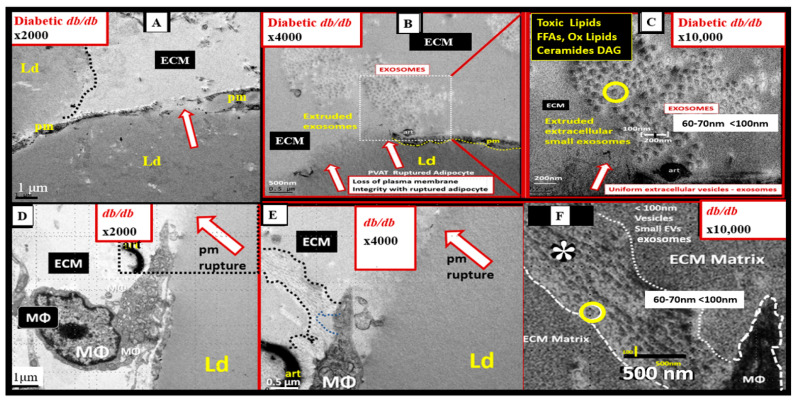
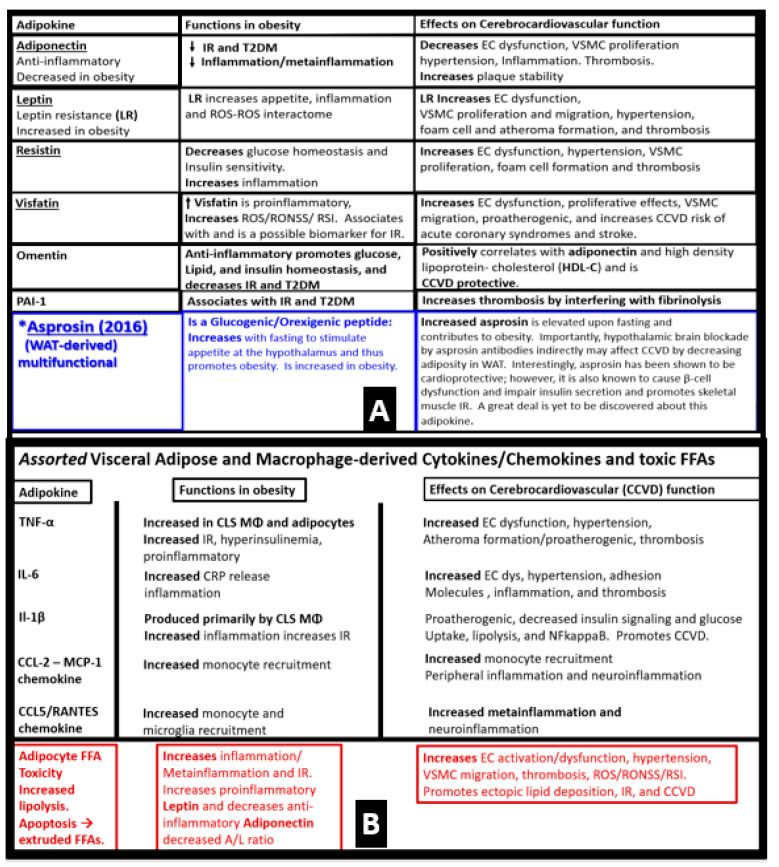
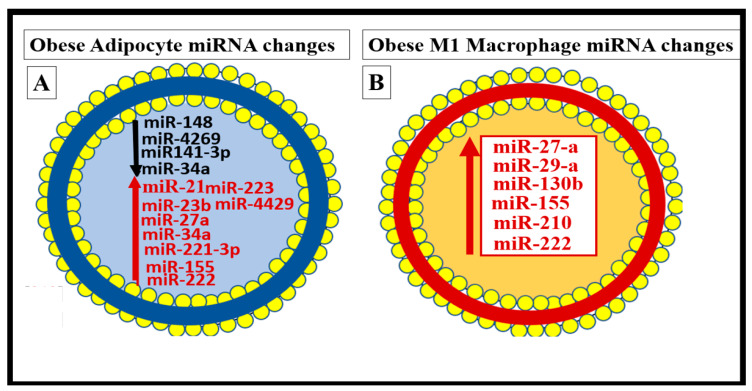
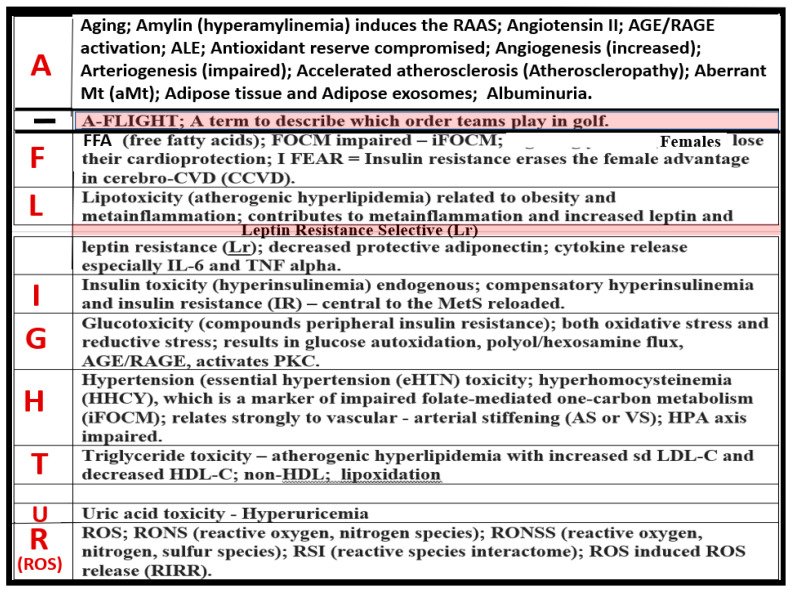
Metabolic syndrome (MetS) is considered a metabolic disorder that has been steadily increasing globally and seems to parallel the increasing prevalence of obesity. It consists of a cluster of risk factors which traditionally includes obesity and hyperlipidemia, hyperinsulinemia, hypertension, and hyperglycemia. These four core risk factors are associated with insulin resistance (IR) and, importantly, the MetS is known to increase the risk for developing cerebrocardiovascular disease and type 2 diabetes mellitus. The MetS had its early origins in IR and syndrome X. It has undergone numerous name changes, with additional risk factors and variables being added over the years; however, it has remained as the MetS worldwide for the past three decades. This overview continues to add novel insights to the MetS and suggests that leptin resistance with hyperleptinemia, aberrant mitochondrial stress and reactive oxygen species (ROS), impaired folate-mediated one-carbon metabolism with hyperhomocysteinemia, vascular stiffening, microalbuminuria, and visceral adipose tissues extracellular vesicle exosomes be added to the list of associated variables. Notably, the role of a dysfunctional and activated endothelium and deficient nitric oxide bioavailability along with a dysfunctional and attenuated endothelial glycocalyx, vascular inflammation, systemic metainflammation, and the important role of ROS and reactive species interactome are discussed. With new insights and knowledge regarding the MetS comes the possibility of new findings through further research.

Keywords: endothelial dysfunction; exosomes; hyperglycemia; hyperinsulinemia; hyperlipidemia; hypertension; insulin resistance; leptin resistance; metainflammation; miRNAs.


Conflict of interest statement

The author declares no conflict of interest.

Figures

Figure 1
Figure 1
From Reaven’s simplified syndrome X to the complicated metabolic syndrome (MetS) reloaded. This image illustrates the simple Reaven’s Syndrome X (far left) to the complex MetS reloaded and its multiple risk factors. According to Reaven, the letter “X” was originally chosen because at the time coronary artery disease (CAD) and/or cerebrocardiovascular disease (CCVD) was a relatively unknown risk of human insulin resistance. Syndrome X was later termed the MetS by the National Cholesterol Education Program Adult Treatment Panel III and Grundy et al., 2002 and 2004, respectively. Hyperlipidemia (lower left arm), hyperinsulinemia, and hyperamylinemia (lower right arm), hypertension (essential) (upper right arm), and hyperglycemia with or without manifest T2DM (upper left arm) in the MetS reloaded represent the four arms to the central capital letter X. Importantly, visceral or central obesity is thought to be a major driver of this syndrome and is related to the emergent science of visceral adipose tissue (VAT) with adipocyte-derived adipokines and macrophage-derived cytokines/chemokines. Additionally, it is important to note the novel adipocyte and macrophage-derived exosomes with their novel signaling microRNAs (miRNAs) and long-non-coding RNAs (lncRNAs), which are capable of both paracrine and endocrine (inter-organ and long-distant) signaling in addition to the signaling via peripheral cytokine/chemokine adipokine network due to excessive meta-inflammation within VAT depots. Note that insulin resistance (IR) and leptin resistance (LR or Lr) (ILR) are placed centrally within the letter X. Importantly, note the red bold arrow connecting central visceral obesity to the central ILR within the letter X that is related to increased meta-inflammation. Also, note how the aberrant mitochondria (aMt) (a constant finding in obese and diabetic models) and hyperhomocyteinemia (HHcy) are flanking the central insulin and leptin resistance (ILR) that reflects impaired folate-mediated one-carbon metabolism (FOCM). Additionally, note the important role of microbiota dysbiosis and its emerging role associated with obesity and the MetS reloaded. Note the relationship between the HPA axis and the RAAS with increased sodium retention (*).Ang II = angiotensin II; CAD = coronary artery disease; CKD = chronic kidney disease; CCVD = cerebrocardiovascular disease; DPN = diabetic peripheral neuropathy; eNOS = endothelial nitric oxide synthase; ER = endoplasmic reticulum; FFA = free fatty acids; Hcy = homocysteine; ILR = insulin/leptin resistance; LOAD = late-onset Alzheimer’s disease; lncRNAs = long non-cording RNAs; HPA = hypothalamic–pituitary–adrenal axis; LPS = lipopolysaccharide; LR = leptin resistance—selective Lr; miRNAs = micro ribonucleic acids; Mt = mitochondria; NADPH Ox = nicotinamide adenine dinucleotide phosphate oxidase; NAFLD = non-alcoholic fatty liver disease; NO = nitric oxide; Non-HDL-C = non-high-density lipoprotein-cholesterol; O2 = oxygen; oxLDL-C = oxidized low density lipoprotein-cholesterol; PAI-1 = plasminogen activator inhibitor -1; PCOS = polycystic ovary syndrome; RAAS = renin-angiotensin-aldosterone-system; RNA = ribonucleic acid; RONSS = reactive oxygen, nitrogen, sulfur species; RSI = reactive species interactome; sdLDL-C = small dense low-density lipoprotein-cholesterol; SNS = sympathetic nervous system; Trigs = triglycerides; XO = xanthine oxidase.
Figure 2
Figure 2
Insulin resistance (IR) and compensatory hyperinsulinemia do not come without a price to pay. IR plays a central role in the MetS and results in an impaired PI3K/AKT pathway due to impaired IRS-2 function (IRS-2 increased serine phosphorylation) and decreased insulin-stimulated NO synthesis and impaired vasodilation. However, the elevated insulin can still signal through the mitogenic MAPkinase-dependent pathway and contribute to arterial vessel wall remodeling and accelerated atherosclerosis (atheroscleropathy) due to pro-atherosclerotic, pro-thrombotic, and vasoconstrictive effects). The increased redox stress and inflammatory vicious cycle that drive IR are promoted by an associated increased peripheral and central nervous cytokines and chemokines (pCC and cnsCC respectively) and the IR promoting effects from adipose-derived miRNAs via increased extracellular vesicle exosomes (EVexos) and their microRNA profiles along with the ongoing metainflammation. AAA = abdominal aortic aneurysm; Ang II = angiotensin II; CAD = coronary artery disease; CHF = congestive heart failure; ET-1 = endothelin-1; ER = endoplasmic reticulum; HTN = hypertension; ICAM-1= intercellular adhesion molecule 1; IKKβ = inhibitor of nuclear factor kappa-B kinase subunit beta; IL-6 = interleukin-6; lncRNA = long non-coding ribonucleic acid; LR = leptin resistance; miRNA = micro ribonucleic acid; NFkB = nuclear factor kappa-light-chain-enhancer of activated B cells; NO = nitric oxide; PAD = peripheral arterial disease; PAI-1 = plasminogen activator inhibitor-1; ROS = reactive oxygen species; RNA = ribonucleic acid; RONSS = reactive oxygen, nitrogen, sulfur species; RSI = reactive species interactome; TAA = thoracic aortic aneurysm; TNFα = tumor necrosis factor alpha; VCAM-1 = vascular cell adhesion molecule-1; VSMC = vascular smooth muscle cell(s).
Figure 3
Figure 3
Panel A demonstrates the timeline for the development of key obesity and T2DM models from 1948 to date that have resulted in multiple paradigm shifts in regard to the metabolic syndrome (MetS). Panel B demonstrates the timeline of Reaven’s syndrome X to the NCEP ATP III guidelines for the MetS and Grundy’s emphasis on the Met S. These two combined timelines allow one to compare the importance of obesity, insulin and leptin resistance to the timeline for the development of the MetS. Panel C illustrates that the MetS is associated with multiple variables and the importance of an individual’s metabolic susceptibility factors (boxed-in factors) to better understand why only some obese individuals develop MetS. Panel D depicts that the MetS is associated with multiple variables and an increased risk for cerebrocardiovascular disease (CCVD) via macrovascular disease, while diabetic end-organ disease is associated with type 2 diabetes mellitus (T2DM) and microvascular disease. Panel A is adapted and modified with permission by CC 4.0 [30]. FFA = free fatty acids; VAT = visceral adipose tissue; WAT = white adipose tissue.
Figure 4
Figure 4
Necropsy of a male Zucker fa/fa or ob/ob at nine-weeks of age. Gross findings at necropsy of obesity in the nine-week-old adolescent male Zucker obese ob/ob rat model. This image depicts the massive accumulation of omental adipose tissue (OAT) or visceral adipose tissue (VAT) in the Zucker fa/fa or ob/ob model. Also, note there is an accumulation of excessive subcutaneous (SC) adipose tissue—white adipose tissue (WAT) depot. The accumulation of peripancreatic VAT fat (white arrows) (upper-right), pericardiac VAT fat (white arrows) (lower-left), and extremely excessive perinephric VAT fat (asterisks) (lower-right) are depicted in the inserts. This image is adapted with permission from open access [40]. H = heart; L = collapsed lung; mrh = necroscopy-photographer initials melvin ray hayden; OAT = omental adipose tissue; T= thymus.
Figure 5
Figure 5
Ultrastructural remodeling of pancreatic islets and islet Beta-cells (β-cells) in obese and type 2 diabetes mellitus (T2DM) rodent models. Panel 1 depicts the paucity of insulin secretory granules (ISGs), endoplasmic reticulum (ER) stress (arrow), and an increase in aberrant mitochondria (aMt) in the obese, diabetic db/db mouse (B) as compared to controls (A) Panel 2 depicts the loss of ISGs and the excessive deposition of islet amyloid in the human islet amyloid polypeptide (HIP) (* in Panel 2E and # in Panel 2F) rat model (E) that results in β-cell apoptosis (F) as compared to controls (AD) Note the nucleus chromatin condensation (arrows) in the apoptotic β-cell in panel F. Scale bars vary and are present. Images are reproduced and modified with permission by CC 4.0 [52].
Figure 6
Figure 6
Aberrant mitochondria (aMt) in the MetS Reloaded. This image depicts an aberrant mitochondrion (aMt) from an, insulin-resistant, diabetic db/db female mouse model at 20 weeks of age. Aberrant mitochondria are a common phenotype found in multiple different cells in models of obesity, insulin resistance, metabolic syndrome, and type 2 diabetes mellitus as compared to control models such as the C47BL6J model demonstrated in the upper left-hand side of this image (Figure 1). Thinning with interruption and permeabilization of the outer aMt membrane is a common finding in obese, insulin-resistant, diabetic db/db models. This aMt depicts (1) the interruption of the inner and outer membranes with partial permeabilization (open red arrow and red dashed line); (2) the thinning of the inner and outer membranes (open red arrow); and (3) the complete loss of the inner and outer membranes with permeabilization of the outer membrane (open red arrow, dashed red lines. Increased permeabilization of the aMt outer membrane allows for the leakage of multiple mitochondrial-derived toxicities including mitochondrial-derived reactive oxygen species (Mt-ROS), cytochrome c, and proinflammatory MtDNA. This image is reproduced and adapted with permission by CC 4.0 [11]. Original magnification x2000; scale bar = 200 nm.
Figure 7
Figure 7
Type 2 diabetes mellitus (T2DM) is a multifactorial and polygenic disease in addition to having dysfunctional aberrant mitochondria (aMt) capable of bidirectional signaling. Panel A depicts that aberrant mitochondrial (aMt) phenotypes are a central and critical defect that leads to T2DM via multifactorial polygenic and environmental factors. Panel B demonstrates that aMt dysfunction with increased mitochondrial reactive oxygen species (mtROS) and T2DM are capable of interacting via bidirectional mechanisms. ATP = adenosine triphosphate; AGE= advanced glycation end product; mt-DNA = mitochondrial deoxyribonucleic acid; MOMP = mitochondria outer membrane permeabilization; n-DNA = nuclear DNA; RAGE = receptor for AGEs; ROS = reactive oxygen species; RONSS = reactive oxygen, nitrogen, sulfur species.
Figure 8
Figure 8
Syndrome L—hyperleptinemia and selective leptin resistance (LR) are emerging and novel risk factors in obesity, insulin resistance (IR), metabolic syndrome (MetS), and type 2 diabetes mellitus (T2DM). This illustration compares the leptin receptor deficiency db/db with both the leptin resistance (LR) panel (a) to the leptin deficiency BTBR ob/ob mouse models with IR that develops obesity and the diabetes panel (b) at 20 weeks (W) of age. LR is known to lead to glucose intolerance at least in the Zucker obese fa/fa rat models, db/db mouse models, and occurs primarily due to hepatic glucose overproduction that may occur even prior to developing obesity. LR is an emerging and novel finding in the MetS reloaded, as previously depicted in Figure 1. Importantly, its relationship to the MetS reloaded has increased over recent years. Leptin resistance is associated with decreased adiponectin and is proinflammatory, proatherosclerotic, and associates with decreased insulin sensitivity. AKT = protein kinase B; MAP Kinase = mitogen-activated protein kinase; PI3 Kinase = phosphoinositide 3-kinase.
Figure 9
Figure 9
The essential hypertension (HTN) wheel in the metabolic syndrome (MetS) reloaded. This wheel depicts that insulin resistance (IR) is a central core feature of the wheel as it is in the MetS reloaded. IR is a central mediator for the development of HTN and IFG-IGT–T2DM, along with multiple metabolic and clinical boxed-in conditions that surround the outer portions of this hypertension wheel. Obesity is placed at the top of the wheel because it is believed to be the driving force behind the subsequent clinical end-organ remodeling and disease and the development of HTN. Endothelial activation and dysfunction (bottom of the wheel) result in increased peroxynitrite (ONOO) and decreased nitric oxide (NO) bioavailability. Peroxynitrite is generated by the reaction between superoxide and NO. One can note the multiple diseases that are associated with HTN, and the wheel depicts the interconnectedness between HTN and the multiple disease states, including vascular stiffening. Thus, IR, HTN, and T2DM are not to be underestimated. Atheroscleropathy is a term that may be used when discussing accelerated atherosclerosis and macrovascular disease in those individuals with T2DM and the MetS reloaded. The wheel was chosen as a background icon because it goes round and round, and over time it just keeps on turning and results in vascular stiffening and end-organ damage in the heart-brain-kidney axis that has high capillary flow with low resistance and increased vulnerability to the increased pulse wave velocity associated with vascular stiffening, HTN, and microvascular disease. CAD = coronary artery disease; CCVD = cerebro-cardiovascular disease; CHF = congestive heart failure; CKD = chronic kidney disease; Dd = diastolic dysfunction; eNOS = endothelial nitric oxide synthase; ESRD = end-stage renal disease; IFG = impaired fasting glucose; IGT = impaired glucose tolerance; LOAD = late-onset Alzheimer’s disease; MI = myocardial infarction; mtROS = mitochondrial reactive oxygen species; O2•– = superoxide.
Figure 10
Figure 10
Pathophysiology of essential hypertension (HTN) in the MetS reloaded. This figure demonstrates the complex interconnected pathways between insulin resistance (IR encircled in red color) and HTN. IR is the cornerstone of the MetS reloaded, and this schematic depicts how it is related to the development of HTN (dashed red circle). Note the important role of endothelial derived nitric oxide (NO) (green), which is essential for proper vascular relaxation and homeostasis, and how it is negated (red-dashed diagonal line) in the development of HTN. Importantly, decreased bioavailable NO results in decreased vasorelaxation and increased vascular resistance with a resulting increase in vascular stiffening and elevated blood pressure (BP). Next, note the devastating role that reactive oxygen species (ROS) has on NO and endothelial cell dysfunction and activation, resulting in decreased vasorelaxation, increased vascular (Vasc) resistance, blood pressure elevation, vascular stiffness, and the role they each play in the development of HTN. Activation of the renin-angiotensin-aldosterone system (RAAS) is also very important to the development of HTN as well as the activation of the sympathetic nervous system (SNS). Importantly, note the involvement of the Leptin—Leptin resistance (LR) pathway in blue coloring. Furthermore, note the emerging roles of the endothelial glycocalyx (ecGCx), aberrant mitochondria (aMt), hyperhomocysteinemia (HHCY), and gut dysbiosis, which are related to inflammation via lipopolysaccharide (LPS), as these are emerging roles not only of the MetS reloaded but also in the development of HTN (colored in purple). The sum of these interacting pathways and functional changes are associated with vascular wall remodeling and vascular stiffening. This image adds additional information regarding some of the possible mechanisms in the development of HTN presented in figure nine because it focuses more on the involved possible mechanistic pathways in the development of HTN. Not shown is the relationship between the sodium/potassium ATPase enzyme that is redox-sensitive and the excessive redox stress in the MetS that is currently thought to also promote a salt-sensitive HTN due to the sodium/potassium ATPase enzyme inhibition. While some of these mechanisms may seem redundant, they are actually complementary to Figure 9. The inverse relationship between leptin and adiponectin also plays an important role, because when leptin is elevated, adiponectin is decreased, and thus there is a decrease in the A/L ratio that is associated with the loss of adiponectin’s protective vascular role. Importantly, systolic HTN predominates in the MetS reloaded. AGE/RAGE = advanced glycation end products and receptor for AGE; Akt = protein kinase B; ALDO = aldosterone; Ang II = angiotensin II; ECM = extracellular matrix; IGT = impaired glucose tolerance; IL-6 = interleukin-6; LPS = lipopolysaccharide; Na + = sodium; NF-κB = nuclear factor kappa B; PAMP = pathogen associated molecular pattern; PGN = proteoglycan; PI3K = phosphoinositide 3-kinase; PKC = protein kinase C; Sk = skeletal; T2DM = type 2 diabetes mellitus; TNFα = tumor necrosis factor-alpha; VSMC = vascular smooth muscle cell.
Figure 11
Figure 11
Folate-mediated one-carbon metabolism (FOCM). FOCM involves multiple complex interacting cycles within the cytosol, mitochondria, and nucleus in the metabolic syndrome (MetS) reloaded. Panel A demonstrates the methionine and folate cycles and supports the importance of the methyl donor S-adenosylmethionine (SAM), as well as demonstrating the importance of the essential B12, B9, and B6 vitamins. Panel B illustrates that FOCM is compartmentalized to the cytosol, mitochondria, and nucleus. Note that formate and SAM are transferred from the mitochondria to the nucleus via nuclear pores. This figure is modified and adapted with permission by CC 4.0 [17].
Figure 12
Figure 12
Impaired folate-mediated one-carbon metabolism (FOCM) and hyperhomocyteinemia (HHCY) are associated with multiorgan damage and multiple clinical diseases via excessive redox stress. Once impaired FOCM develops and goes unchecked, this homocysteine (HCY) wheel begins turning and just keeps on turning, causing damage to the various organs and tissue systems identified, and results in multiple clinical disease states depicted on the HCY wheel (left-hand side of this image). When impaired FOCM and HHCY develops, the elevated HCY is capable of undergoing autoxidation, the formation of Hcy mixed disulfides, the interaction of Hcy thiolactones, and protein homocysteinylation reactions that result in damage and dysfunction to proteins, lipids, and nucleic acids. Note that the asterisks indicate increased importance. These damaging effects result in at least 14 damaging effects enumerated on the right-hand side of this image. This image is provided with permission by CC 4.0 [17]. CHF = congestive heart failure; COVID-19 = coronavirus disease-19; CVD = cerebro-cardiovascular disease; EC = endothelial cell; ecGCx = endothelial cell glycocalyx; eNOS = endothelial nitric oxide synthase; HTN = hypertension; IFNγ = interferon gamma; NO = nitric oxide; LDL = low-density lipoprotein cholesterol; MetS = metabolic syndrome; MMPs = matrix metalloproteinases; NFkappaB = nuclear factor kappa B; NTD = neural tube defects; LC/PASC = long COVID/ post-acute sequelae of SARS-CoV-2; LOAD = late-onset Alzheimer’s disease; Ox = oxidative stress; RBCs = red blood cells; RONS = reactive oxygen nitrogen species; T2DM = type 2 diabetes mellitus. TNFα = tumor necrosis factor alpha.
Figure 13
Figure 13
Examples of transmission electron microscopic (TEM) images for endothelial cell activation (ECact). Panel B depicts the thickened electron-lucent areas (red arrows) of ECact as compared to control models in Panel A. Panel C depicts basement membrane (BM) thickening with increased vacuoles (V) and vesicles (v). Panels D and E depict monocyte (D) and lymphocyte (E), platelet (F) and red blood cell (RBC) adhesion (G) to the activated ECs, respectively. Adhesions sites in panels E and G are denoted by white arrows. Original magnification x2000; scale bar = 1 μm, and images are modified with permission of CC 4.0 [55]. Images (Panels CG) are reproduced and modified with permission of CC 4.0 [11,136]. Magnifications and scale bars vary. ACfp = astrocyte foot processes; Cl, capillary lumen; EC = endothelial cells; ECact = endothelial cell activation; MP = microparticle of the platelet.
Figure 14
Figure 14
Summary of the observational ultrastructural transmission electron microscopic (TEM) remodeling changes in activated systemic and brain endothelial cells. ECMR = endothelial cell mineralocorticoid receptor; DIO = diet induced obesity; EC(s) = endothelial cell(s); BEC(s) = brain endothelial cell(s); ER = endoplasmic reticulum; MtROS= mitochondria reactive oxygen species; NADPH Ox =nicotinamide adenine dinucleotide phosphate oxidase; RBC(s) = red blood cell(s); RONSS = reactive oxygen, nitrogen, sulfur species; ROS = reactive oxygen species; RSI = reactive species interactome; W = Western mice.
Figure 15
Figure 15
Lanthanum nitrate staining of the endothelial glycocalyx (ecGCx) and an illustration of the (ecGCx) in the metabolic syndrome reloaded. Panel A demonstrates the normal lanthanum nitrate (LAN) perfusion fixation staining of the endothelial glycocalyx (ecGCx) in a post-capillary venule. This exploded image demonstrates the normal staining of the ecGCx in a healthy control male CD-1 mouse brain from the frontal cortical grey matter layer III with the original scale bar of 2 μm intact. Note the intense electron-dense staining of lanthanum nitrate of the apical brain endothelial cell(s) (BECs) for the ecGCx such that one cannot visualize the structural content of the ecGCx that is revealed in the following panel B illustration. Note the boxed-in insert in the lower right-hand corner (scale bar = 2 μm) with a white outline, which is the original image from which the exploded image in panel A is derived. Scale bar (black) = 2 μm and yellow scale bars = 500 nm. Panel B illustrates the various proteoglycans (PGNs) purple, glycoproteins (GPs) green, hyaluronan (HA) blue, glycosaminoglycans (GAGs) purple and green triangles, and their sulfation sites (red circles). Note that the asterisks indicate increased importance. Panel A is an original image recently acquired by the author that has not been previously published, and is presented only for its educational purposes. Panel B is a modified and adapted image with permission of CC 4.0 [30]. A = albumin; AGE/RAGE = advanced glycation end BM = basement membrane; CAD = cadherin; CAM = cellular adhesion molecule; CD44 = cluster of differentiation 44; EC = endothelial cell(s); ecSOD = extracellular superoxide dismutase; F = fibrinogen; FGF2 = fibroblast growth factor 2; FOCM = folate-mediated one-carbon metabolism; GCx = glycocalyx; ICAM-1 = intercellular adhesion molecule; Ox LDL = oxidized low-density lipoprotein; LPL = lipoprotein lipase; MMPs = matrix metalloproteinases; N = nucleus; Na+ = sodium; O = orosomucoids; Pc =vascular mural cell pericyte(s); PECAM- 1= platelet endothelial cell adhesion molecule-1. RONS = reactive oxygen species; VEC = vascular endothelial cell(s); TFPI = tissue factor pathway inhibitor; TJ/AJ = tight and adherens junctions; VCAM = vascular cell adhesion protein; VE CAD = vascular endothelial cadherins; VEGF = vascular endothelial growth factor; XOR = xanthine oxioreductase.
Figure 16
Figure 16
The obese diabetic BTBR ob/ob brain endothelial glycocalyx (ecGCx) in cortical layer III is protected with leptin replacement. This suggests that the presence of functioning leptin is important in maintaining a proper ecGCx covering of endothelial cells and that hyperleptinemia and selective leptin resistance (LR) could interfere with a healthy ecGCx as well as insulin resistance (IR). Panel A illustrates in the heterozygous non-diabetic control model cortical layer III (arrows) that the ecGCx is continuous. Panel B depicts a marked attenuation and/or loss of the ecGCx, and note that in regions where it is stained that it appears clumped (arrows) and discontinuous in the obese diabetic BTBR ob/ob model when compared to the control model in Panel A. Panel C displays a continuous coverage by the ecGCx in hippocampus CA-1 regions of the BTBR ob/ob models that were treated with intraperitoneal leptin for 16-weeks and stained with LAN (arrows). Panel D depicts the complete loss of LAN staining in the hippocampus CA-1 regions of the BTBR ob/ob; note that the tight and adherens junction (TJ/AJ) remains intact (yellow arrows). Importantly, the loss of the ecGCx may result in increased permeability. Magnification x4000; scale bar = 0.5 μm in Panels A and B. Magnification x10,000; scale bar = 0.2 µm in panels C and D. The supplemental two-panel image below the top four-panel (A–D) demonstrates longitudinal images of an intact ecGCx in control wild type (WT) models on the left-hand side, while there is a noticeable attenuation and loss of the ecGCx in the leptin-deficient BTBR ob/ob model on the right-hand side in hippocampal regions. Magnification x10,000; scale bar = 0.2 μm. Images provided and modified with the permission of CC 4.0 [30]. ACfp = astrocyte foot process; Cl = capillary lumen; EC = brain endothelial cell; HC and HIPOC = hippocampus CA-1 regions.
Figure 16
Figure 16
The obese diabetic BTBR ob/ob brain endothelial glycocalyx (ecGCx) in cortical layer III is protected with leptin replacement. This suggests that the presence of functioning leptin is important in maintaining a proper ecGCx covering of endothelial cells and that hyperleptinemia and selective leptin resistance (LR) could interfere with a healthy ecGCx as well as insulin resistance (IR). Panel A illustrates in the heterozygous non-diabetic control model cortical layer III (arrows) that the ecGCx is continuous. Panel B depicts a marked attenuation and/or loss of the ecGCx, and note that in regions where it is stained that it appears clumped (arrows) and discontinuous in the obese diabetic BTBR ob/ob model when compared to the control model in Panel A. Panel C displays a continuous coverage by the ecGCx in hippocampus CA-1 regions of the BTBR ob/ob models that were treated with intraperitoneal leptin for 16-weeks and stained with LAN (arrows). Panel D depicts the complete loss of LAN staining in the hippocampus CA-1 regions of the BTBR ob/ob; note that the tight and adherens junction (TJ/AJ) remains intact (yellow arrows). Importantly, the loss of the ecGCx may result in increased permeability. Magnification x4000; scale bar = 0.5 μm in Panels A and B. Magnification x10,000; scale bar = 0.2 µm in panels C and D. The supplemental two-panel image below the top four-panel (A–D) demonstrates longitudinal images of an intact ecGCx in control wild type (WT) models on the left-hand side, while there is a noticeable attenuation and loss of the ecGCx in the leptin-deficient BTBR ob/ob model on the right-hand side in hippocampal regions. Magnification x10,000; scale bar = 0.2 μm. Images provided and modified with the permission of CC 4.0 [30]. ACfp = astrocyte foot process; Cl = capillary lumen; EC = brain endothelial cell; HC and HIPOC = hippocampus CA-1 regions.
Figure 17
Figure 17
Multiple cell types in the brain contain aberrant mitochondria (aMt), and emerging evidence suggest a bidirectional relationship between aMt and the attenuation or loss of the endothelial glycocalyx (ecGCx). Panel 1 depicts multiple cell types in the brain with aMt (pseudo-colored yellow with red outlines). These aMt are in contrast to the smaller electron-dense Mt found in control model brain endothelial cells. aMt are hyperlucent and lose their electron dense mitochondrial matrix and cristae in brain endothelial cells (BECs) (A), astrocytes (AC) (B), pericytes (Pc) and foot processes (fC), myelinated neuronal axons (D), oligodendrocyte (OLIG) (E), and unmyelinated axons (F). These modified images are provided by CC 4.0 [121,122,123]. Magnifications and scale bars are included in each panel. Panel 2 illustrates that there may be a bidirectional relationship between aMt and dysfunction, attenuation, and/or loss (shedding) of the brain BECs ecGCx. This illustration establishes the role of oxidant stress–reactive oxygen species (ROS) in BECs and specifically mitochondrial ROS (mtROS) (left-hand box). This schematic also shows that obesity, IR, LR, impaired fasting glucose (IFG), impaired glucose tolerance (IGT), and overt T2DM are related to increased Mt fission, decreased mitophagy, and the accumulation of leaky aMt that leak mtROS (right-hand box). Leaky aMt may be responsible for the attenuation and/or loss of the ecGCx (red-dashed arrows), and that, in turn, may result in the loss of the ecGCx that may contribute to an increase in aMt (black-dashed arrows). In addition, mtROS superoxide or hydrogen peroxide (H2O2) could oxidize the essential tetrahydrobiopterin (BH4) cofactor that is absolutely essential for the eNOS enzyme to produce nitric oxide (NO) and result in eNOS uncoupling. eNOS uncoupling could ultimately result in decreased bioavailable NO. The depicted bidirectional interaction could result in a vicious cycle. This vicious cycle could be interrupted by either preventing the accumulation of aMt (improved mitophagy) or preventing the dysfunction, attenuation, and/or loss (shedding) of the ecGCx. Asterisk = myelin (M); L = lysosome; RBC = red blood cell.
Figure 18
Figure 18
The triangulation of metabolic function, gut microbiota, and the innate immune system. This illustration demonstrates that microbiota dysbiosis, metabolic dysfunction, and an activated proinflammatory innate immune system are bidirectionally associated with obesity and the metabolic syndrome reloaded. Importantly, this triangulation results in a dysfunctional gut-epithelial and gut-vascular barrier that results in a leaky gut to allow increased metainflammation and impaired gut-liver, gut- brain, gut-heart, and gut-kidney homeostasis with resulting impairment of the gut to the brain-heart-kidney axis.
Figure 19
Figure 19
From control multilocular brown adipose tissue (BAT) to unilocular white adipose tissue in the obese, insulin resistant (IR), selective leptin resistant (LR), diabetic db/db models in aortic perivascular adipose tissue (PVAT) of the tunica adiposa. Panel A demonstrates the normal multilocular BAT in the PVAT—VAT with multiple lipid droplet(s) (Ld) and electron-dense mitochondria of the descending thoracic aorta in control models. Panel B depicts the markedly expanded unilocular WAT with engorgement of triglycerides to form the huge lipid droplet droplets (Ld) with marked thinning of the adipocyte plasma membrane and the compressed mitochondria (yellow arrows). Panel C depicts the inflammatory macrophage (MΦ) cytoadherence to the unilocular hypertrophic engorged adipocyte to the point of rupture (red open arrow); note the absence of the mitochondria at the site of rupture. Panel D depicts the most prominent inflammatory cell macrophage (MΦ) found within the PVAT of the diabetic db/db models. Panel E depicts the formation of macrophage crown-like structures (CLS) (arrows) in the diabetic db/db models. Panel F depicts the second most prominent inflammatory cell, the mast cell (MC), with its prominent electron-dense secretory granules. These modified images are presented with the permission of CC 4.0 [121,189]. Magnifications and scale bars vary and are included in each image. ECM = extracellular matrix; Mt = mitochondria; N = nucleus.
Figure 20
Figure 20
Adipocyte plasma membrane thinning with rupture of plasma membrane (pm) with extrusions of the lipid droplet (Ld) contents and macrophage (MΦ) extrusions of extracellular vesicles (small exosome-like vesicles 60–70 nm in diameter with yellow circles) in the obese, insulin-resistant, leptin-resistant, diabetic db/db perivascular adipose tissue (PVAT)—visceral adipose tissue (VAT) of the tunica adiposa of the descending thoracic aorta. Panel A demonstrates the extreme thinning and loss of the plasma membrane integrity (dashed line) and rupture (open red arrow) that is associated with crown-like structures of macrophage cytoadherence. Panels B and C depict the complete loss of the pm with the rupture and extrusion of the lipid droplet contents into the extracellular matrix (ECM) interstitium of the PVAT—VAT (open red arrows). Importantly, note that these extruded lipids appear as extracellular exosome-like vesicles (encircled) in Panel C, in that their diameter is ~60–70 nm, and also note the scale bar that is placed centrally to suggest that their diameter meets the criteria for small exosomes (<100 nm) being extruded from the unilocular ruptured adipocytes in the PVAT. Importantly, the control models that consisted of brown adipose tissue and the models treated with empagliflozin did not demonstrate any crown-like structures (CLS) or ruptured adipocytes as in the diabetic db/db models. Panels DF depict the extrusion of extracellular exosome-like vesicles that are less than 100 nm and are therefore considered to be small macrophage-derived EVexosomes (asterisk and encircled in yellow color) and similar to the morphology of the adipocyte EVexosome-like vesicles in Panel C. Note the red open arrows indicating pm rupture. These modified images are presented with the permission of CC 4.0 [121,189]. Magnification and scale bars vary and are present in each panel.
Figure 21
Figure 21
Increased adipokines, assorted cytokines, chemokines, and toxic free fatty acids’ (FFAs) effects on cerebrocardiovascular function and disease. Panel A (upper panel) depicts multiple adipokines, their functions in obesity, and effects influencing cerebrocardiovascular disease. Note that the asterisk indicates emerging importance. Panel B (lower panel) depicts assorted visceral adipose and adipose-derived macrophage-derived cytokines/chemokines and toxic FFAs. CCL2 = chemokine ligand 2; CCL5 = chemokine ligand 5; CCVD = cerebrocardiovascular disease; CLS = crown-like structures; EC = endothelial cell; FFA = saturated free fatty acids; IL-1β = interleukin 1-β;IL-6 = interleukin-6; IR = insulin resistance; LR = leptin resistance; MCP-1 = monocyte chemotactic protein-1; MΦ = macrophage; PAI-1 = plasminogen activator inhibitor -1; RANTES = regulated on activation, normal T cell expressed and secreted; ROS = reactive oxygen species; RONSS = reactive oxygen, nitrogen, sulfur species; T2DM = type 2 diabetes mellitus; TNFα = tumor necrosis alpha; VSMC = vascular smooth muscle cell.
Figure 22
Figure 22
Cell specific miRNAs profiles in adipocytes and activated, M1-like macrophages (MΦs) in the obese PVAT—VAT. Panel A depicts the decreased miRNAs (black lettering and black arrow) and the increased miRNAs (red lettering and red arrow) in obese visceral adipose tissue including perivascular adipose tissue (PVAT). Panel B depicts the elevated miRNAs (red lettering and red arrow) in the activated M1-like macrophages in the PVAT—VAT [6,204,205,206,207,208,209,210].
Figure 23
Figure 23
The A-FLIGHT-UR acronym may be utilized as an aid in remembering the multiple risk factors and metabolic toxicities associated with the MetS reloaded. This modified and updated table is provided with permission by CC 4.0 [12]. AGE = advanced glycation end products; ALE = advance lipoxidation end products; FOCM = folate one-carbon metabolism; HDL-C = high density lipoprotein-cholesterol; HPA = hypothalamic pituitary adrenal; Il-6 = interleukin-6; HDL = high-density lipoprotein; LDL-C = low-density lipoprotein-cholesterol; PKC = protein kinase C; RAGE = receptor or AGE; TNFα = tumor necrosis alpha.

Similar articles

Cited by

References

    1. National Cholesterol Education Program (NCEP) Expert Panel on Detection, Evaluation, and Treatment of High Blood Cholesterol in Adults Executive summary of the third report of the National Cholesterol Education Program (NCEP) Expert Panel on Detection, Evaluation, and Treatment of High Blood Cholesterol in Adults (Adult Treatment Panel III) JAMA. 2002;285:2486–2497. doi: 10.1001/jama.285.19.2486. - DOI - PubMed
    1. Grundy S.M., Brewer H.B., Jr., Cleeman J.I., Smith S.C., Jr., Lenfant C., American Heart Association. National Heart, Lung, and Blood Institute Definition of metabolic syndrome: Report of the National Heart, Lung, and Blood Institute/American Heart Association conference on scientific issues related to definition. Circulation. 2004;109:433–438. doi: 10.1161/01.CIR.0000111245.75752.C6. - DOI - PubMed
    1. Kylin E. Studien ueber das Hypertonie-Hyperglyka “mie-Hyperurika” miesyndrom. Zent. Fuer Inn. Med. 1923;44:105–127.
    1. Himsworth H.P., Kerr R.B. Insulin-sensitive and insulin-insensitive types of diabetes mellitus. Clin. Sci. 1939;4:119–152.
    1. Reaven G.M. Banting lecture 1988. Role of insulin resistance in human disease. Diabetes. 1988;37:1595–1607. doi: 10.2337/diab.37.12.1595. - DOI - PubMed

MeSH terms

Substances