

Effects of Nodulation on Metabolite Concentrations in Xylem Sap and in the Organs of Soybean Plants Supplied with Different N Forms
- PMID: 36984759
- PMCID: PMC10058755
- DOI: 10.3390/metabo13030319
Effects of Nodulation on Metabolite Concentrations in Xylem Sap and in the Organs of Soybean Plants Supplied with Different N Forms
Abstract
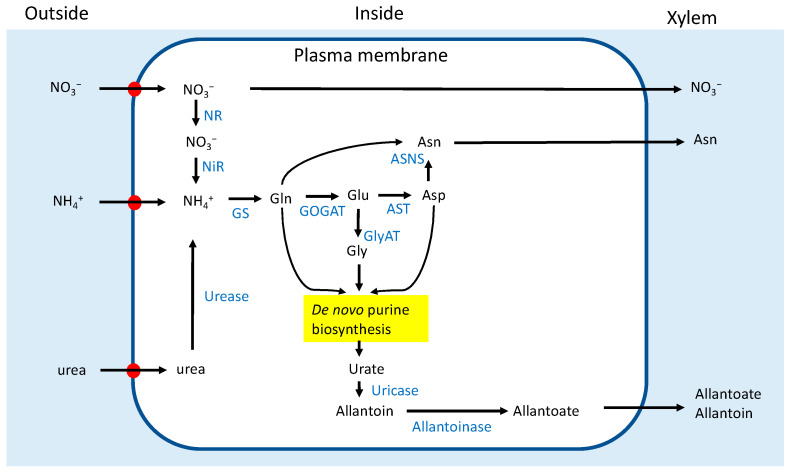
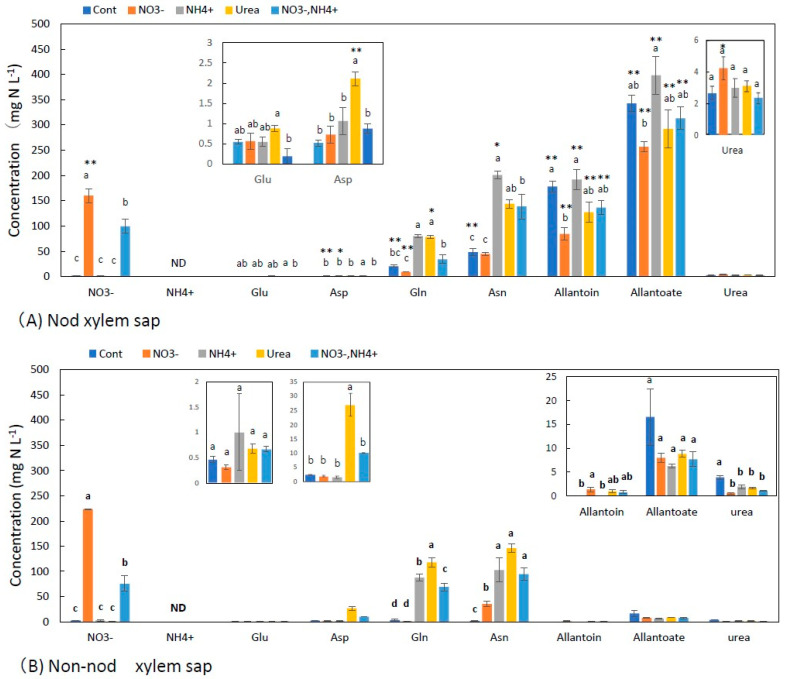
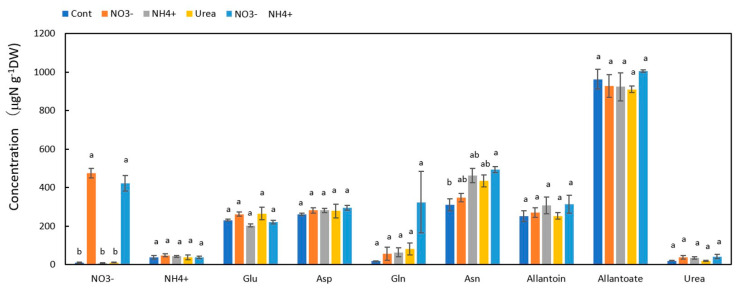
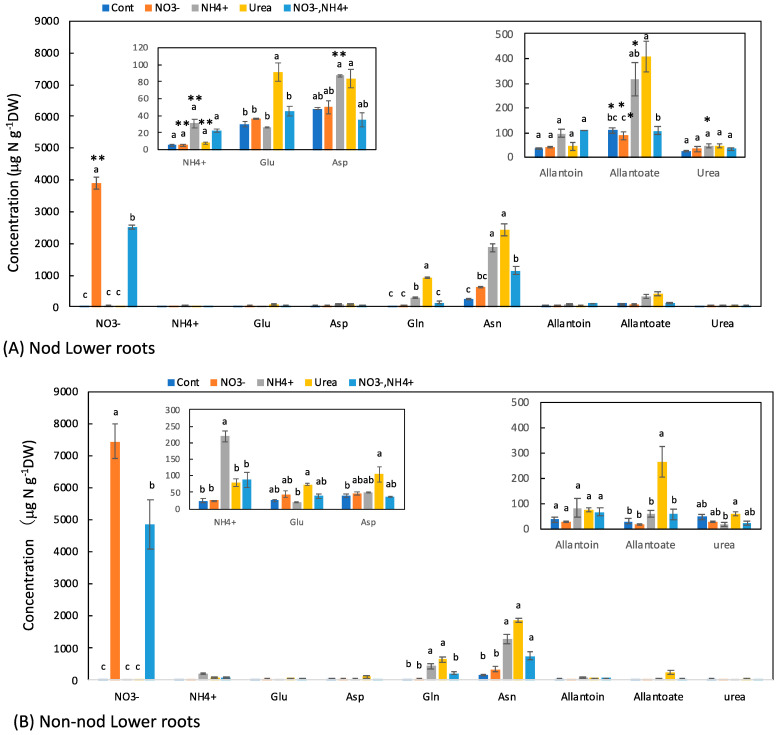
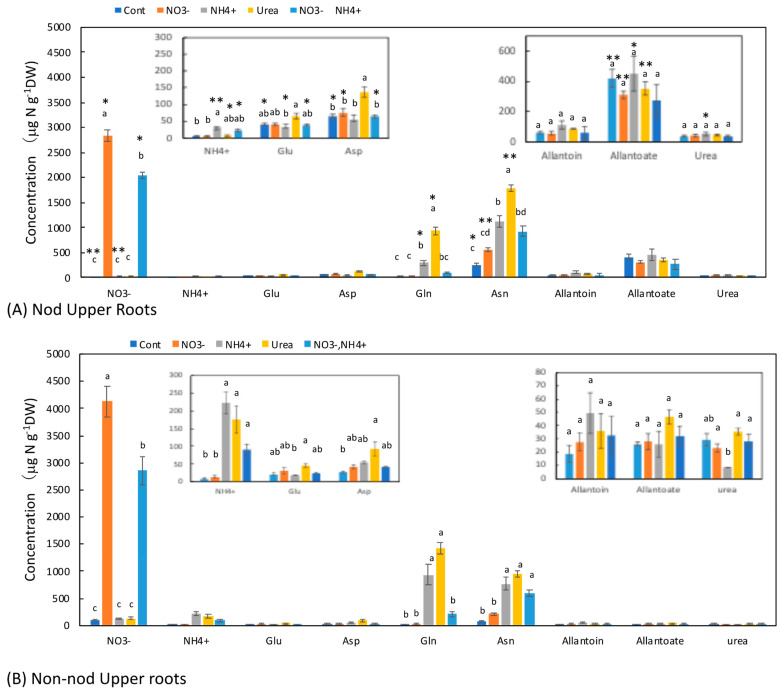
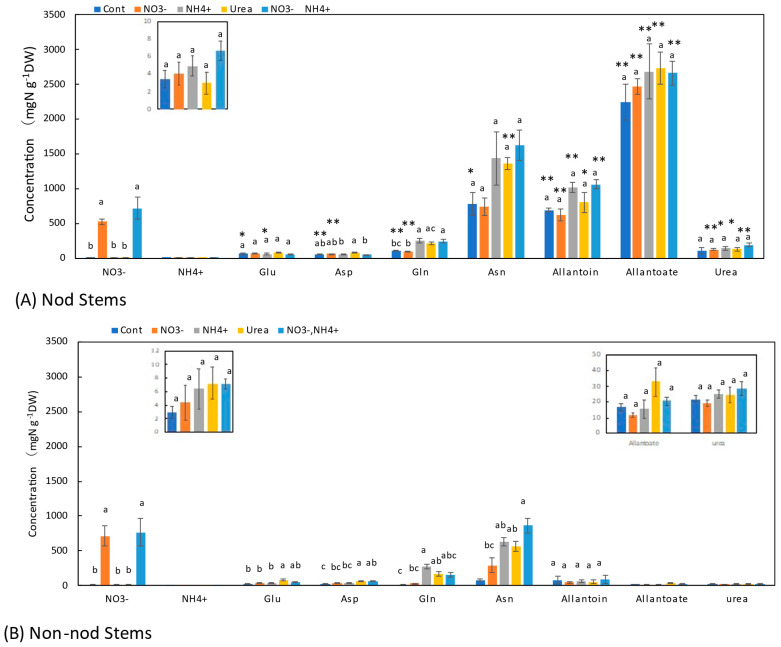
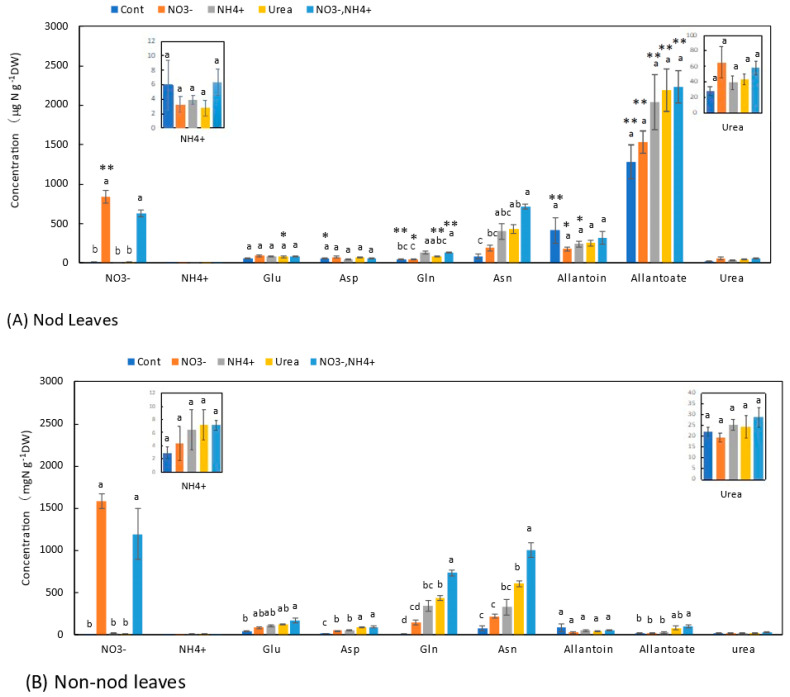
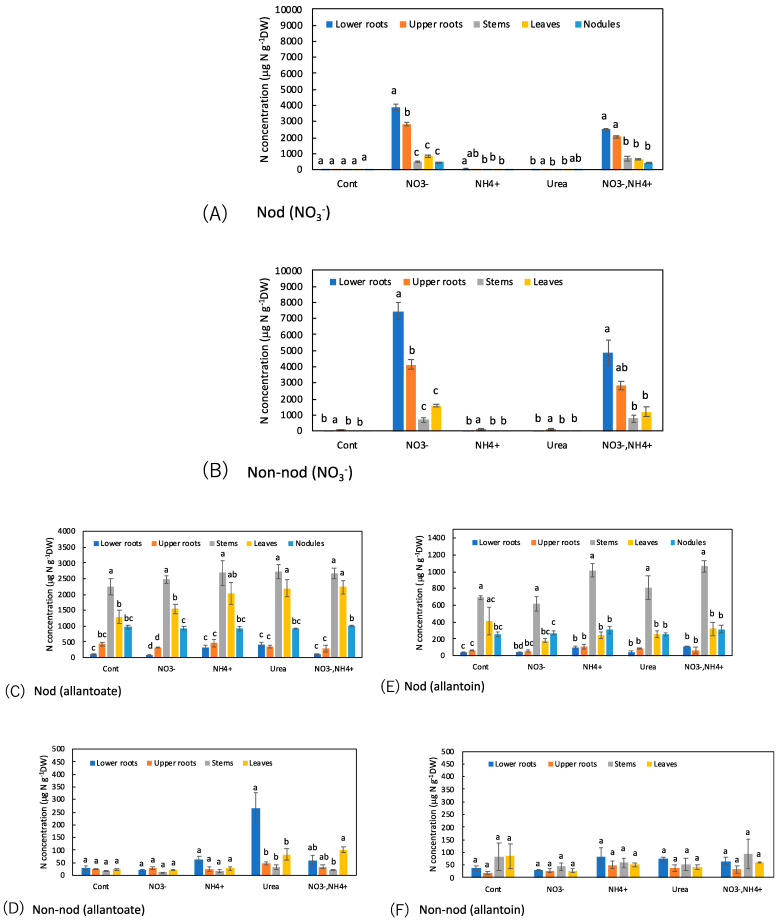
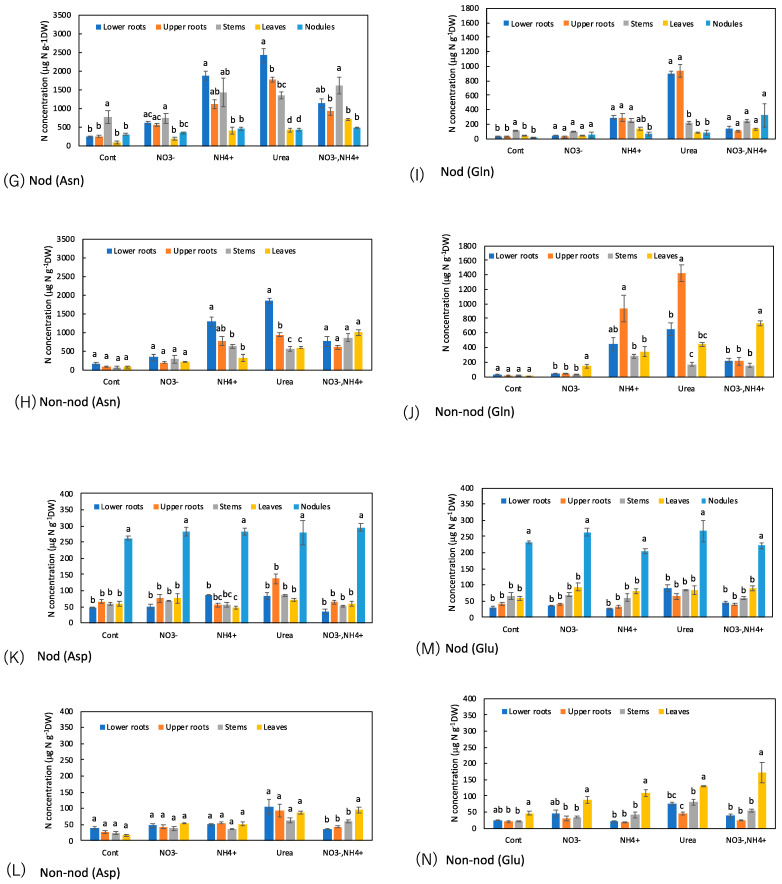
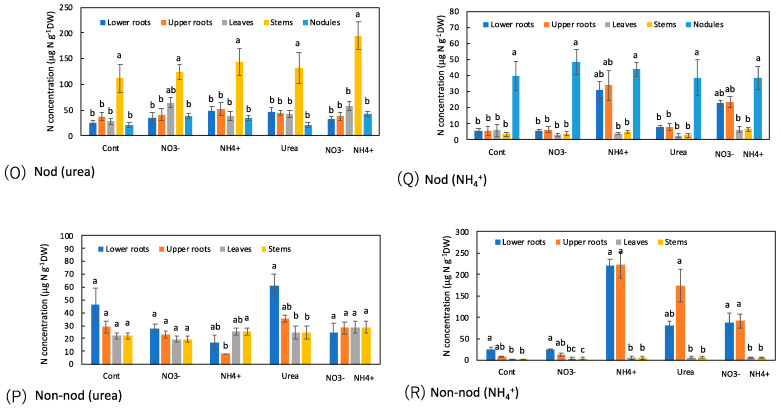
The effects of nodulation on N metabolism in soybean plants supplied with various forms of N are not fully understood. Ureides are the principal forms of N transported from nodules, but nitrate and asparagine are the primary N compounds transported from roots supplied with NO3-. In this research, the effects of 1-day treatments of NO3-, NH4+, urea, or NO3- + NH4+ on N metabolite concentrations in xylem sap and each organ were compared between nodulated and non-nodulated soybeans. Capillary electrophoresis and colorimetry were used for the analysis. In the xylem sap of the nodulated plants with an N-free solution, ureides were the major N metabolites, followed by asparagine and glutamine. Ureides concentrations were much lower in the xylem sap of the non-nodulated soybeans. In the NO3- treatment, the concentrations of ureides in the xylem sap of the nodulated plants decreased compared to the control plants. In the NH4+, urea, and NO3- + NH4+ treatments, the concentrations of asparagine and glutamine increased significantly compared with the control and NO3- treatments. Similar changes with the N treatments were observed between the nodulated and non-nodulated soybeans, suggesting that nodulation does not have significant effects on the metabolism of absorbed N in roots.
Keywords: allantoate; allantoin; asparagine; capillary electrophoresis; glutamine; nitrate; nodule; soybean; urea; xylem sap.
Conflict of interest statement
The authors declare no conflict of interest.
Figures
Similar articles
-
Application of Nitrate, Ammonium, or Urea Changes the Concentrations of Ureides, Urea, Amino Acids and Other Metabolites in Xylem Sap and in the Organs of Soybean Plants (Glycine max (L.) Merr.).Int J Mol Sci. 2021 Apr 27;22(9):4573. doi: 10.3390/ijms22094573. Int J Mol Sci. 2021. PMID: 33925462 Free PMC article.
-
Transport of nitrogen in the xylem of soybean plants.Plant Physiol. 1979 Sep;64(3):411-6. doi: 10.1104/pp.64.3.411. Plant Physiol. 1979. PMID: 16660977 Free PMC article.
-
Nitrogen Nutrition and Xylem Sap Composition of Peanut (Arachis hypogaea L. cv Virginia Bunch).Plant Physiol. 1986 Dec;82(4):946-51. doi: 10.1104/pp.82.4.946. Plant Physiol. 1986. PMID: 16665171 Free PMC article.
-
Early signaling, synthesis, transport and metabolism of ureides.J Plant Physiol. 2016 Apr 1;193:97-109. doi: 10.1016/j.jplph.2016.01.013. Epub 2016 Feb 22. J Plant Physiol. 2016. PMID: 26967003 Review.
-
Differences in nitrogen metabolism of Faidherbia albida and other N2 -fixing tropical woody acacias reflect habitat water availability.New Phytol. 2000 Sep;147(3):571-578. doi: 10.1046/j.1469-8137.2000.00714.x. New Phytol. 2000. PMID: 33862944 Review.
Cited by
-
Effects of Varying N, P, K, Mg, and Ca Concentrations on Nitrogen Transport in Xylem Sap of Rice Plants.Plants (Basel). 2025 Apr 8;14(8):1154. doi: 10.3390/plants14081154. Plants (Basel). 2025. PMID: 40284042 Free PMC article.
-
LC-MS and NMR Based Plant Metabolomics: A Comprehensive Phytochemical Investigation of Symphytum anatolicum.Metabolites. 2023 Oct 4;13(10):1051. doi: 10.3390/metabo13101051. Metabolites. 2023. PMID: 37887376 Free PMC article.
References
-
- Sato T., Onoma N., Fujikake H., Ohtake N., Sueyoshi K., Ohyama T. Changes in four leghemoglobin components in nodules of hypernodulating soybean (Glycine max [L.] Merr.) mutant and its parent in the early nodule developmental stage. Plant Soil. 2001;237:129–135. doi: 10.1023/A:1013317219871. - DOI
-
- Yamashita N., Tanabata S., Ohtake N., Sueyoshi K., Sato T., Higuchi K., Saito A., Ohyama T. Effects of different chemical forms of nitrogen on the quick and reversible inhibition of soybean nodule growth and nitrogen fixation activity. Front. Plant Sci. 2019;10:131. doi: 10.3389/fpls.2019.00131. - DOI - PMC - PubMed
-
- Ohyama T., Kumazawa K. Assimilation and transport of nitrogenous compounds originated from 15N2 fixation and 15NO3 absorption. Soil Sci. Plant Nutr. 1979;25:9–19. doi: 10.1080/00380768.1979.10433141. - DOI
-
- Ohyama T., Kumazawa K. Comparative studies on the distribution of nitrogen in soybean plants supplied with N2 and NO3− at the pod filling stage. II. Assimilation and Transport of nitrogenous constituents. Soil Sci. Plant Nutr. 1984;30:219–229. doi: 10.1080/00380768.1984.10434685. - DOI
LinkOut - more resources
Full Text Sources
Molecular Biology Databases
Miscellaneous
