

Experimental Basis Sets of Quantification of Brain 1H-Magnetic Resonance Spectroscopy at 3.0 T
- PMID: 36984808
- PMCID: PMC10056301
- DOI: 10.3390/metabo13030368
Experimental Basis Sets of Quantification of Brain 1H-Magnetic Resonance Spectroscopy at 3.0 T
Abstract
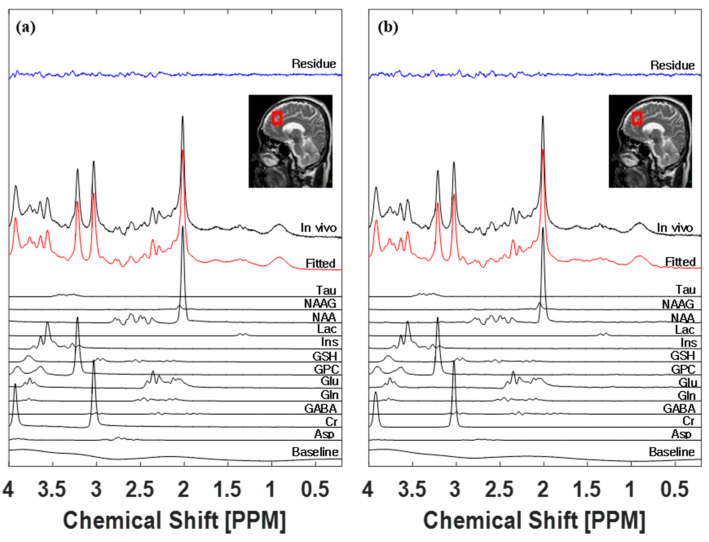
In vivo short echo time (TE) proton magnetic resonance spectroscopy (1H-MRS) is a useful method for the quantification of human brain metabolites. The purpose of this study was to evaluate the performance of an in-house, experimentally measured basis set and compare it with the performance of a vendor-provided basis set. A 3T clinical scanner with 32-channel receive-only phased array head coil was used to generate 16 brain metabolites for the metabolite basis set. For voxel localization, point-resolved spin-echo sequence (PRESS) was used with volume of interest (VOI) positioned at the center of the phantoms. Two different basis sets were subjected to linear combination of model spectra of metabolite solutions in vitro (LCModel) analysis to evaluate the in-house acquired in vivo 1H-MR spectra from the left prefrontal cortex of 22 healthy subjects. To evaluate the performance of the two basis sets, the Cramer-Rao lower bounds (CRLBs) of each basis set were compared. The LCModel quantified the following metabolites and macromolecules: alanine (Ala), aspartate (Asp), γ-amino butyric acid (GABA), glucose (Glc), glutamine (Gln), glutamate (Glu), glutathione (GHS), Ins (myo-Inositol), lactate (Lac), N-acetylaspartate (NAA), N-acetylaspartylglutamate (NAAG), taurine (Tau), phosphoryl-choline + glycerol-phosphoryl-choline (tCho), N-acetylaspartate + N-acetylaspartylglutamate (tNA), creatine + phosphocreatine (tCr), Glu + Gln (Glx) and Lip13a, Lip13b, Lip09, MM09, Lip20, MM20, MM12, MM14, MM17, Lip13a + Lip13b, MM14 + Lip13a + Lip13b + MM12, MM09 + Lip09, MM20 + Lip20. Statistical analysis showed significantly different CRLBs: Asp, GABA, Gln, GSH, Ins, Lac, NAA, NAAG, Tau, tCho, tNA, Glx, MM20, MM20 + Lip20 (p < 0.001), tCr, MM12, MM17 (p < 0.01), and Lip20 (p < 0.05). The estimated ratio of cerebrospinal fluid (CSF) in the region of interest was calculated to be about 5%. Fitting performances are better, for the most part, with the in-house basis set, which is more precise than the vendor-provided basis set. In particular, Asp is expected to have reliable CRLB (<30%) at high field (e.g., 3T) in the left prefrontal cortex of human brain. The quantification of Asp was difficult, due to the inaccuracy of Asp fitting with the vendor-provided basis set.
Keywords: LCModel; MRS; basis set; metabolite; quantification.
Conflict of interest statement
The authors declare no conflict of interest.
Figures


Similar articles
-
Repeatability of proton magnetic resonance spectroscopy of the brain at 7 T: effect of scan time on semi-localized by adiabatic selective refocusing and short-echo time stimulated echo acquisition mode scans and their comparison.Quant Imaging Med Surg. 2021 Jan;11(1):9-20. doi: 10.21037/qims-20-517. Quant Imaging Med Surg. 2021. PMID: 33392007 Free PMC article.
-
Validation of in vivo MRS measures of metabolite concentrations in the human brain.NMR Biomed. 2019 Mar;32(3):e4058. doi: 10.1002/nbm.4058. Epub 2019 Jan 21. NMR Biomed. 2019. PMID: 30663818
-
Improved resolution of glutamate, glutamine and γ-aminobutyric acid with optimized point-resolved spectroscopy sequence timings for their simultaneous quantification at 9.4 T.NMR Biomed. 2018 Jan;31(1). doi: 10.1002/nbm.3851. Epub 2017 Nov 3. NMR Biomed. 2018. PMID: 29105187
-
Neurometabolic timecourse of healthy aging.Neuroimage. 2022 Dec 1;264:119740. doi: 10.1016/j.neuroimage.2022.119740. Epub 2022 Nov 8. Neuroimage. 2022. PMID: 36356822 Free PMC article.
-
Improvement of resolution for brain coupled metabolites by optimized (1)H MRS at 7T.NMR Biomed. 2010 Nov;23(9):1044-52. doi: 10.1002/nbm.1529. NMR Biomed. 2010. PMID: 20963800
References
-
- Brambilla P., Stanley J.A., Nicoletti M.A., Sassi R.B., Mallinger A.G., Frank E., Kupfer D., Keshavan M.S., Soares J.C. 1H magnetic resonance spectroscopy investigation of the dorsolateral prefrontal cortex in bipolar disorder patients. J. Affect. Disord. 2005;86:61–67. doi: 10.1016/j.jad.2004.12.008. - DOI - PubMed
-
- Chawla S., Wang S., Moore P., Woo J.H., Elman L., McCluskey L.F., Melhem E.R., Grossman M., Poptani H. Quantitative proton magnetic resonance spectroscopy detects abnormalities in dorsolateral prefrontal cortex and motor cortex of patients with frontotemporal lobar degeneration. J. Neurol. 2010;257:114–121. doi: 10.1007/s00415-009-5283-3. - DOI - PMC - PubMed
-
- Yue Q., Liu M., Nie X., Wu Q., Li J., Zhang W., Huang X., Gong Q. Quantitative 3.0T MR Spectroscopy Reveals Decreased Creatine Concentration in the Dorsolateral Prefrontal Cortex of Patients with Social Anxiety Disorder. PLoS ONE. 2012;7:e48105. doi: 10.1371/journal.pone.0048105. - DOI - PMC - PubMed
LinkOut - more resources
Full Text Sources
