. 2023 Mar 17;13(3):441.
doi: 10.3390/metabo13030441.

A Pilot Study on Biochemical Profile of Follicular Fluid in Breast Cancer Patients

Affiliations

A Pilot Study on Biochemical Profile of Follicular Fluid in Breast Cancer Patients

Maria A Castiglione Morelli et al. Metabolites. .

Abstract

Breast cancer (BC) is the most common type of cancer among women in almost all countries worldwide and is one of the oncological pathologies for which is indicated fertility preservation, a type of procedure used to help keep a person's ability to have children. Follicular fluid (FF) is a major component of oocyte microenvironment, which is involved in oocyte growth, follicular maturation, and in communication between germ and somatic cells; furthermore, it accumulates all metabolites during oocytes growth. To obtain information about changes on fertility due to cancer, we aimed at investigating potential biomarkers to discriminate between FF samples obtained from 16 BC patients and 10 healthy women undergoing in vitro fertilization treatments. An NMR-based metabolomics approach was performed to investigate the FF metabolic profiles; ELISA and western blotting assays were used to investigate protein markers of oxidative and inflammatory stress, which are processes closely related to cancer. Our results seem to suggest that FFs of BC women display some significant metabolic alterations in comparison to healthy controls, and these variations are also related with tumor staging.

Keywords: NMR-based metabolomics; breast cancer; fertility preservation; inflammation; oxidative stress; tumor stage.


Conflict of interest statement

The authors declare no conflict of interest.

Figures

Figure 1
Figure 1
(A) PCA and (B) PLS-DA score plots obtained by 1H-NMR analysis on FF samples from all the 26 women examined in the study. The R2X and Q2 values for the two-component PLS-DA model were: 0.35 and 0.34, respectively. PLS-DA score plot between healthy women (n = 10) and: (C) BC patients with no lymph node metastasis (n = 10); (D) BC patients with lymph node metastasis (n = 6). The R2X and Q2 values for the two-component model reported in (C) were: 0.37 and 0.32, respectively; the corresponding values for the two-component model shown in (D) were 0.36 and 0.54, respectively. Data were colored by group: healthy controls were represented with red triangles; BC patients are shown in black using different symbols: patients with no lymph node metastasis (n = 10), boxes; patients with N1 (n = 5) and N2 lymph node metastasis (n = 1), triangles and dot, respectively.
Figure 2
Figure 2
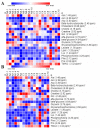
Heatmaps of the most relevant metabolites (with a VIP value > 1) that were associated with the differentiation between healthy controls (n = 10, group C) and: (A) BC patients with no lymph node metastasis (n = 10, group N0); and (B) BC patients with lymph node metastasis (n = 6, group N1 + N2). In columns are shown the different groups of women; in rows is reported the quantification of NMR integral bin regions of metabolites with VIP > 1, an * is used where significant differences between groups are observed (p-values < 0.05). Color scale indicates values ranging from blue (the lowest) to red (the highest).
Figure 3
Figure 3
Expression level of Nrf2, SOD-2, and NQO1 proteins in follicular fluids. Densitometric analysis of the immunoreactive bands performed in three independent experiments. After densitometric analysis, western blot signals of the target proteins are normalized to the total amount of protein in each lane. The box plots show medians and whiskers. Significance (* p < 0.05).
Figure 4
Figure 4
Boxplot representation of CXCL10 level in follicular fluids of control and BC patients. The box plots show medians and whiskers. Significance (* p < 0.05).
Figure 5
Figure 5
ROC curves for glutamine (A), and the 2 proteins or Nrf2 (B) and CXCL10 (C) with the highest ability to discriminate BC patients against controls. The curves were obtained with MetaboAnalyst 5.0 (https://www.metaboanalyst.ca/MetaboAnalyst/home.xhtml, accessed on 5 November 2022).

References

    1. The Cancer Atlas. [(accessed on 13 March 2023)]. Available online: https://canceratlas.cancer.org/the-burden/breast-cancer/
    1. GLOBOCAN 2020: New Global Cancer Data. [(accessed on 13 October 2022)]. Available online: https://www.uicc.org/news/globocan-2020-new-global-cancer-data.
    1. Polyak K. Heterogeneity in breast cancer. J. Clin. Investig. 2011;121:3786–3788. doi: 10.1172/JCI60534. - DOI - PMC - PubMed
    1. Russnes H.G., Navin N., Hicks J., Borresen-Dale A.L. Insight into the heterogeneity of breast cancer through next-generation sequencing. J. Clin. Investig. 2011;121:3810–3818. doi: 10.1172/JCI57088. - DOI - PMC - PubMed
    1. Kenemans P., Verstraeten R.A., Verheijen R.H. Oncogenic pathways in hereditary and sporadic breast cancer. Maturitas. 2008;61:141–150. doi: 10.1016/j.maturitas.2008.11.010. - DOI - PubMed

LinkOut - more resources