

Metabolic and Transcriptomic Signatures of the Acute Psychological Stress Response in the Mouse Brain
- PMID: 36984893
- PMCID: PMC10052811
- DOI: 10.3390/metabo13030453
Metabolic and Transcriptomic Signatures of the Acute Psychological Stress Response in the Mouse Brain
Abstract
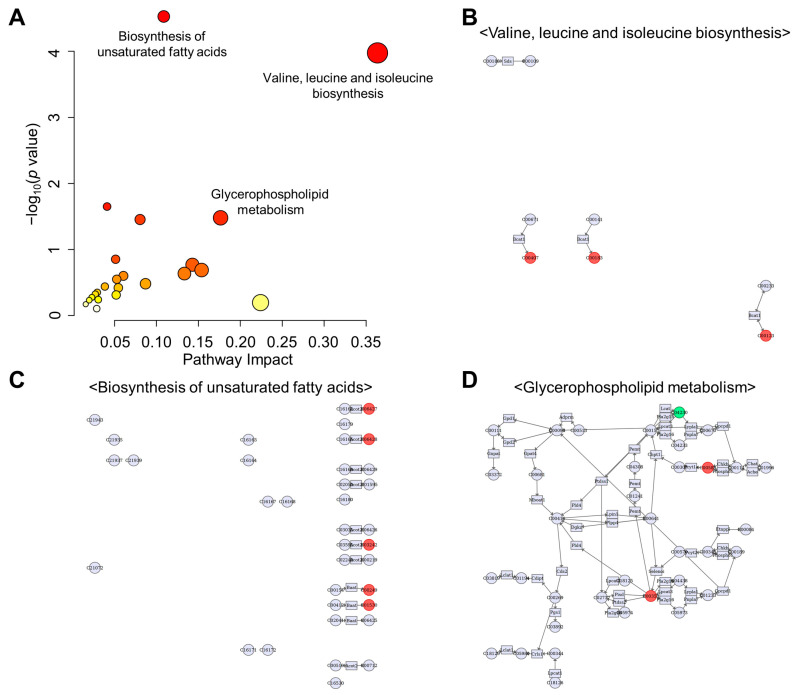
Acute stress response triggers various physiological responses such as energy mobilization to meet metabolic demands. However, the underlying molecular changes in the brain remain largely obscure. Here, we used a brief water avoidance stress (WAS) to elicit an acute stress response in mice. By employing RNA-sequencing and metabolomics profiling, we investigated the acute stress-induced molecular changes in the mouse whole brain. The aberrant expression of 60 genes was detected in the brain tissues of WAS-exposed mice. Functional analyses showed that the aberrantly expressed genes were enriched in various processes such as superoxide metabolism. In our global metabolomic profiling, a total of 43 brain metabolites were significantly altered by acute WAS. Metabolic pathways upregulated from WAS-exposed brain tissues relative to control samples included lipolysis, eicosanoid biosynthesis, and endocannabinoid synthesis. Acute WAS also elevated the levels of branched-chain amino acids, 5-aminovalerates, 4-hydroxy-nonenal-glutathione as well as mannose, suggesting complex metabolic changes in the brain. The observed molecular events in the present study provide a valuable resource that can help us better understand how acute psychological stress impacts neural functions.
Keywords: brain; metabolism; metabolomics; stress; transcriptomics.
Conflict of interest statement
The authors declare no conflict of interest.
Figures


Similar articles
-
Metabolic and Transcriptomic Changes in the Mouse Brain in Response to Short-Term High-Fat Metabolic Stress.Metabolites. 2023 Mar 9;13(3):407. doi: 10.3390/metabo13030407. Metabolites. 2023. PMID: 36984847 Free PMC article.
-
Integrated transcriptomic and metabolomic profiling reveals dysregulation of purine metabolism during the acute phase of spinal cord injury in rats.Front Neurosci. 2022 Nov 23;16:1066528. doi: 10.3389/fnins.2022.1066528. eCollection 2022. Front Neurosci. 2022. PMID: 36507345 Free PMC article.
-
Transcriptomic and metabolomic profiling of drought-tolerant and susceptible sesame genotypes in response to drought stress.BMC Plant Biol. 2019 Jun 20;19(1):267. doi: 10.1186/s12870-019-1880-1. BMC Plant Biol. 2019. PMID: 31221078 Free PMC article.
-
Hepatic metabolomics reveals that liver injury increases PCB 126-induced oxidative stress and metabolic dysfunction.Chemosphere. 2019 Feb;217:140-149. doi: 10.1016/j.chemosphere.2018.10.196. Epub 2018 Oct 30. Chemosphere. 2019. PMID: 30415113 Free PMC article.
-
Metabolomic and transcriptomic analysis reveals endogenous substrates and metabolic adaptation in rats lacking Abcg2 and Abcb1a transporters.PLoS One. 2021 Jul 13;16(7):e0253852. doi: 10.1371/journal.pone.0253852. eCollection 2021. PLoS One. 2021. PMID: 34255797 Free PMC article.
Cited by
-
Exploring metabolomic dynamics in acute stress disorder: amino acids, lipids, and carbohydrates.Front Genet. 2024 Jul 25;15:1394630. doi: 10.3389/fgene.2024.1394630. eCollection 2024. Front Genet. 2024. PMID: 39119583 Free PMC article. Review.
-
Lipid metabolism, remodelling and intercellular transfer in the CNS.Nat Rev Neurosci. 2025 Apr;26(4):214-231. doi: 10.1038/s41583-025-00908-3. Epub 2025 Feb 19. Nat Rev Neurosci. 2025. PMID: 39972160 Review.
References
Grants and funding
LinkOut - more resources
Full Text Sources
Molecular Biology Databases
