. 2023 Feb 26;11(3):588.
doi: 10.3390/microorganisms11030588.

The Pleiotropic Effects of Carbohydrate-Mediated Growth Rate Modifications in Bifidobacterium longum NCC 2705

Affiliations

The Pleiotropic Effects of Carbohydrate-Mediated Growth Rate Modifications in Bifidobacterium longum NCC 2705

Stéphane Duboux et al. Microorganisms. .

Abstract

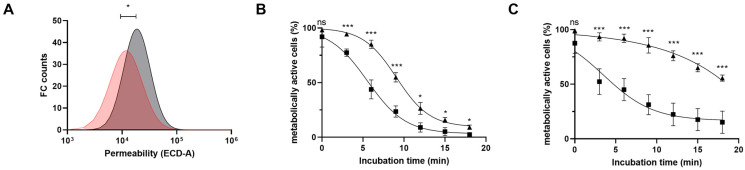
Bifidobacteria are saccharolytic bacteria that are able to metabolize a relatively large range of carbohydrates through their unique central carbon metabolism known as the "bifid-shunt". Carbohydrates have been shown to modulate the growth rate of bifidobacteria, but unlike for other genera (e.g., E. coli or L. lactis), the impact it may have on the overall physiology of the bacteria has not been studied in detail to date. Using glucose and galactose as model substrates in Bifidobacterium longum NCC 2705, we established that the strain displayed fast and slow growth rates on those carbohydrates, respectively. We show that these differential growth conditions are accompanied by global transcriptional changes and adjustments of central carbon fluxes. In addition, when grown on galactose, NCC 2705 cells were significantly smaller, exhibited an expanded capacity to import and metabolized different sugars and displayed an increased acid-stress resistance, a phenotypic signature associated with generalized fitness. We predict that part of the observed adaptation is regulated by the previously described bifidobacterial global transcriptional regulator AraQ, which we propose to reflect a catabolite-repression-like response in B. longum. With this manuscript, we demonstrate that not only growth rate but also various physiological characteristics of B. longum NCC 2705 are responsive to the carbon source used for growth, which is relevant in the context of its lifestyle in the human infant gut where galactose-containing oligosaccharides are prominent.

Keywords: bifidobacteria; carbon metabolism; catabolite repression; growth rate; stress resistance.


Conflict of interest statement

S. Duboux, S. Pruvost, C. Joyce, B. Bogicevic and J.A. Muller are all employed by Société des produits Nestlé SA.

Figures

Figure 1
Figure 1
Growth characteristics of B. longum NCC 2705 grown in DasGip bioreactors with 1% of glucose (A) or 1% of galactose (B). Optical density measured at 600 nm (OD; green circles), cell concentration measured by Colony Forming Unit (CFUs, red squares) and pH (black line) are depicted for each condition.
Figure 2
Figure 2
Confocal microscopic pictures of cells of B. longum NCC 2705 grown in DasGip bioreactors with 1% of glucose (A) or 1% of galactose (B). Panel (C) shows the cell size of both cultures (galactose in red, glucose in grey) represented by the forward scatter signal obtained by flow cytometry. Statistical analyses were performed using Welch-t test (**** p < 0.0001) on modeled population distributions.
Figure 3
Figure 3
Differential expression of genes related to carbohydrate import and central carbon metabolism of B. longum NCC 2705 grown on galactose or glucose. Color scale represent log2 fold change in galactose:glucose (green) or glucose:galactose (red).
Figure 4
Figure 4
Relative levels of fermentation end products produced by B. longum NCC 2705 grown on glucose or galactose. Acetate (green), lactate (red), ethanol (orange) and formate (blue) levels measured in stationary phase culture supernatants.
Figure 5
Figure 5
Differential expression of genes related to carbohydrate transport in B. longum NCC 2705 grown on galactose or glucose. Fold expression change in galactose growth induced (green) and glucose growth induced genes (red) are displayed in log2 scale.
Figure 6
Figure 6
Initial acidification rates of glucose (black bars) or galactose (grey bars) mid-exponentially grown, translationally blocked B. longum NCC 2705 cells that were provided different carbohydrates. Values were extracted from the average logarithmic slopes obtained within the first 200 min of incubation after subtracting background acidification (no carbs) levels. Average acidification rates and standard deviation were calculated from biological triplicate measured in duplicate. Statistical analyses were performed using an unpaired multiple t-test comparing all carbohydrate conditions to the “no carbs” control (* p < 0.01, ** p < 0.001, *** p < 0.0001).
Figure 7
Figure 7
Cell permeability and acid sensitivity profile of B. longum NCC 2705 grown on glucose or galactose. (A) shows the propidium iodide (PI) stained cells distribution of mid-exponential phase harvested glucose (grey) or galactose (red) grown B. longum NCC 2705. Acid sensitivity profile of B. longum NCC 2705 grown on glucose (squares) or galactose (triangles) when exposed to pH 2.9 is depicted in (B,C). The loss of metabolically active cell populations (as reflected by the loss of esterase activity; changing from CFDA+ to CFDA−) collected from exponentially (B) or the stationary (C) phase of growth is represented by the average and standard deviation of biological triplicates. Logistic growth modelling was applied to each curve of CFDA− population (r2 > 0.90) and inversed data were plotted. Stars represent the adjusted p-value (p-value; ns > 0.05, * p < 0.05; *** p < 0.001) obtained upon multiple unpaired t-test for each time points.

Similar articles

References

    1. Avershina E., Storrø O., Øien T., Johnsen R., Wilson R., Egeland T., Rudi K. Bifidobacterial Succession and Correlation Networks in a Large Unselected Cohort of Mothers and Their Children. Appl. Environ. Microbiol. 2013;79:497–507. doi: 10.1128/AEM.02359-12. - DOI - PMC - PubMed
    1. Kalliomäki M., Kirjavainen P., Eerola E., Kero P., Salminen S., Isolauri E. Distinct patterns of neonatal gut microflora in infants in whom atopy was and was not developing. J. Allergy Clin. Immunol. 2001;107:129–134. doi: 10.1067/mai.2001.111237. - DOI - PubMed
    1. Fujimura K.E., Sitarik A.R., Havstad S., Lin D.L., LeVan S., Fadrosh D., Panzer A.R., LaMere B., Rackaityte E., Lukacs N.W., et al. Neonatal gut microbiota associates with childhood multisensitized atopy and T cell differentiation. Nat. Med. 2016;22:1187–1191. doi: 10.1038/nm.4176. - DOI - PMC - PubMed
    1. Taft D.H., Liu J., Maldonado-Gomez M.X., Akre S., Huda M.N., Ahmad S.M., Stephensen C.B., Mills D.A. Bifidobacterial Dominance of the Gut in Early Life and Acquisition of Antimicrobial Resistance. mSphere. 2018;3:e00441-18. doi: 10.1128/mSphere.00441-18. - DOI - PMC - PubMed
    1. Kalliomäki M., Collado M.C., Salminen S., Isolauri E. Early differences in fecal microbiota composition in children may predict overweight. Am. J. Clin. Nutr. 2008;87:534–538. doi: 10.1093/ajcn/87.3.534. - DOI - PubMed

LinkOut - more resources