

Subsurface Bacterioplankton Structure and Diversity in the Strongly-Stratified Water Columns within the Equatorial Eastern Indian Ocean
- PMID: 36985166
- PMCID: PMC10058062
- DOI: 10.3390/microorganisms11030592
Subsurface Bacterioplankton Structure and Diversity in the Strongly-Stratified Water Columns within the Equatorial Eastern Indian Ocean
Abstract
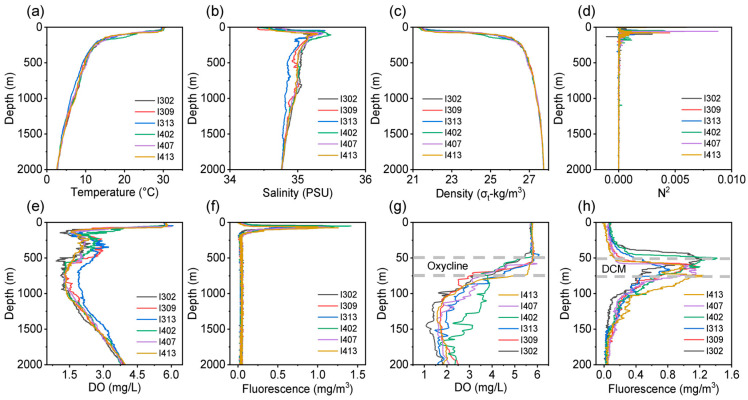
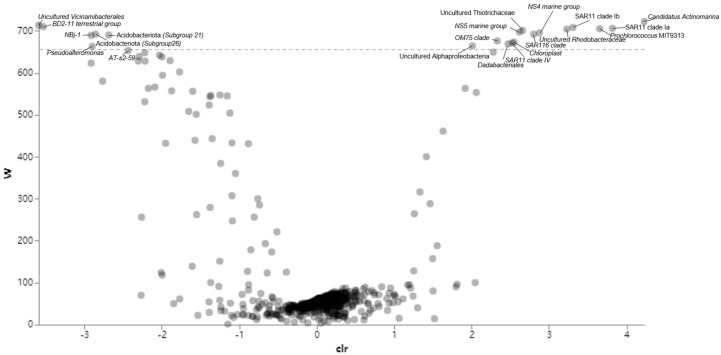
The consequences of climate change may directly or indirectly impact the marine biosphere. Although ocean stratification has been recognized as one of the crucial consequences of ocean warming, its impacts on several critical aspects of marine microbes remain largely unknown in the Indian Ocean. Here, we investigate the effects of water stratification, in both surface and subsurface layers, on hydrogeographic parameters and bacterioplankton diversity within the equatorial eastern Indian Ocean (EIO). Strong stratification in the upper 200 m of equatorial EIO was detected with evidential low primary productivity. The vertical bacterioplankton diversity of the whole water columns displayed noticeable variation, with lower diversity occurring in the surface layer than in the subsurface layers. Horizontal heterogeneity of bacterioplankton communities was also in the well-mixed layer among different stations. SAR11 and Prochlorococcus displayed uncharacteristic low abundance in the surface water. Some amplicon sequence variants (ASVs) were identified as potential biomarkers for their specific depths in strongly-stratified water columns. Thus, barriers resulting from stratification are proposed to function as an 'ASV filter' to regulate the vertical bacterioplankton community diversity along the water columns. Overall, our results suggest that the effects of stratification on the structure and diversity of bacterioplankton can extend up to the bathypelagic zone in the strongly-stratified waters of the equatorial EIO. This study provides the first insight into the effect of stratification on the subsurface microbial communities in the equatorial eastern Indian Ocean.
Keywords: bacteria; barrier layer; composition; eastern Indian Ocean; richness; stratification; temperature.
Conflict of interest statement
The authors declare no conflict of interest. The funders had no role in the design of the study; in the collection, analyses, or interpretation of data; in the writing of the manuscript; or in the decision to publish the results.
Figures


Similar articles
-
The Composition and Primary Metabolic Potential of Microbial Communities Inhabiting the Surface Water in the Equatorial Eastern Indian Ocean.Biology (Basel). 2021 Mar 22;10(3):248. doi: 10.3390/biology10030248. Biology (Basel). 2021. PMID: 33810062 Free PMC article.
-
Water column stratification governs picophytoplankton community structure in the oligotrophic eastern Indian ocean.Mar Environ Res. 2023 Jul;189:106074. doi: 10.1016/j.marenvres.2023.106074. Epub 2023 Jun 26. Mar Environ Res. 2023. PMID: 37393153
-
Heterotrophic Bacteria Dominate the Diazotrophic Community in the Eastern Indian Ocean (EIO) during Pre-Southwest Monsoon.Microb Ecol. 2019 Nov;78(4):804-819. doi: 10.1007/s00248-019-01355-1. Epub 2019 Apr 29. Microb Ecol. 2019. PMID: 31037377
-
Impacts of global warming on marine microbial communities.Sci Total Environ. 2021 Oct 15;791:147905. doi: 10.1016/j.scitotenv.2021.147905. Epub 2021 May 21. Sci Total Environ. 2021. PMID: 34126492 Review.
-
Microbial Diversity in the Indian Ocean Sediments: An Insight into the Distribution and Associated Factors.Curr Microbiol. 2022 Feb 23;79(4):115. doi: 10.1007/s00284-022-02801-z. Curr Microbiol. 2022. PMID: 35195780 Review.
Cited by
-
Marine plankton community and net primary production responding to island-trapped waves in a stratified oligotrophic ecosystem.Heliyon. 2024 Sep 11;10(18):e37788. doi: 10.1016/j.heliyon.2024.e37788. eCollection 2024 Sep 30. Heliyon. 2024. PMID: 39323781 Free PMC article.
-
Particle-Associated Bacterioplankton Communities Across the Red Sea.Environ Microbiol. 2025 Mar;27(3):e70075. doi: 10.1111/1462-2920.70075. Environ Microbiol. 2025. PMID: 40098226 Free PMC article.
References
-
- Laffoley D., Baxter J.M. Explaining Ocean Warming: Causes, Scale, Effects and Consequences. IUCN; Gland, Switzerland: 2016.
-
- Boyd P.W. Beyond ocean acidification. Nat. Geosci. 2011;4:273–274. doi: 10.1038/ngeo1150. - DOI
-
- Boyd P.W., Strzepek R., Fu F., Hutchins D.A. Environmental control of open-ocean phytoplankton groups: Now and in the future. Limnol. Oceanogr. 2010;55:1353–1376. doi: 10.4319/lo.2010.55.3.1353. - DOI
Grants and funding
LinkOut - more resources
Full Text Sources
