. 2023 Mar 16;11(3):768.
doi: 10.3390/microorganisms11030768.

Methylprednisolone Promotes Mycobacterium smegmatis Survival in Macrophages through NF-κB/DUSP1 Pathway

Affiliations

Methylprednisolone Promotes Mycobacterium smegmatis Survival in Macrophages through NF-κB/DUSP1 Pathway

Anlong Li et al. Microorganisms. .

Abstract

Background: Mycobacterium tuberculosis (M. tuberculosis) is the causative agent of tuberculosis. As an important component of host immunity, macrophages are not only the first line of defense against M. tuberculosis but also the parasitic site of M. tuberculosis in the host. Glucocorticoids can cause immunosuppression, which is considered to be one of the major risk factors for active tuberculosis, but the mechanism is unclear.

Objective: To study the effect of methylprednisolone on the proliferation of mycobacteria in macrophages and try to find key molecules of this phenomenon.

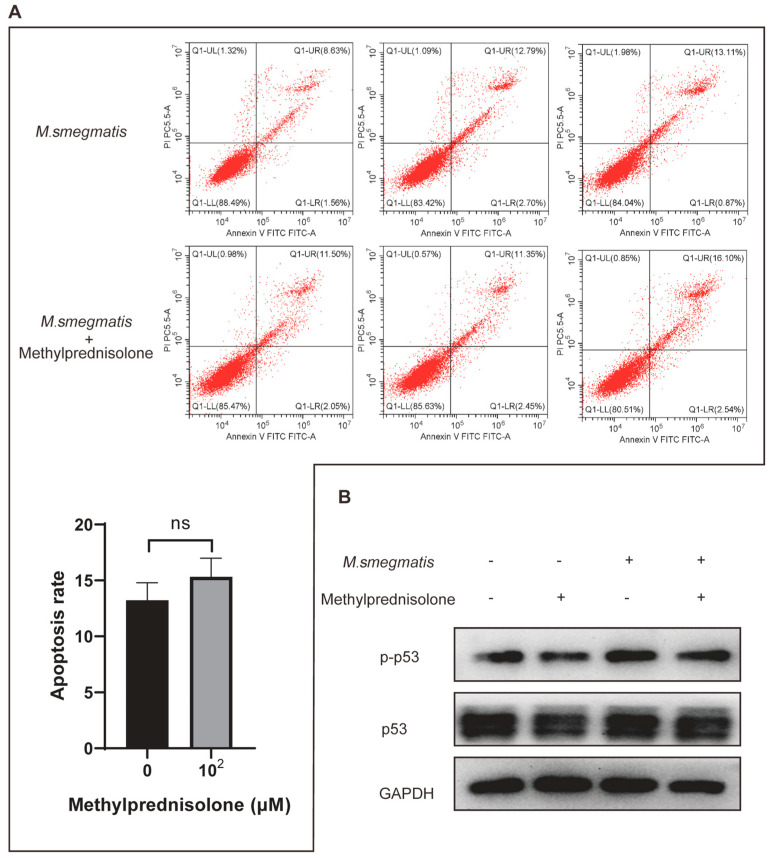
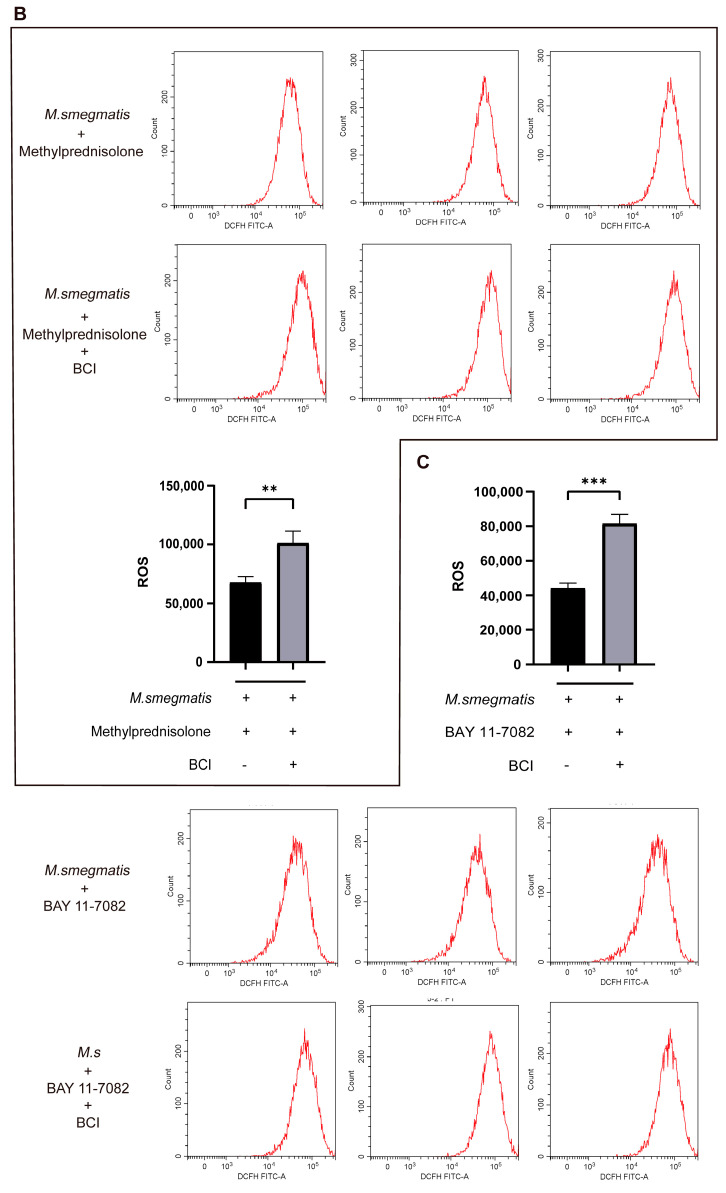
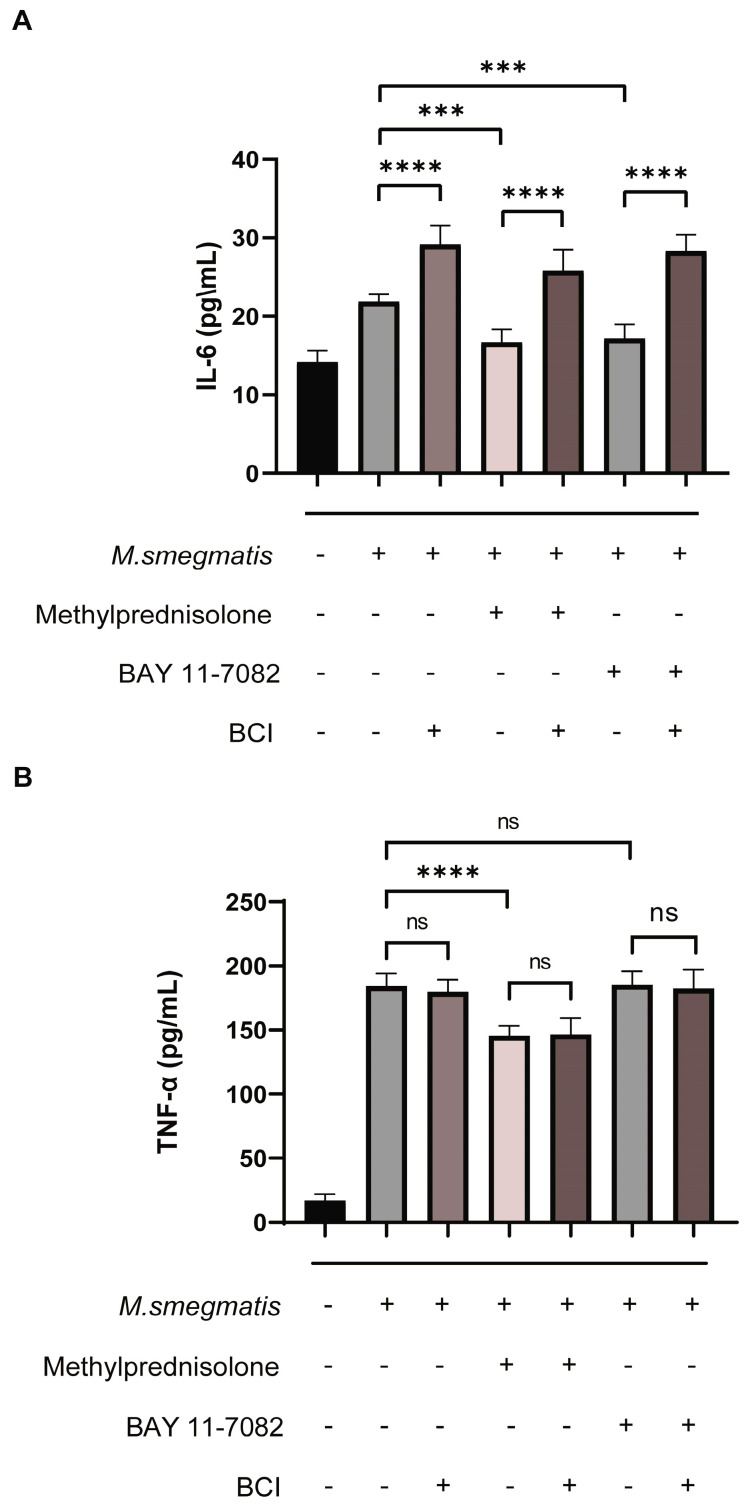
Methods: The macrophage line RAW264.7 infected by M. smegmatis was treated with methylprednisolone, and the intracellular bacterial CFU, Reactive Oxygen Species (ROS), cytokine secretion, autophagy, and apoptosis were measured. After the cells were treated with NF-κB inhibitor BAY 11-7082 and DUSP1 inhibitor BCI, respectively, the intracellular bacterial CFU, ROS, IL-6, and TNF-α secretion were detected.

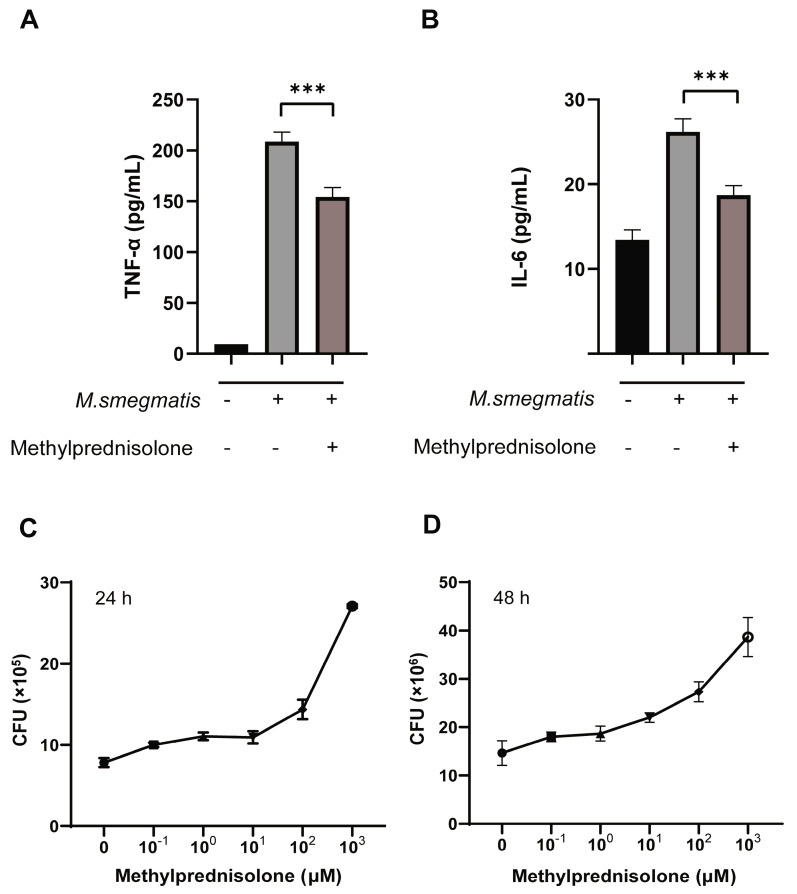
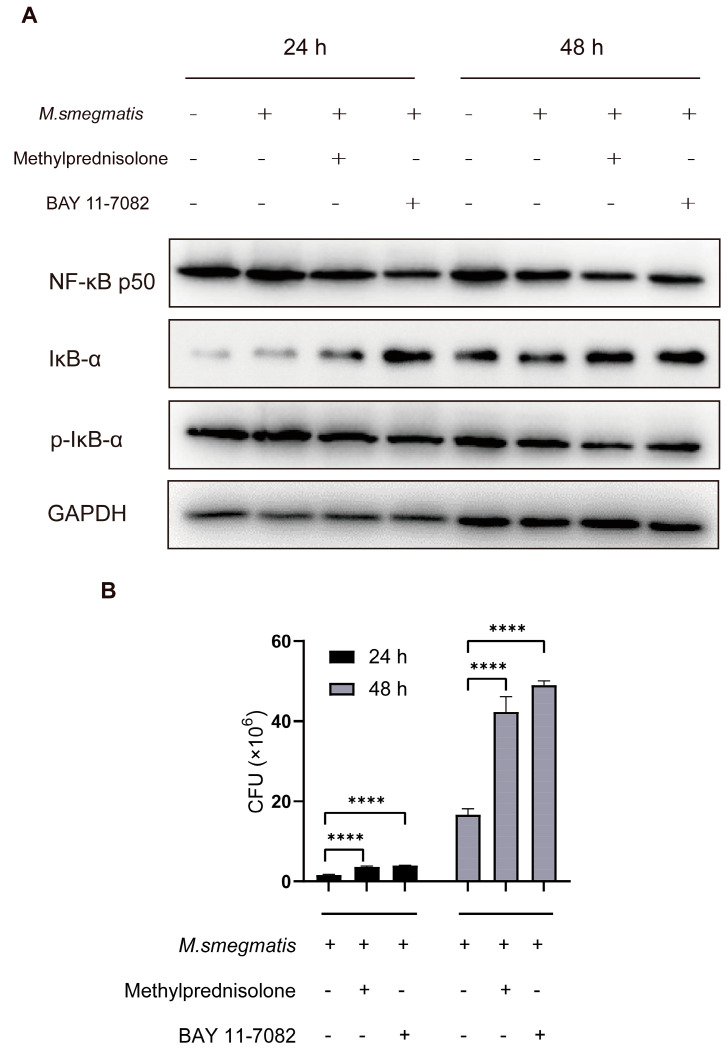
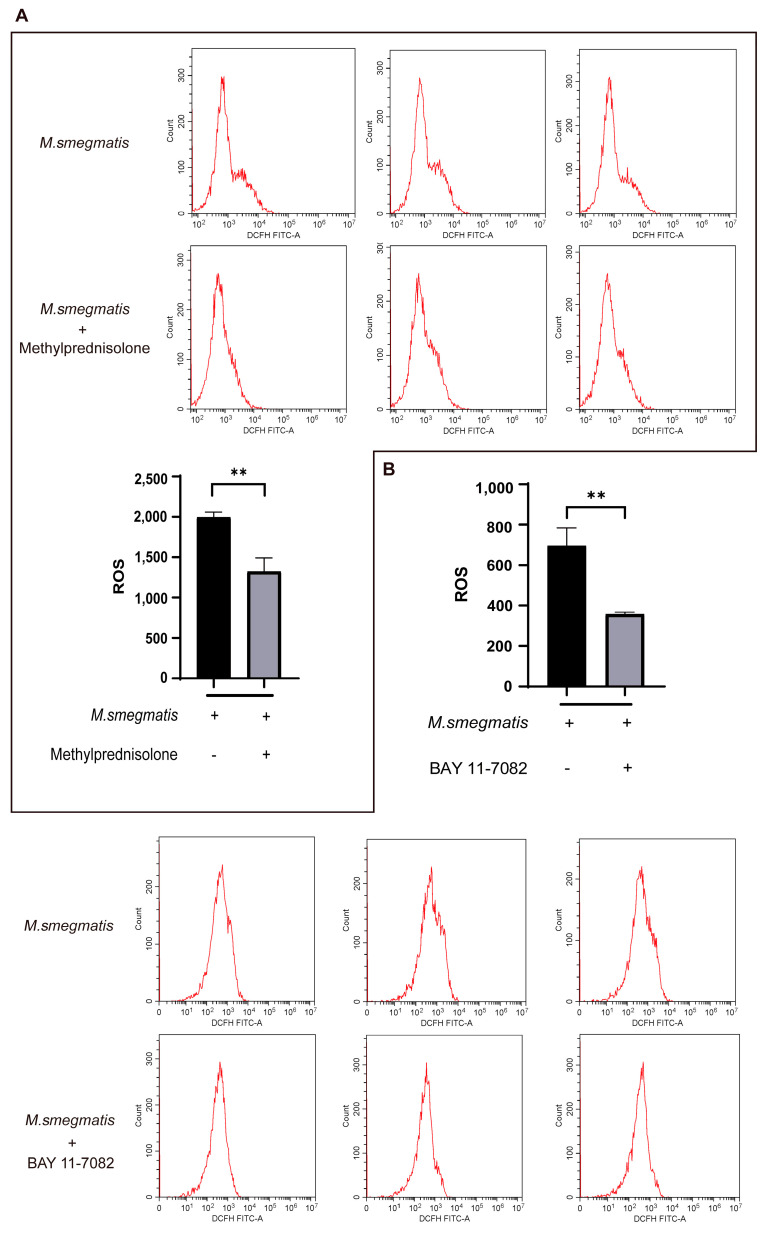
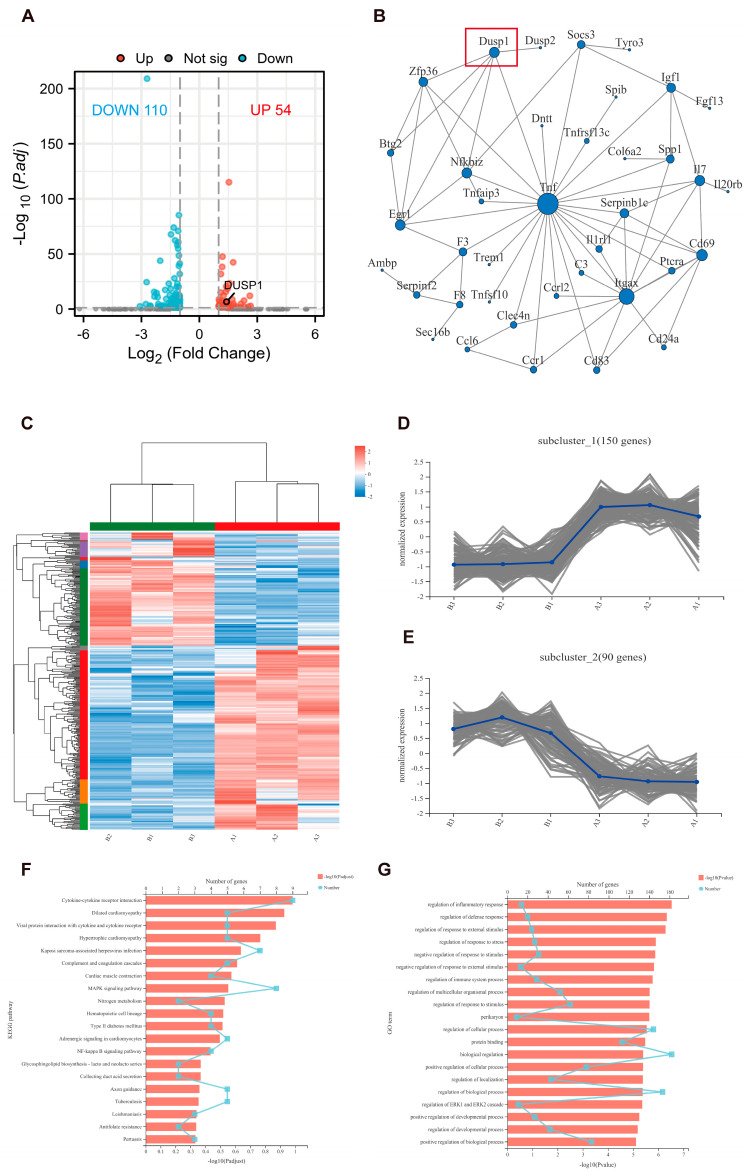
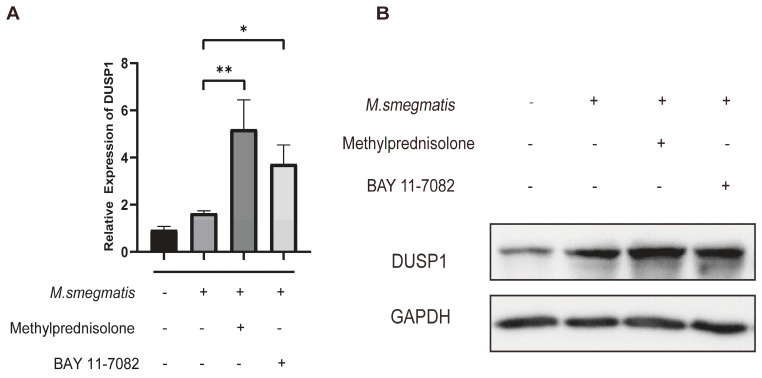
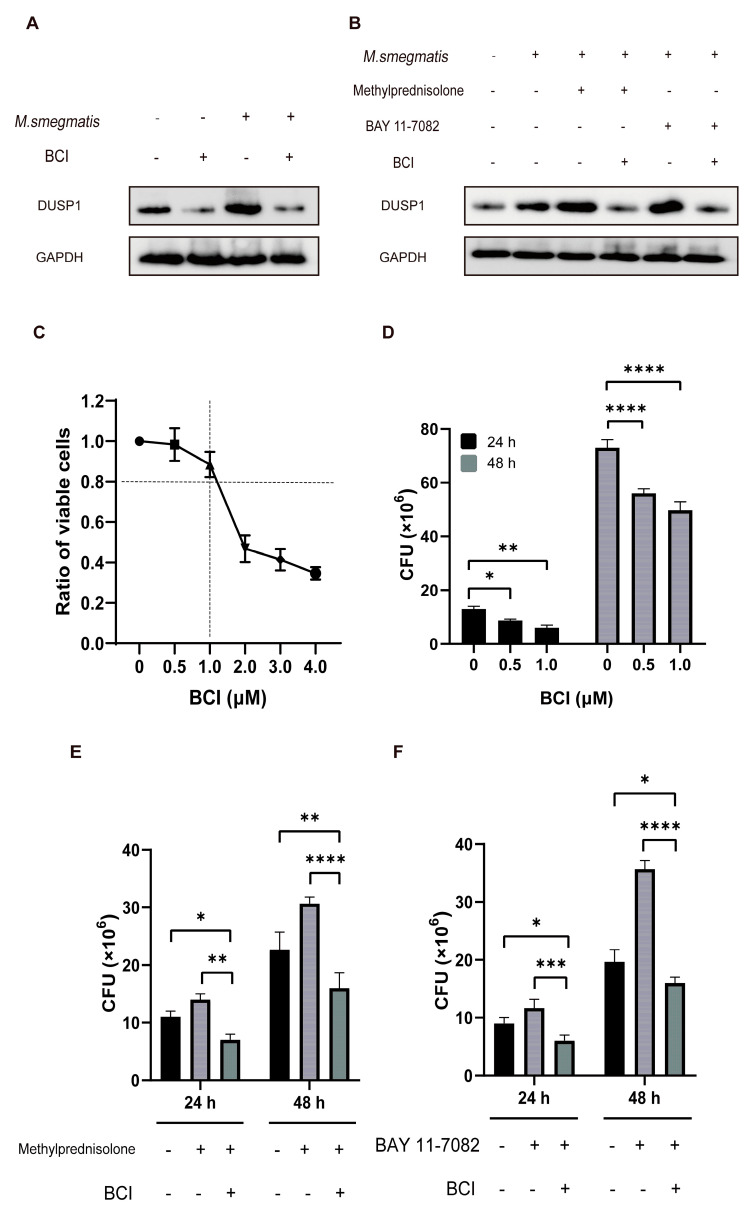
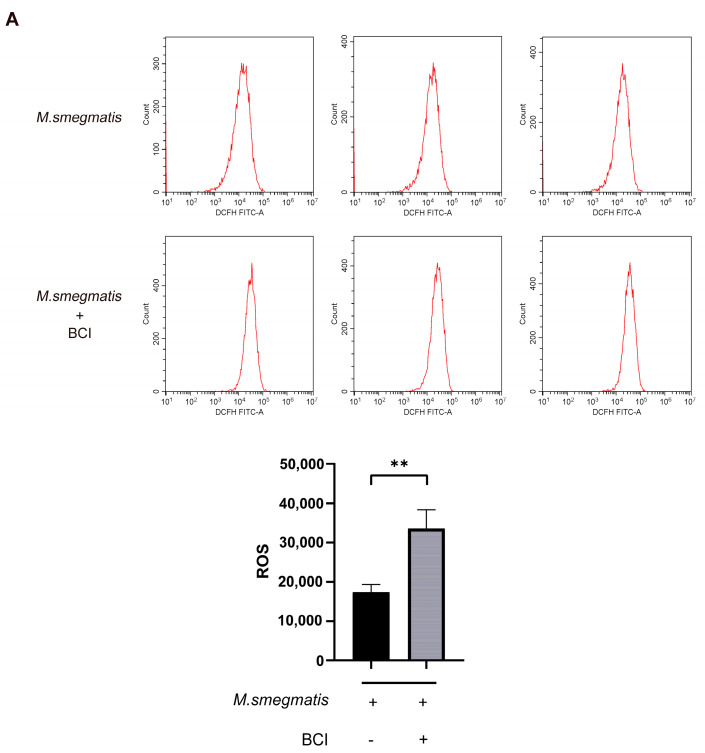
Results: After treatment with methylprednisolone, the CFU of intracellular bacteria increased, the level of ROS decreased, and the secretion of IL-6 and TNF-α decreased in infected macrophages. After BAY 11-7082 treatment, the CFU of M. smegmatis in macrophages increased, and the level of ROS production and the secretion of IL-6 by macrophages decreased. Transcriptome high-throughput sequencing and bioinformatics analysis suggested that DUSP1 was the key molecule in the above phenomenon. Western blot analysis confirmed that the expression level of DUSP1 was increased in the infected macrophages treated with methylprednisolone and BAY 11-7082, respectively. After BCI treatment, the level of ROS produced by infected macrophages increased, and the secretion of IL-6 increased. After the treatment of BCI combined with methylprednisolone or BAY 11-7082, the level of ROS produced and the secretion of IL-6 by macrophages were increased.

Conclusion: methylprednisolone promotes the proliferation of mycobacteria in macrophages by suppressing cellular ROS production and IL-6 secretion through down-regulating NF-κB and up-regulating DUSP1 expression. BCI, an inhibitor of DUSP1, can reduce the level of DUSP1 in the infected macrophages and inhibit the proliferation of intracellular mycobacteria by promoting cellular ROS production and IL-6 secretion. Therefore, BCI may become a new molecule for host-directed therapy of tuberculosis, as well as a new strategy for the prevention of tuberculosis when treated with glucocorticoids.

Keywords: DUSP1; IL-6; NF-κB; ROS; methylprednisolone; mycobacteria.


Conflict of interest statement

The authors declare no conflict of interest.

Figures

Figure 1
Figure 1
(A,B) Methylprednisolone (102 μM) treated M. smegmatis infected RAW264.7 cells for 48 h; the secretion of TNF-α and IL-6; the t-test was used for data analysis; *** p < 0.001. (C,D) Infected RAW264.7 cells were treated with different concentrations of methylprednisolone for 24 and 48 h, and CFU were measured.
Figure 2
Figure 2
(A) Methylprednisolone (102 μM) and the NF-κB inhibitor BAY 11-7082 (2 μM) treated M. smegmatis infected RAW264.7 cells for 24 and 48 h; NF-κB p50, IκB-α, and p-IκB-α levels were detected with Western blot analysis. (B) CFU results of RAW264.7 cells infected with M. smegmatis after treatment with methylprednisolone (102 μM) and NF-κB inhibitor BAY 11-7082 (2 μM) for 24 h and 48 h; the analysis of variance was used for data analysis; **** p < 0.0001.
Figure 3
Figure 3
Methylprednisolone (102 μM) treated M. smegmatis infected RAW264.7 cells for 48 h; (A) apoptotic cells were detected by flow cytometry; the t-test was used for data analysis; ns no statistical differences. (B) Apoptosis-related protein p53 and p-p53 level were detected with Western blot analysis.
Figure 4
Figure 4
(A) Methylprednisolone (102 μM) treated M. smegmatis infected RAW264.7 cells for 48 h; flow cytometry was used to detect the level of cellular ROS production; the t-test was used for data analysis; ** p < 0.01. (B) BAY 11-7082 (2 μM) treated M. smegmatis infected RAW264.7 cells for 48 h; flow cytometry was used to detect the level of cellular ROS production; the t-test was used for data analysis; ** p < 0.01.
Figure 5
Figure 5
M. smegmatis infected RAW264.7 cells treated with BAY 11-7082 for 24 h. Transcriptome high-throughput sequencing analysis was performed. (A) Volcano diagram: based on the quantitative results of expression, the DEGs between the two groups were obtained. The blue was the lowly expressed genes in the treatment group, and the red was the highly expressed genes in the treatment group. (B) The PPI network: according to the comprehensive score greater than 0.4, the top 100 differentially expressed genes were screened, and discrete gene nodes were deleted to obtain PPI network. (C) Heat map: each column represents a sample (B1, B2, and B3 are BAY 11-7082 treated groups, and A1, A2, and A3 are control groups), each row represents a gene, and the color in the figure indicates the expression level of the gene/transcript in the sample; red represents the higher expression level of the gene/transcript in the sample, and the blue represents the lower expression level. The left side shows the gene/transcript clustering dendrogram, where the closer the two gene/transcript clades are, the closer their expression levels are. (D,E) Subcluster trend graph: he abscissa is the samples name (B1, B2, and B3 are the BAY 11-7082 treatment group, and A1, A2, and A3 are the control group), and the ordinate is the gene expression level in the samples, each line in the graph represents a gene change trend, and the blue line represents the change trend of the average expression of all gene transcripts. (F) Based on KEGG database, gene function enrichment analysis was performed; the lower abscissa represents log10 (p value), and the upper abscissa represents the number of enriched genes. (G) Based on GO database, gene function enrichment analysis was performed; the lower abscissa represents log10 (p value), and the upper abscissa represents the number of enriched genes.
Figure 6
Figure 6
Methylprednisolone (102 μM) treated M. smegmatis infected RAW264.7 cells for 48 h, cellular Total-RNA was verified by qRT-PCR, and total protein was extracted for Western blot analysis. (A) Relative expression of DUSP1 was detected with qRT-PCR, and the analysis of variance was used for data analysis; * p < 0.05; ** p < 0.01. (B) DUSP1 levels were detected with Western blot analysis.
Figure 7
Figure 7
(A) After treatment of 48 h, DUSP1 levels were detected with Western blot analysis, cellular DUSP1 levels could be decreased by BCI (1 μM) treatment, (B) and BCI (1 μM) could reduce the level of DUSP1 elevated by methylprednisolone and BAY11-7082. (C) RAW264.7 cells were treated with different concentrations of BCI (0, 0.5, 1, 2, 3, 4 μM) for 48 h, and the cell viability was determined by the CCK-8 method. (D) RAW264.7 cells infected with M. smegmatis were treated with different concentrations of BCI (0, 0.5, 1 μM) for 24 and 48 h, and the number of intracellular M. smegmatis was measured; the analysis of variance was used for data analysis; * p < 0.05; ** p < 0.01; **** p < 0.0001. (E) RAW264.7 cells infected with M. smegmatis were treated with methylprednisolone (102 μM) and BCI (1 μM) for 24 and 48 h, and the number of intracellular M. smegmatis was measured; the analysis of variance was used for data analysis; * p < 0.05; ** p < 0.01; **** p < 0.0001. (F) RAW264.7 cells infected with M. smegmatis were treated with BAY 11-7082 (2 μM) and BCI (1 μM) for 24 and 48 h, and the number of intracellular M. smegmatis was measured; the analysis of variance was used for data analysis; * p < 0.05; *** p < 0.001; **** p < 0.0001.
Figure 8
Figure 8
(A) BCI (1 μM) treated M. smegmatis infected RAW264.7 cells for 48 h; flow cytometry was used to detect the level of cellular ROS production; the t-test was used for data analysis; ** p < 0.01. (B) Methylprednisolone (102 μM) and BCI (1 μM) treated M. smegmatis infected RAW264.7 cells for 48 h; flow cytometry was used to detect the level of cellular ROS production; the t-test was used for data analysis; ** p < 0.01. (C) BAY 11-7082 (2 μM) and BCI (1 μM) treated M. smegmatis infected RAW264.7 cells for 48 h; flow cytometry was used to detect the level of cellular ROS production; the t-test was used for data analysis; *** p < 0.001.
Figure 8
Figure 8
(A) BCI (1 μM) treated M. smegmatis infected RAW264.7 cells for 48 h; flow cytometry was used to detect the level of cellular ROS production; the t-test was used for data analysis; ** p < 0.01. (B) Methylprednisolone (102 μM) and BCI (1 μM) treated M. smegmatis infected RAW264.7 cells for 48 h; flow cytometry was used to detect the level of cellular ROS production; the t-test was used for data analysis; ** p < 0.01. (C) BAY 11-7082 (2 μM) and BCI (1 μM) treated M. smegmatis infected RAW264.7 cells for 48 h; flow cytometry was used to detect the level of cellular ROS production; the t-test was used for data analysis; *** p < 0.001.
Figure 9
Figure 9
RAW264.7 cells infected with M. smegmatis were treated with methylprednisolone (102 μM), BAY 11-7082 (2 μM), and BCI (1 μM) for 48 h, and the cell supernatant was collected for enzyme linked immunosorbent assay. (A) IL-6 secretion level, (B) TNF-α secretion level. The analysis of variance was used for data analysis, *** p < 0.001, **** p < 0.0001, ns no statistical differences.

Similar articles

Cited by

References

    1. World Health Organization Global Tuberculosis Report 2021. 2021. [(accessed on 1 December 2022)]. Available online: https://www.who.int/publications/i/item/9789240037021.
    1. World Health Organization Global Tuberculosis Report 2015. 2015. [(accessed on 1 December 2022)]. Available online: https://apps.who.int/iris/bitstream/handle/10665/191102/9789241565059_en....
    1. Getahun H., Matteelli A., Abubakar I., Aziz M., Baddeley A., Barreira D., Den Boon S., Borroto Gutierrez S., Bruchfeld J., Burhan E., et al. Management of latent Mycobacterium tuberculosis infection: WHO guidelines for low tuberculosis burden countries. Eur. Respir. J. 2015;46:1563–1576. doi: 10.1183/13993003.01245-2015. - DOI - PMC - PubMed
    1. Shea K., Kammerer J., Winston C., Navin T., Horsburgh C. Estimated rate of reactivation of latent tuberculosis infection in the United States, overall and by population subgroup. Am. J. Epidemiol. 2014;179:216–225. doi: 10.1093/aje/kwt246. - DOI - PMC - PubMed
    1. Selmi C., Generali E., Massarotti M., Bianchi G., Sciré C. New treatments for inflammatory rheumatic disease. Immunol. Res. 2014;60:277–288. doi: 10.1007/s12026-014-8565-5. - DOI - PubMed