. 2023 Mar 9;28(6):2521.
doi: 10.3390/molecules28062521.

Organic Anion Transporting Polypeptide 3A1 (OATP3A1)-Gated Bio-Orthogonal Labeling of Intracellular Proteins

Affiliations

Organic Anion Transporting Polypeptide 3A1 (OATP3A1)-Gated Bio-Orthogonal Labeling of Intracellular Proteins

Krisztina Németh et al. Molecules. .

Abstract

Organic anion transporting polypeptides (OATPs) were found to readily deliver membrane impermeable, tetrazine bearing fluorescent probes into cells. This feature was explored in OATP3A1 conditioned bio-orthogonal labeling schemes of various intracellular proteins in live cells. Confocal microscopy and super-resolution microscopy (STED) studies have shown that highly specific and efficient staining of the selected intracellular proteins can be achieved with the otherwise non-permeable probes when OATP3A1 is present in the cell membrane of cells. Such a transport protein linked bio-orthogonal labeling scheme is believed to be useful in OATP3A1 activity-controlled protein expression studies in the future.

Keywords: cell permeability; confocal microscopy; flow cytometry; intracellular labeling; large Stokes shift fluorescent probes; live cell bio-orthogonal modification; organic anion transporter polypeptide 3A1; self-labeling enzyme tags; super-resolution microscopy.


Conflict of interest statement

The authors declare no conflict of interest.

Figures

Figure 1
Figure 1
Structures, excitation and fluorescence spectra of dyes CBRD2-BAT and CBRD4-BAT and wavelength of the excitation and depletion lasers (green and red lines, respectively).
Figure 2
Figure 2
Influx ratio of dyes CBRD2-BAT (10 µM) and CBRD4-BAT (10 µM) in Uptake pH 5.5 (A) Uptake pH 7.4 (B) and in complete DMEM (C) into HEK-293-OATP3A1 compared to mock cells. Influx was determined as (mean RFU–relative fluorescence unit) with flow cytometry and inhibited with benzbromarone (BB) at 20 µM and 80 µM concentrations in Uptake buffer and DMEM medium, respectively. Significance of differences was estimated by t-test, **** <0.001; *** 0.004.
Figure 3
Figure 3
Confocal microscopy images of LaminA-HaloTag expressing OATP3A1 positive and negative (mock) cells pretreated with HaloBCN (3 µM, 60 min) and treated with non-permeable fluorescent dyes CBRD2-BAT (3 µM, 30 min) and CBRD4-BAT (10 µM, 30 min) in complete DMEM medium. Fluorescent labeling with membrane-permeable SiR-Tet (magenta) serves as positive control of transfection. Scale bar: 20 µm; Spectral detection: (SiR-Tet); λexc: 638 nm/λem: 650–800 nm; dyes CBRD2-BAT and CBRD4-BAT: λexc: 552 nm/λem: 565–800 nm. Objective: 40×.
Figure 4
Figure 4
Confocal microscopy images of H2B-, Vimentin-, Lamp1-, TOMM20-HaloTag expressing HEK-293-OATP3A1 cells pretreated with HaloBCN (3 µM, 60 min) and treated with non-permeable fluorescent dyes CBRD2-BAT (3 µM, 30 min) and CBRD4-BAT (10 µM, 30 min) (cyan) in complete DMEM medium (for images of mock cells cf SI Figures S6–S9). Scale bar: 20 µm; Spectral detection: CBRD2-BAT and CBRD4-BAT; λexc: 552 nm/λem: 565–800 nm. Objective: 100×.
Figure 5
Figure 5
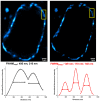
Confocal (left) and super-resolution (STED) (right) microscopy images of Lamin-HaloTag expressing HEK-293-OATP3A1 cells pretreated with HaloBCN (3 µM, 60 min) and treated with non-permeable fluorescent dye CBRD4-BAT (10 µM, 30 min) (cyan) in complete DMEM medium. Scale bar: 1 µm; Spectral detection: CBRD4-BAT; λexc: 552 nm/λem: 565–800 nm; depletion laser: 660 nm; Objective: 100×. Line diagram of the indicated area is characterized with full width at half maxima values (FWHM).

Similar articles

References

    1. Liu J., Cui Z. Fluorescent Labeling of Proteins of Interest in Live Cells: Beyond Fluorescent Proteins. Bioconj. Chem. 2020;31:1587–1595. doi: 10.1021/acs.bioconjchem.0c00181. - DOI - PubMed
    1. Specht E.A., Braselmann E., Palmer A.E. A Critical and Comparative Review of Fluorescent Tools for Live-Cell Imaging. Annu. Rev. Physiol. 2017;79:93–117. doi: 10.1146/annurev-physiol-022516-034055. - DOI - PubMed
    1. Bayguinov P.O., Oakley D.M., Shih C.C., Geanon D.J., Joens M.S., Fitzpatrick J.A.J. Modern Laser Scanning Confocal Microscopy. Curr. Protoc. Cytom. 2018;85:e39. doi: 10.1002/cpcy.39. - DOI - PubMed
    1. Li C., Tebo A.G., Gautier A. Fluorogenic Labeling Strategies for Biological Imaging. Int. J. Mol. Sci. 2017;18:1473. doi: 10.3390/ijms18071473. - DOI - PMC - PubMed
    1. Zhang G., Zhen S., Liu H., Chen P.R. Illuminating biological processes through site-specific protein labeling. Chem. Soc. Rev. 2015;44:3405–3417. doi: 10.1039/C4CS00393D. - DOI - PubMed

MeSH terms

LinkOut - more resources