. 2023 Mar 17;13(6):1090.
doi: 10.3390/nano13061090.

Microwave Synthesis of Visible-Light-Activated g-C3N4/TiO2 Photocatalysts

Affiliations

Microwave Synthesis of Visible-Light-Activated g-C3N4/TiO2 Photocatalysts

Maria Leonor Matias et al. Nanomaterials (Basel). .

Abstract

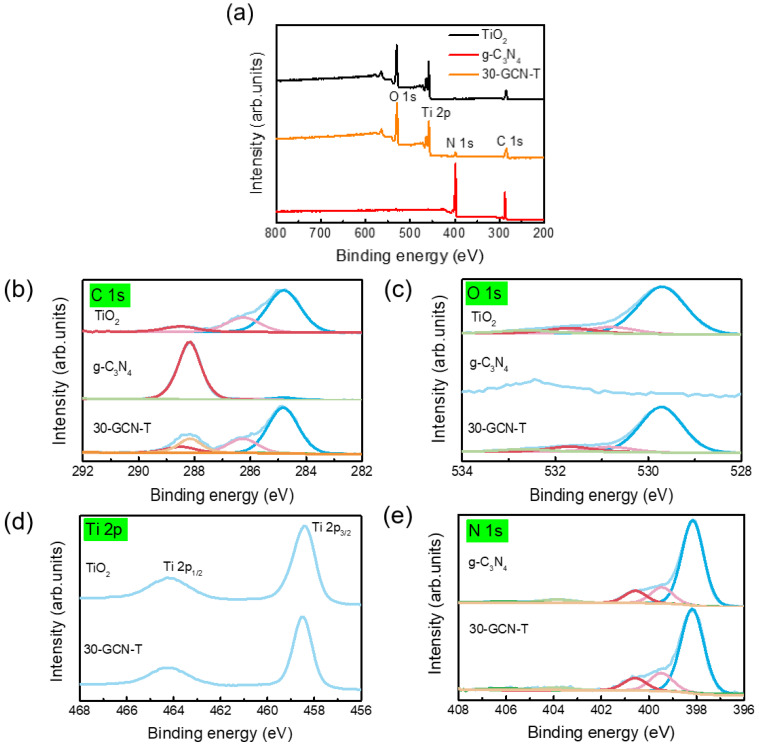
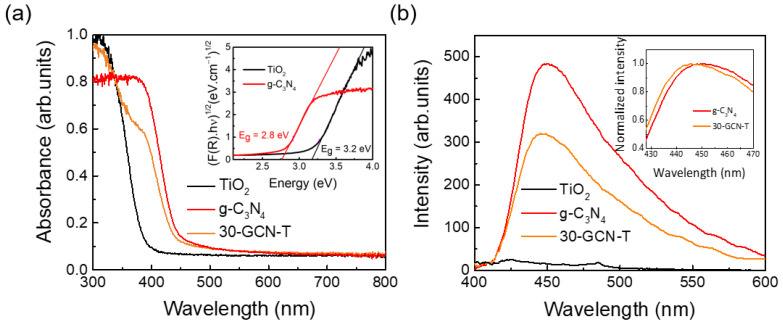
The preparation of visible-light-driven photocatalysts has become highly appealing for environmental remediation through simple, fast and green chemical methods. The current study reports the synthesis and characterization of graphitic carbon nitride/titanium dioxide (g-C3N4/TiO2) heterostructures through a fast (1 h) and simple microwave-assisted approach. Different g-C3N4 amounts mixed with TiO2 (15, 30 and 45 wt. %) were investigated for the photocatalytic degradation of a recalcitrant azo dye (methyl orange (MO)) under solar simulating light. X-ray diffraction (XRD) revealed the anatase TiO2 phase for the pure material and all heterostructures produced. Scanning electron microscopy (SEM) showed that by increasing the amount of g-C3N4 in the synthesis, large TiO2 aggregates composed of irregularly shaped particles were disintegrated and resulted in smaller ones, composing a film that covered the g-C3N4 nanosheets. Scanning transmission electron microscopy (STEM) analyses confirmed the existence of an effective interface between a g-C3N4 nanosheet and a TiO2 nanocrystal. X-ray photoelectron spectroscopy (XPS) evidenced no chemical alterations to both g-C3N4 and TiO2 at the heterostructure. The visible-light absorption shift was indicated by the red shift in the absorption onset through the ultraviolet-visible (UV-VIS) absorption spectra. The 30 wt. % of g-C3N4/TiO2 heterostructure showed the best photocatalytic performance, with a MO dye degradation of 85% in 4 h, corresponding to an enhanced efficiency of almost 2 and 10 times greater than that of pure TiO2 and g-C3N4 nanosheets, respectively. Superoxide radical species were found to be the most active radical species in the MO photodegradation process. The creation of a type-II heterostructure is highly suggested due to the negligible participation of hydroxyl radical species in the photodegradation process. The superior photocatalytic activity was attributed to the synergy of g-C3N4 and TiO2 materials.

Keywords: g-C3N4/TiO2; heterostructures; microwave synthesis; photocatalysis; pollutant degradation.


Conflict of interest statement

The authors declare no conflict of interest.

Figures

Figure 1
Figure 1
Schematic diagram for the microwave synthesis of g-C3N4/TiO2 heterostructures. The schematic in the orange box represents the first steps for the synthesis of g-C3N4/TiO2 heterostructures, while the schematic in the green box represents the last steps for the synthesis of g-C3N4/TiO2 heterostructures.
Figure 2
Figure 2
XRD diffractograms of the pure TiO2, pure g-C3N4 and heterostructures composed of TiO2 with different weight loading percentages of g-C3N4 (15-GCN-T, 30-GCN-T and 45-GCN-T). The simulated brookite, rutile and anatase TiO2 are also shown for comparison. Orange arrows indicate the diffraction maximum at 27º likely associated with the presence of graphitic carbon nitride.
Figure 3
Figure 3
SEM images of the produced materials (a) TiO2, (c) g-C3N4, (e) 15-GCN-T, (g) 30-GCT and (i) 45-GCN-T. The respective high-magnification SEM images are shown in (b,d,f,h,j). (b) also displays an amplified SEM image of a hollow TiO2 sphere.
Figure 4
Figure 4
(a) Secondary electron (SE) STEM image of the 30-GCN-T material, (b) Bright-field (BF) STEM image of the same area of (a), (c) HAADF-STEM image of the area in (a,d) Bright-field TEM image of the area in (a). The insets in (d) depict the electron diffraction pattern of TiO2 nanoparticles with the anatase phase and the particle size distribution of the TiO2 nanoparticles measured by TEM analyses. (e,f) Magnified SE-STEM and HAADF-STEM images of the area analyzed in (a), respectively. (g) SE-STEM and (h) HAADF-STEM image of a TiO2 nanocrystal attached to the g-C3N4 sheet, and (i) atomic-resolution HAADF-STEM image of the area in (g,h), where the interface between the TiO2 nanocrystal and the g-C3N4 sheet is clear. The inset in (i) shows the FFT image of the area indicated as A (white square).
Figure 5
Figure 5
(a,b) Atomic-resolution HAADF-STEM images of two distinct TiO2 nanocrystals. The insets in (a,b) show the FFT images of areas indicated as B and C, respectively (black squares).
Figure 6
Figure 6
Artificially colored (mixed) SE-STEM image of the 30-GCN-T material (a), together with the corresponding EDS maps of C (b), N (c), O (d) and Ti (e).
Figure 7
Figure 7
(a) AFM image of a g-C3N4 nanosheet and (b) corresponding average height values measured between the red lines.
Figure 8
Figure 8
(a) XPS survey spectra of TiO2, g-C3N4 and 30-GCN-T materials. (b) Deconvolution of XPS C 1s of TiO2, g-C3N4 and 30-GCN-T spectra. (c) Deconvolution of XPS O 1s spectra of TiO2, g-C3N4 and 30-GCN-T. (d) XPS Ti 2p spectra of TiO2 and 30-GCN-T. (e) Deconvolution of XPS N 1s spectra of g-C3N4 and 30-GCN-T.
Figure 9
Figure 9
(a) RT absorption spectra of TiO2, g-C3N4 and 30-GCN-T nanopowders. The inset shows the Kubelka–Munk plots (from DRS spectra of TiO2 and g-C3N4 nanopowders). For the determination of the optical band gap values, TiO2 and g-C3N4 materials were considered as indirect band gap semiconductors. (b) RT PL spectra of TiO2, g-C3N4 and 30-GCN-T nanostructures from 400 to 600 nm using an excitation wavelength of 350 nm. The inset shows the RT PL spectra (normalized intensity as a function of the wavelength from 428 to 470 nm) of g-C3N4 and 30-GCN-T nanostructures.
Figure 10
Figure 10
(a) Degradation curves (C/C0 as a function of the exposure time) under solar simulating light up to 4 h without photocatalyst (photolysis) and for TiO2, g-C3N4, 15-GCN-T, 30-GCN-T,45-GCN-T photocatalysts. The lines are for eye guidance only. (b) Pseudo-first-order kinetics for MO degradation in the presence of TiO2, g-C3N4, 15-GCN-T, 30-GCN-T and 45-GCN-T photocatalysts. The lines represent the linear fittings of the pseudo-first-order kinetics equation.
Figure 11
Figure 11
(a) MO degradation curves (C/C0 as a function of the exposure time) in the presence of 30-GCN-T heterostructures up to 4 h under five consecutive cycles. The lines are for eye guidance only. (b) Comparison of the degradation rates of MO under solar simulating light using the 30-GCN-T heterostructure with no scavengers (NS) and 5 mL of water, and in the presence of trapping reagents (EDTA, BQ and IPA).
Figure 12
Figure 12
Mott–Schottky analyses performed at 1 kHz in 0.5 M Na2SO4 electrolyte for TiO2 and g-C3N4. The potentials were measured against the Ag/AgCl reference. The flat band potentials (Efb) can be estimated from the linear portion of the graphs, represented in black and red lines, respectively, for TiO2 and g-C3N4.
Figure 13
Figure 13
Illustrated mechanism of the photocatalytic activity of the 30-GCN-T heterostructure under solar simulating light. The potentials (V) relative to NHE scale are also represented. Black and red dashed lines correspond to the CB/VB potentials of TiO2 and g-C3N4, respectively. Purple dot lines are related to the redox potentials of the common reactive species in photocatalysis. (a) represents a possible Z-scheme photocatalytic degradation mechanism of the 30-GCN-T heterostructure, and (b) represents a possible type-II photocatalytic degradation mechanism of the 30-GCN-T heterostructure.

References

    1. Samsami S., Mohamadi M., Sarrafzadeh M.H., Rene E.R., Firoozbahr M. Recent advances in the treatment of dye-containing wastewater from textile industries: Overview and perspectives. Process Saf. Environ. Prot. 2020;143:138–163. doi: 10.1016/j.psep.2020.05.034. - DOI
    1. Ju L., Tang X., Li X., Liu B., Qiao X., Wang Z., Yin H. NO2 Physical-to-Chemical Adsorption Transition on Janus WSSe Monolayers Realized by Defect Introduction. Molecules. 2023;28:1644. doi: 10.3390/molecules28041644. - DOI - PMC - PubMed
    1. Nan Chong M., Jin B., Chow C.W., Saint C. Recent developments in photocatalytic water treatment technology: A review. Water Res. 2010;44:2997–3027. doi: 10.1016/j.watres.2010.02.039. - DOI - PubMed
    1. Al-Tohamy R., Ali S.S., Li F., Okasha K.M., Mahmoud Y.A.G., Elsamahy T., Jiao H., Fu Y., Sun J. A critical review on the treatment of dye-containing wastewater: Ecotoxicological and health concerns of textile dyes and possible remediation approaches for environmental safety. Ecotoxicol. Environ. Saf. 2022;231:113160. doi: 10.1016/j.ecoenv.2021.113160. - DOI - PubMed
    1. Aich V., Ehlert K., editors. Global Water Partnership and World Meteorological Organization. WMO; Geneva, Switzerland: 2022. Drought and Water Scarcity; pp. 1–24.

LinkOut - more resources