. 2023 Mar 20;12(6):1379.
doi: 10.3390/plants12061379.

The Protective Effect of Exogenous Ascorbic Acid on Photosystem Inhibition of Tomato Seedlings Induced by Salt Stress

Affiliations

The Protective Effect of Exogenous Ascorbic Acid on Photosystem Inhibition of Tomato Seedlings Induced by Salt Stress

Xianjun Chen et al. Plants (Basel). .

Abstract

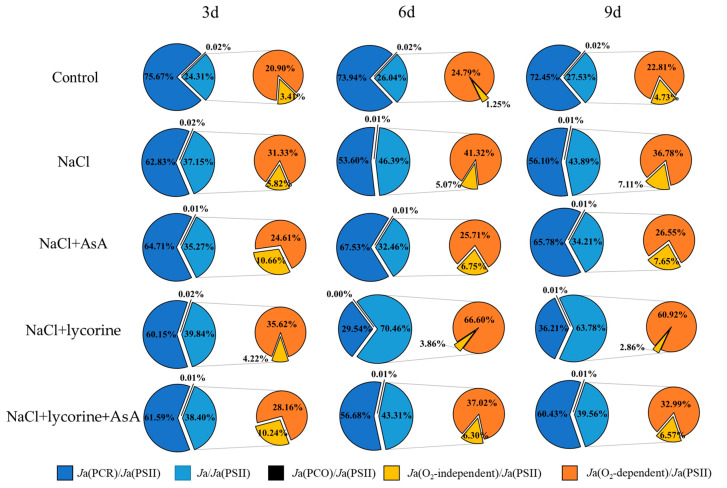
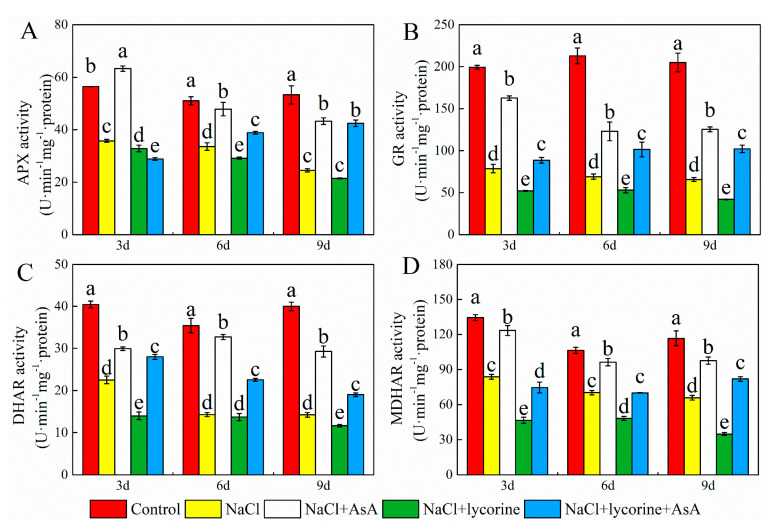
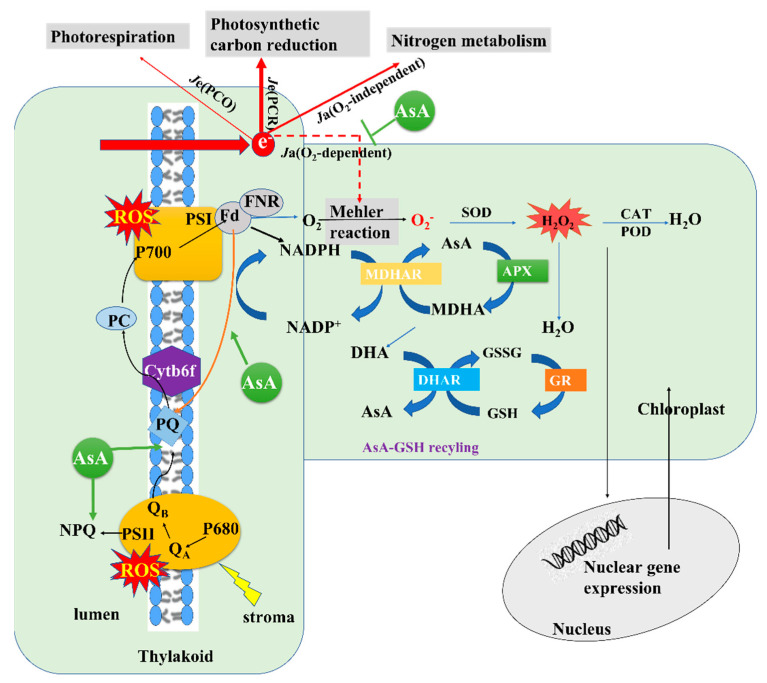
This study investigated the protective effects of exogenous ascorbic acid (AsA, 0.5 mmol·L-1) treatment on salt-induced photosystem inhibition in tomato seedlings under salt stress (NaCl, 100 mmol·L-1) conditions with and without the AsA inhibitor lycorine. Salt stress reduced the activities of photosystem II (PSII) and PSI. AsA treatment mitigated inhibition of the maximal photochemical efficiency of PSII (Fv/Fm), maximal P700 changes (Pm), the effective quantum yields of PSII and I [Y(II) and Y(I)], and non-photochemical quenching coefficient (NPQ) values under salt stress conditions both with and without lycorine. Moreover, AsA restored the balance of excitation energy between two photosystems (β/α-1) after disruption by salt stress, with or without lycorine. Treatment of the leaves of salt-stressed plants with AsA with or without lycorine increased the proportion of electron flux for photosynthetic carbon reduction [Je(PCR)] while decreasing the O2-dependent alternative electron flux [Ja(O2-dependent)]. AsA with or without lycorine further resulted in increases in the quantum yield of cyclic electron flow (CEF) around PSI [Y(CEF)] while increasing the expression of antioxidant and AsA-GSH cycle-related genes and elevating the ratio of reduced glutathione/oxidized glutathione (GSH/GSSG). Similarly, AsA treatment significantly decreased the levels of reactive oxygen species [superoxide anion (O2-) and hydrogen peroxide (H2O2)] in these plants. Together, these data indicate that AsA can alleviate salt-stress-induced inhibition of PSII and PSI in tomato seedlings by restoring the excitation energy balance between the photosystems, regulating the dissipation of excess light energy by CEF and NPQ, increasing photosynthetic electron flux, and enhancing the scavenging of reactive oxygen species, thereby enabling plants to better tolerate salt stress.

Keywords: ascorbic acid; photoprotection; photosystem inhibition; salt stress; tomato.


Conflict of interest statement

The authors declare that they have no conflict of interest.

Figures

Figure 1
Figure 1
Values of the maximal photochemical efficiency of PSII (Fv/Fm) (A), false-color images of Fv/Fm (B), maximal P700 changes (Pm) (C), non-photochemical quenching coefficient (NPQ) (D), photochemical quenching coefficient (qP) (E), and PSII excitation pressure (1–qP) (F) in leaves of salt-stressed tomato seedlings with or without exogenous reduced ascorbic acid (AsA) and lycorine (AsA synthesis inhibitor) spraying. Abbreviations 3d, 6d, and 9d represent the third, sixth, and ninth day after treatment, respectively. Control, no added NaCl and sprayed with distilled water; NaCl, added 100 mmol·L–1 NaCl and sprayed with distilled water; NaCl + AsA, added 100 mmol·L–1 NaCl and sprayed with 0.5 mmol·L–1 AsA; NaCl + lycorine, added 100 mmol·L–1 NaCl and sprayed with 0.25 mmol·L–1 lycorine; NaCl + lycorine + AsA, added 100 mmol·L–1 NaCl and sprayed with 0.25 mmol·L–1 lycorine plus 0.5 mmol·L–1 AsA. Values are means ± SD (n = 3). Values with a different letter within a sampling date are significantly different (p < 0.05).
Figure 2
Figure 2
Values of the effective quantum yield of PSI (Y(I)) (A), effective quantum yield of PSII (Y(II)) (B), false-color images of Y(II) (C), fraction of over P700 that is oxidized in a given state (Y(ND)) (D), the quantum yield of regulated non-photochemical energy dissipation of PSII (Y(NPQ)) (E), false-color images of Y (NPQ) (F), fraction of over P700 that cannot be oxidized in a given state (Y(NA)) (G), the quantum yield of non-regulated energy dissipation of PSII (Y(NO)) (H), and false-color images of Y(NO) (I) in leaves of salt-stressed tomato seedlings with or without exogenous reduced ascorbic acid (AsA) and lycorine (AsA synthesis inhibitor) spraying. Abbreviations 3d, 6d, and 9d represent the third, sixth, and ninth day after treatment, respectively. Control, no added NaCl and sprayed with distilled water; NaCl, added 100 mmol·L–1 NaCl and sprayed with distilled water; NaCl + AsA, added 100 mmol·L–1 NaCl and sprayed with 0.5 mmol·L–1 AsA; NaCl + lycorine, added 100 mmol·L–1 NaCl and sprayed with 0.25 mmol·L–1 lycorine; NaCl + lycorine + AsA, added 100 mmol·L–1 NaCl and sprayed with 0.25 mmol·L–1 lycorine plus 0.5 mmol·L–1 AsA. Values are means ± SD (n = 3). Values with a different letter within a sampling date are significantly different (p < 0.05).
Figure 3
Figure 3
Values of the photon activity distribution coefficients of PSI (α) (A), the photon activity distribution coefficients of PSII (β) (B), the relative deviation from full balance (β/α–1) between PSI and PSII (β/α−1) (C), the fraction of photon energy absorbed in PSII antennae utilized for photosynthetic electron transport (p) (D), the estimate of the fraction of excess excitation energy that is neither dissipated in the PSII antennae nor utilized for photochemistry (Ex) (E), and the fraction of photon energy absorbed in PSII antennae and dissipated via thermal energy in the antenna (D) (F) in leaves of salt-stressed tomato seedlings with or without exogenous reduced ascorbic acid (AsA) and lycorine (AsA synthesis inhibitor) spraying. Abbreviations 3d, 6d, and 9d represent the third, sixth, and ninth day after treatment, respectively. Control, no added NaCl and sprayed with distilled water; NaCl, added 100 mmol·L–1 NaCl and sprayed with distilled water; NaCl + AsA, added 100 mmol·L–1 NaCl and sprayed with 0.5 mmol·L–1 AsA; NaCl + lycorine, added 100 mmol·L–1 NaCl and sprayed with 0.25 mmol·L–1 lycorine; NaCl + lycorine + AsA, added 100 mmol·L–1 NaCl and sprayed with 0.25 mmol·L–1 lycorine plus 0.5 mmol·L–1 AsA. Values are means ± SD (n = 3). Values with a different letter within a sampling date are significantly different (p < 0.05).
Figure 4
Figure 4
Values of the rate of electron transport through PSII Je(PSII) (A), electron flux for the photosynthetic carbon reduction cycle (Je(PCR)) (B), electron flux for photorespiration (Je(PCO)) (C), alternative electron flux (Ja) (D), the O2-dependent alternative electron flux (Ja(O2-dependent)) (E), and the O2-independent alternative electron flux (Ja(O2-independent)) (F) in leaves of salt-stressed tomato seedlings with or without exogenous reduced ascorbic acid (AsA) and lycorine (AsA synthesis inhibitor) spraying. Abbreviations 3d, 6d, and 9d represent the third, sixth, and ninth day after treatment, respectively. Control, no added NaCl and sprayed with distilled water; NaCl, added 100 mmol·L–1 NaCl and sprayed with distilled water; NaCl + AsA, added 100 mmol·L–1 NaCl and sprayed with 0.5 mmol·L–1 AsA; NaCl + lycorine, added 100 mmol·L–1 NaCl and sprayed with 0.25 mmol·L–1 lycorine; NaCl + lycorine + AsA, added 100 mmol·L–1 NaCl and sprayed with 0.25 mmol·L–1 lycorine plus 0.5 mmol·L–1 AsA. Values are means ± SD (n = 3). Values with a different letter within a sampling date are significantly different (p < 0.05).
Figure 5
Figure 5
Ratio of Je(PCR)/Je(PSII), Je(PCO)/Je(PSII), Ja/Je(PSII), Ja(O2-dependent)/Je(PSII), and Ja(O2-independent)/Je(PSII) in leaves of salt-stressed tomato seedlings with or without exogenous reduced ascorbic acid (AsA) and lycorine (AsA synthesis inhibitor) spraying. Abbreviations 3d, 6d, and 9d represent the third, sixth, and ninth day after treatment, respectively. Control, no added NaCl and sprayed with distilled water; NaCl, added 100 mmol·L–1 NaCl and sprayed with distilled water; NaCl + AsA, added 100 mmol·L–1 NaCl and sprayed with 0.5 mmol·L–1 AsA; NaCl + lycorine, added 100 mmol·L–1 NaCl and sprayed with 0.25 mmol·L–1 lycorine; NaCl + lycorine + AsA, added 100 mmol·L–1 NaCl and sprayed with 0.25 mmol·L–1 lycorine plus 0.5 mmol·L–1 AsA. Values are means ± SD (n = 3).
Figure 6
Figure 6
Values of the rate of electron transport through PSI (Je(PSI)) (A), the quantum yield of cyclic electron flow (CEF) around PS I (Y(CEF)) (B), Y(CEF)/Y (II) (C), and the electron flux through CEF-PSI (Je(CEF-PSI)) (D) in leaves of salt-stressed tomato seedlings with or without exogenous reduced ascorbic acid (AsA) and lycorine (AsA synthesis inhibitor) spraying. Abbreviations 3d, 6d, and 9d represent the third, sixth, and ninth day after treatment, respectively. Control, no added NaCl and sprayed with distilled water; NaCl, added 100 mmol·L–1 NaCl and sprayed with distilled water; NaCl + AsA, added 100 mmol·L–1 NaCl and sprayed with 0.5 mmol·L–1 AsA; NaCl + lycorine, added 100 mmol·L–1 NaCl and sprayed with 0.25 mmol·L–1 lycorine; NaCl + lycorine + AsA, added 100 mmol·L–1 NaCl and sprayed with 0.25 mmol·L–1 lycorine plus 0.5 mmol·L–1 AsA. Values are means ± SD (n = 3). Values with a different letter within a sampling date are significantly different (p < 0.05).
Figure 7
Figure 7
Values of histochemical detection of superoxide anion (O2) (A), O·− content (B), histochemical detection of hydrogen peroxide (H2O2) (C), H2O2 content (D), histochemical detection of MDA (E), MDA content (F), and relative conductivity (G) in leaves of salt-stressed tomato seedlings with or without exogenous reduced ascorbic acid (AsA) and lycorine (AsA synthesis inhibitor) spraying. Abbreviations 3d, 6d, and 9d represent the third, sixth, and ninth day after treatment, respectively. Control, no added NaCl and sprayed with distilled water; NaCl, added 100 mmol·L–1 NaCl and sprayed with distilled water; NaCl + AsA, added 100 mmol·L–1 NaCl and sprayed with 0.5 mmol·L–1 AsA; NaCl + lycorine, added 100 mmol·L–1 NaCl and sprayed with 0.25 mmol·L–1 lycorine; NaCl + lycorine + AsA, added 100 mmol·L–1 NaCl and sprayed with 0.25 mmol·L–1 lycorine plus 0.5 mmol·L–1 AsA. Values are means ± SD (n = 3). Values with a different letter within a sampling date are significantly different (p < 0.05).
Figure 8
Figure 8
Values of reduced glutathione (GSH) content (A) and the ratio of GSH/GSSG (reduced glutathione/oxidized glutathione) (B) in leaves of salt-stressed tomato seedlings with or without exogenous reduced ascorbic acid (AsA) and lycorine (AsA synthesis inhibitor) spraying. Abbreviations 3d, 6d, and 9d represent the third, sixth, and ninth day after treatment, respectively. Control, no added NaCl and sprayed with distilled water; NaCl, added 100 mmol·L–1 NaCl and sprayed with distilled water; NaCl + AsA, added 100 mmol·L–1 NaCl and sprayed with 0.5 mmol·L–1 AsA; NaCl + lycorine, added 100 mmol·L–1 NaCl and sprayed with 0.25 mmol·L–1 lycorine; NaCl + lycorine + AsA, added 100 mmol·L–1 NaCl and sprayed with 0.25 mmol·L–1 lycorine plus 0.5 mmol·L–1 AsA. Values are means ± SD (n = 3). Values with a different letter within a sampling date are significantly different (p < 0.05).
Figure 9
Figure 9
Values of superoxidase dismutase (SOD) (A), peroxidase (POD) (B), and catalase (CAT) (C) activity in leaves of salt-stressed tomato seedlings with or without exogenous reduced ascorbic acid (AsA) and lycorine (AsA synthesis inhibitor) spraying. Abbreviations 3d, 6d, and 9d represent the third, sixth, and ninth day after treatment, respectively. Control, no added NaCl and sprayed with distilled water; NaCl, added 100 mmol·L–1 NaCl and sprayed with distilled water; NaCl + AsA, added 100 mmol·L–1 NaCl and sprayed with 0.5 mmol·L–1 AsA; NaCl + lycorine, added 100 mmol·L–1 NaCl and sprayed with 0.25 mmol·L–1 lycorine; NaCl + lycorine + AsA, added 100 mmol·L–1 NaCl and sprayed with 0.25 mmol·L–1 lycorine plus 0.5 mmol·L–1 AsA. Values are means ± SD (n = 3). Values with a different letter within a sampling date are significantly different (p < 0.05).
Figure 10
Figure 10
Values of ascorbate peroxidase (APX) (A), glutathione reductase (GR) (B), dehydroascorbate reductase (DHAR) (C), and monodehydroascorbate reductase (MDHAR) (D) activity in leaves of salt-stressed tomato seedlings with or without exogenous reduced ascorbic acid (AsA) and lycorine (AsA synthesis inhibitor) spraying. Abbreviations 3d, 6d, and 9d represent the third, sixth, and ninth day after treatment, respectively. Control, no added NaCl and sprayed with distilled water; NaCl, added 100 mmol·L–1 NaCl and sprayed with distilled water; NaCl + AsA, added 100 mmol·L–1 NaCl and sprayed with 0.5 mmol·L–1 AsA; NaCl + lycorine, added 100 mmol·L–1 NaCl and sprayed with 0.25 mmol·L–1 lycorine; NaCl + lycorine + AsA, added 100 mmol·L–1 NaCl and sprayed with 0.25 mmol·L–1 lycorine plus 0.5 mmol·L–1 AsA. Values are means ± SD (n = 3). Values with a different letter within a sampling date are significantly different (p < 0.05).
Figure 11
Figure 11
Expression of SOD (superoxidase dismutase gene) (A), CAT (catalase gene) (B), POD (peroxidase gene) (C), APX (ascorbate peroxidase gene) (D), MDHAR (monodehydroascorbate reductase gene) (E), DHAR (dehydroascorbate reductase gene) (F), and GR (glutathione reductase gene) (G) genes in leaves of salt-stressed tomato seedlings with or without exogenous reduced ascorbic acid (AsA) and lycorine (AsA synthesis inhibitor) spraying. Abbreviations 3d, 6d, and 9d represent the third, sixth, and ninth day after treatment, respectively. Control, no added NaCl and sprayed with distilled water; NaCl, addition of 100 mmol·L–1 NaCl and sprayed with distilled water; NaCl + AsA, added 100 mmol·L–1 NaCl and sprayed with 0.5 mmol·L–1 AsA; NaCl + lycorine, added 100 mmol·L–1 NaCl and sprayed with 0.25 mmol·L–1 lycorine; NaCl + lycorine + AsA, added 100 mmol·L–1 NaCl and sprayed with 0.25 mmol·L–1 lycorine plus 0.5 mmol·L–1 AsA. Values are means ± SD (n = 3). Values with a different letter within a sampling date are significantly different (p < 0.05).
Figure 12
Figure 12
Schematic diagram of the effects of ascorbic acid (AsA) on photosynthetic electron transfer, current distribution, and reactive oxygen species (ROS) scavenging in the leaves of tomato seedlings under salt stress conditions. Note: the solid and dashed lines correspond to promotion and inhibition, respectively, while the relative thickness of arrows denotes an increase or decrease. Electrons generated by photosystem II (PSII) are transferred to photosystem I (PSI) via plastoquinone (PQ), the cytochrome b6/f (Cyt b6/f) complex, and plastocyanin (PC), and they ultimately reduce NADP+ to NADPH via Fd (black arrow). In the context of cyclic electron flow (CEF) around PSI, Fd can transfer electrons back to PQ and then back to PSI via Cyt b6/f and PC (orange arrow). These electron transfer reactions are coupled with proton pumping into the thylakoid lumen and produce a proton gradient across the thylakoid membrane (ΔpH). AsA promotes an increase in CEF rate under salt stress and NaCl + lycorine treatment conditions, and this increase in CEF rate contributes to the formation of ΔpH, which in turn induces an increase in non-photochemical quenching (NPQ), allocation of photosynthetic electron flux primarily to carbon assimilation and nitrogen metabolism, and a decrease in Mehler reaction electron flow. Increased NPQ induces increased photosynthetic electron flux, which is primarily allocated to carbon assimilation and nitrogen metabolism. This decreases Mehler reaction electron flow and increases the strength of the antioxidant system and the activity of key enzymes in the ascorbate–glutathione (AsA–GSH) cycle. This, in turn, reduces ROS levels, signals to the nucleus, increases gene expression, and provides negative feedback to the chloroplast, which ultimately alleviates oxidative damage to the electron donor and acceptor side of PSII. In addition, the increase in ΔpH maintained the regulation of electron transfer by Cyt b6/f and avoided the excessive accumulation of electrons at PSI to reduce the oxidative damage on the acceptor side of PSI.

Similar articles

Cited by

References

    1. Hossain M.S., Alam M.U., Rahman A., Hasanuzzaman M., Nahar K., Mahmud J.A., Fujita M. Use of iso-osmotic solution to understand salt stress responses in lentil (Lens culinaris Medik.) S. Afr. J. Bot. 2017;113:346–354. doi: 10.1016/j.sajb.2017.09.007. - DOI
    1. Bailey-Serres J., Parker J.E., Ainsworth E.A., Oldroyd G.E.D., Schroeder J.I. Genetic strategies for improving crop yields. Nature. 2019;575:109–118. doi: 10.1038/s41586-019-1679-0. - DOI - PMC - PubMed
    1. Wang J., Huang R. Modulation of ethylene and ascorbic acid on reactive oxygen species scavenging in plant salt response. Front. Plant Sci. 2019;10:319. doi: 10.3389/fpls.2019.00319. - DOI - PMC - PubMed
    1. Mushtaq Z., Faizan S., Gulzar B. Salt stress, its impacts on plants and the strategies plants are employing against it: A review. J. Appl. Biol. Biotechnol. 2020;8:81–91. doi: 10.7324/JABB.2020.80315. - DOI
    1. Wada M. Chloroplast movement. Plant Sci. 2013;9:177–182. doi: 10.1016/j.plantsci.2013.05.016. - DOI - PubMed

LinkOut - more resources