The β Form in PVDF Nanocomposites with Carbon Nanotubes: Structural Features and Properties
- PMID: 36987271
- PMCID: PMC10056646
- DOI: 10.3390/polym15061491
The β Form in PVDF Nanocomposites with Carbon Nanotubes: Structural Features and Properties
Abstract
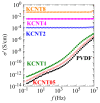
Different amounts of carbon nanotubes (CNT) have been incorporated in materials based on poly(vinylidene fluoride) (PVDF) by solvent blending followed by their further precipitation. Final processing was performed by compression molding. The morphological aspects and crystalline characteristics have been examined, additionally exploring in these nanocomposites the common routes described in the pristine PVDF to induce the β polymorph. This polar β phase has been found to be promoted by the simple inclusion of CNT. Therefore, coexistence of the α and β lattices occurs for the analyzed materials. The real-time variable-temperature X-ray diffraction measurements with synchrotron radiation at a wide angle have undoubtedly allowed us to observe the presence of the two polymorphs and determine the melting temperature of both crystalline modifications. Furthermore, the CNT plays a nucleating role in the PVDF crystallization, and also acts as reinforcement, increasing the stiffness of the nanocomposites. Moreover, the mobility within the amorphous and crystalline PVDF regions is found to change with the CNT content. Finally, the presence of CNT leads to a very remarkable increase in the conductivity parameter, in such a way that the transition from insulator to electrical conductor is reached in these nanocomposites at a percolation threshold ranging from 1 to 2 wt.%, leading to the excellent value of conductivity of 0.05 S/cm in the material with the highest content in CNT (8 wt.%).
Keywords: CNT; PVDF; conductivity; nanocomposites; percolation; β and α polymorphs.
Conflict of interest statement
The authors declare no conflict of interest. The funders had no role in the design of the study; in the collection, analyses, or interpretation of data; in the writing of the manuscript; or in the decision to publish the results.
Figures


References
-
- Brückner S., Meille S.V., Petraccone V., Pirozzi B. Polymorphism in isotactic polypropylene. Progress Polym. Sci. 1991;16:361–404. doi: 10.1016/0079-6700(91)90023-E. - DOI
-
- García-Peñas A., Gómez-Elvira J.M., Lorenzo V., Wilhelm M., Pérez E., Cerrada M.L. Poly(propylene-co-1-pentene-co- 1-heptene) terpolymers: Mechanical and rheological behavior. Polymer. 2018;156:44–53. doi: 10.1016/j.polymer.2018.09.057. - DOI
-
- Díez-Rodríguez T.M., Blázquez-Blázquez E., Martínez J.C., Pérez E., Cerrada M.L. Composites of a PLA with SBA-15 mesoporous silica: Polymorphism and properties after isothermal cold crystallization. Polymer. 2022;241:124515. doi: 10.1016/j.polymer.2022.124515. - DOI
-
- Guerra G., Karasz F.E., Macknight W.J. On blends of poly(vinylidene fluoride) and poly(vinyl fluoride) Macromolecules. 1986;19:1935–1938. doi: 10.1021/ma00161a026. - DOI
Grants and funding
LinkOut - more resources
Full Text Sources

