

Investigation of Fracturing Fluid Flowback in Hydraulically Fractured Formations Based on Microscopic Visualization Experiments
- PMID: 36987341
- PMCID: PMC10051806
- DOI: 10.3390/polym15061560
Investigation of Fracturing Fluid Flowback in Hydraulically Fractured Formations Based on Microscopic Visualization Experiments
Abstract
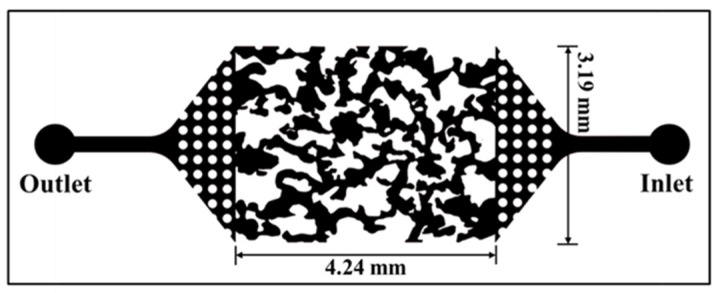
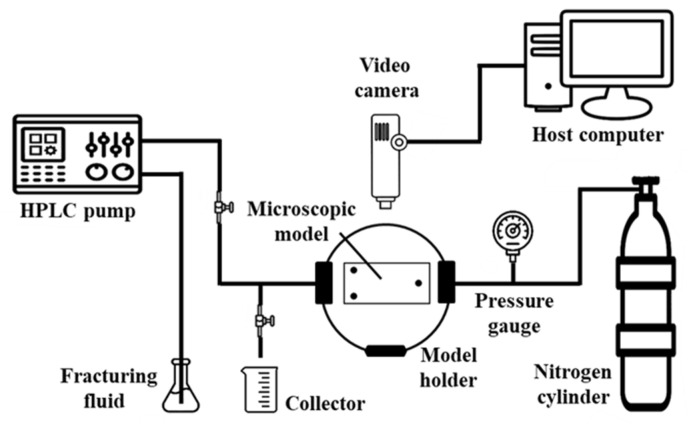
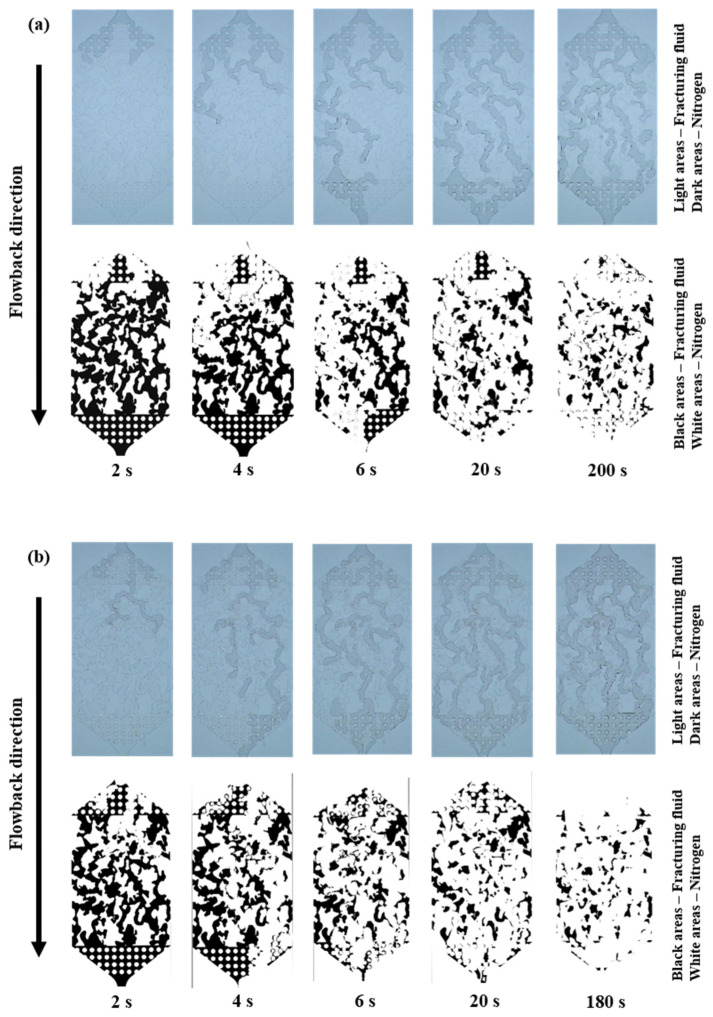
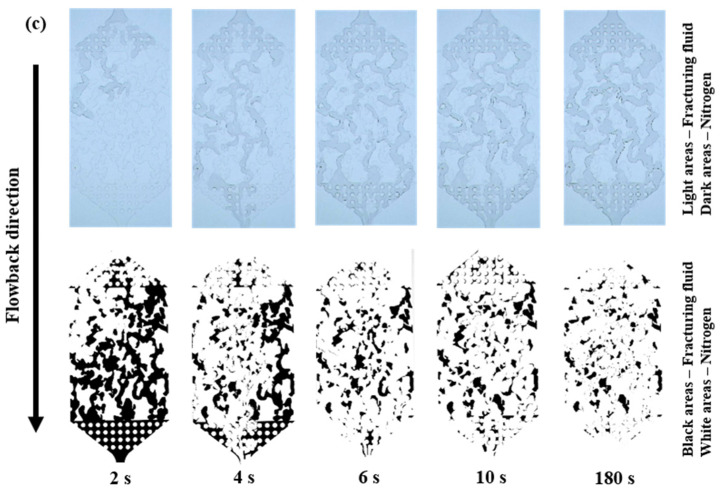
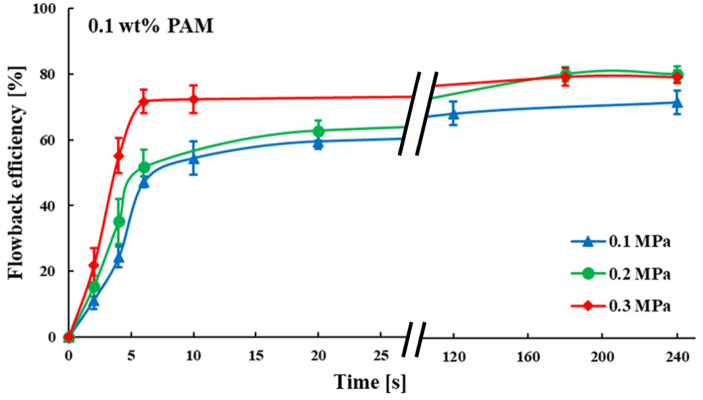
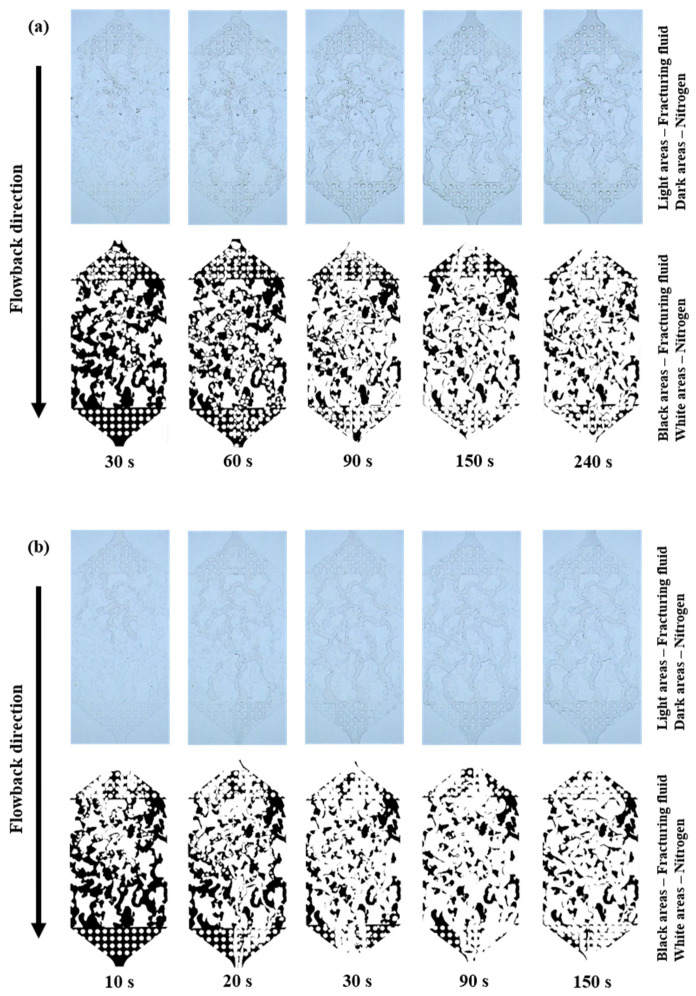
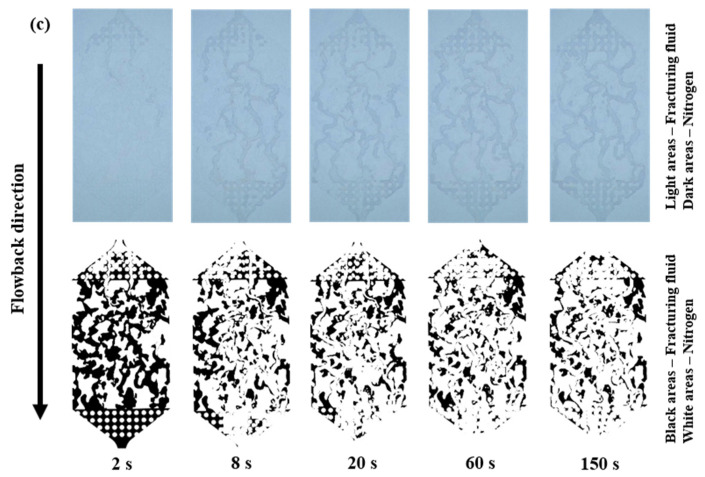
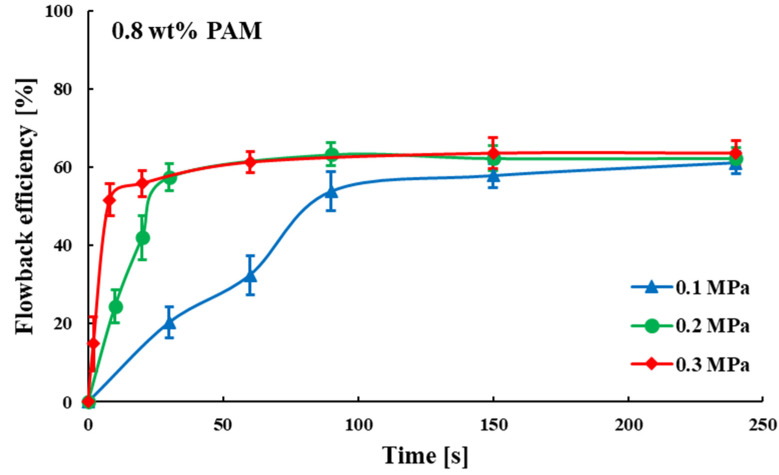
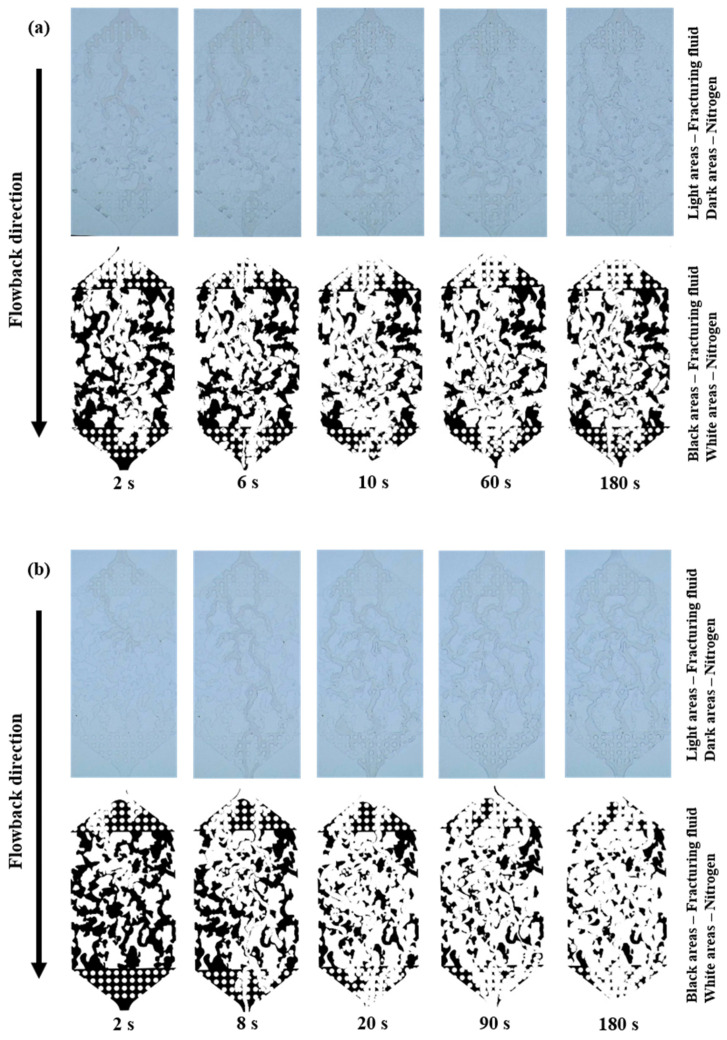
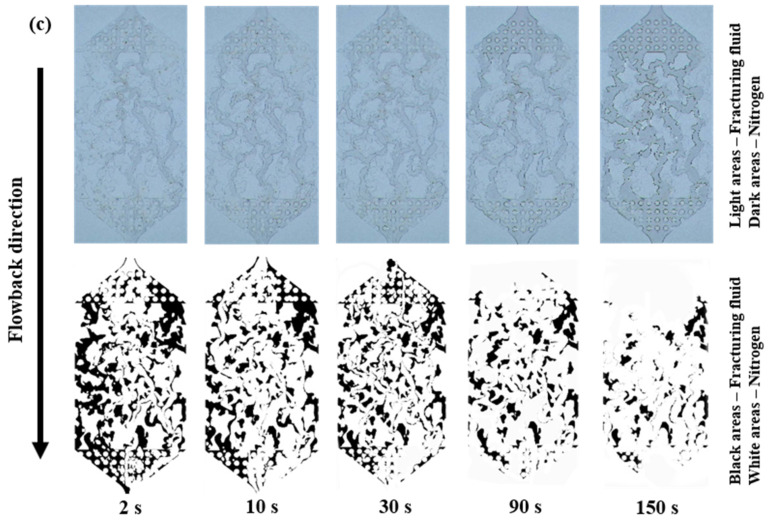
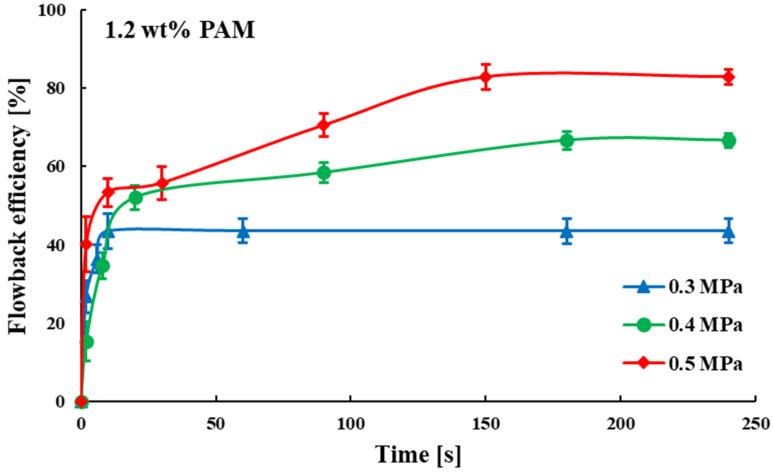
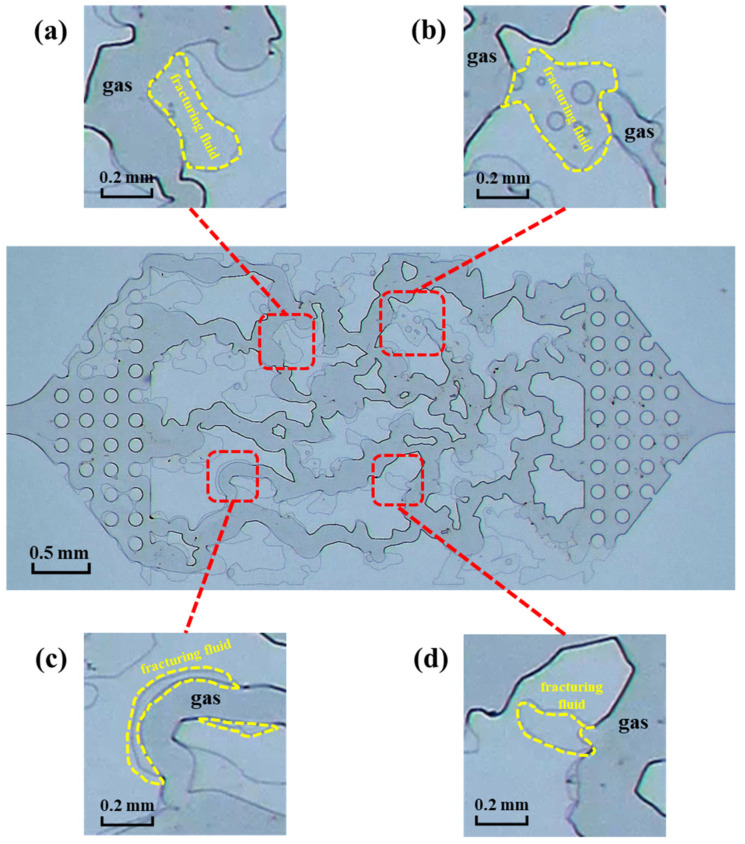
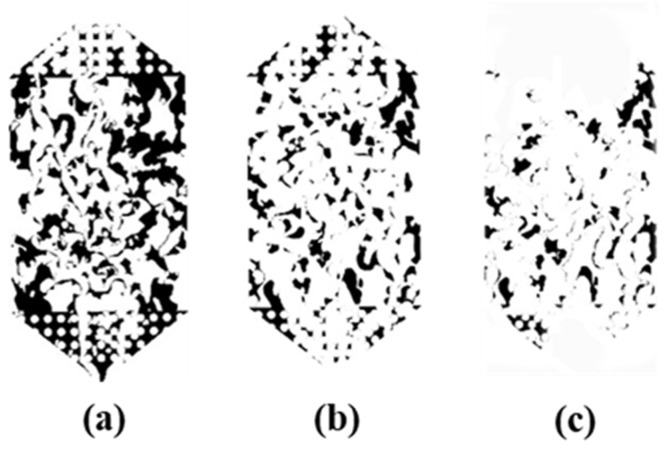
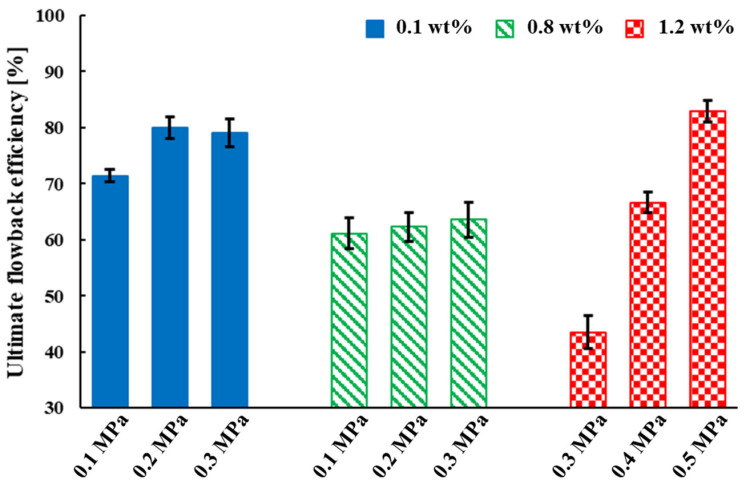
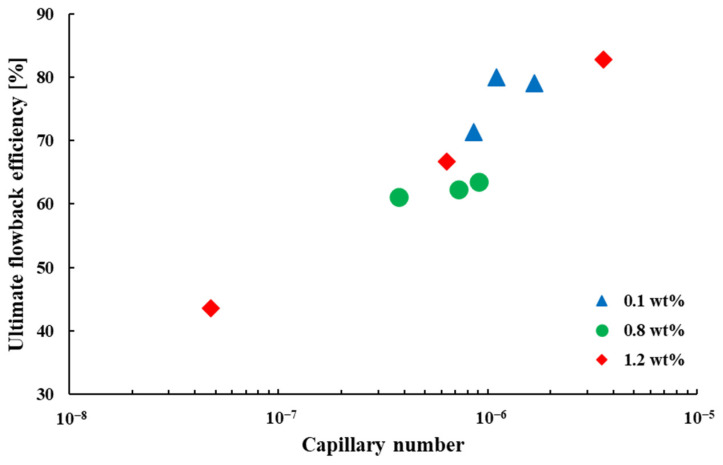
Fracturing fluids are widely applied in the hydraulic fracturing of shale gas reservoirs, but the fracturing fluid flowback efficiency is typically less than 50%, severely limiting the shale gas recovery. Additionally, the mechanism and main influencing factors of fracturing fluid flowback are unclear. In this study, microscopic experiments are conducted to simulate the fracturing fluid flowback progress in shale gas reservoirs. The mechanism and factors affecting fracturing fluid flowback/retention in the fracture zone were analyzed and clarified. Results show that the ultimate flowback efficiency of fracturing fluid is positively correlated with the fracturing fluid concentration and the gas driving pressure difference. There are four kinds of mechanisms responsible for fracturing fluid retention in the pore network: viscous resistance, the Jamin effect, the gas blockage effect and the dead end of the pore. Additionally, the ultimate flowback efficiency of the fracturing fluid increases linearly with increasing capillary number. These insights will advance the fundamental understanding of fracturing fluid flowback in shale gas reservoirs and provide useful guidance for shale gas reservoirs development.
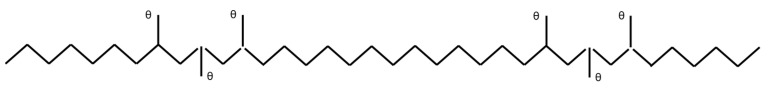
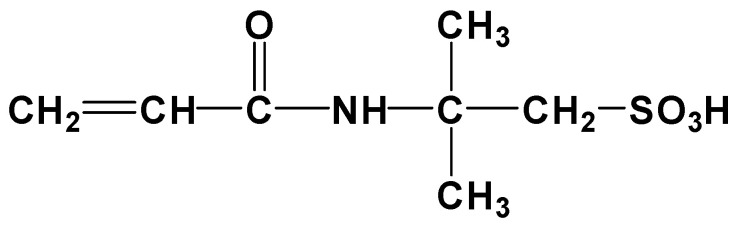
Keywords: fracturing fluid flowback; hydraulic fracture; microscopic model; polyacrylamide; shale gas.
Conflict of interest statement
The authors declare no conflict of interest.
Figures
References
-
- Zhao X., Kang B., Lan B. Focus on the development of shale gas in China—Based on SWOT analysis. Renew. Sustain. Energy Rev. 2013;21:603–613. doi: 10.1016/j.rser.2012.12.044. - DOI
-
- National Energy Administration Shale Gas Development Planning (2016–2020) [(accessed on 14 September 2016)]; Available online: http://zfxxgk.nea.gov.cn/auto86/201609/t20160930_2306.htm?keywords.
-
- U.S. Energy Information Administration (EIA) Shale Gas Production Drives World Natural Gas Production Growth. [(accessed on 15 August 2016)]; Available online: https://www.eia.gov/todayinenergy/detail.php?id=27512.
-
- U.S. Energy Information Administration (EIA) Annual Energy Outlook 2016 with Projections to 2040. [(accessed on 20 March 2016)]; Available online: www.eia.gov/forecasts/aeo/pdf/0383(2016).pdf.
-
- U.S. Energy Information Administration (EIA) Argentina Seeking Increased Natural Gas Production from Shale Resources to Reduce Imports. [(accessed on 10 February 2017)]; Available online: https://www.eia.gov/todayinenergy/detail.php?id=29912.
Grants and funding
LinkOut - more resources
Full Text Sources
Other Literature Sources
