

TFEB and TFE3 drive kidney cystogenesis and tumorigenesis
- PMID: 36987696
- PMCID: PMC10165358
- DOI: 10.15252/emmm.202216877
TFEB and TFE3 drive kidney cystogenesis and tumorigenesis
Abstract
Birt-Hogg-Dubé (BHD) syndrome is an inherited familial cancer syndrome characterized by the development of cutaneous lesions, pulmonary cysts, renal tumors and cysts and caused by loss-of-function pathogenic variants in the gene encoding the tumor-suppressor protein folliculin (FLCN). FLCN acts as a negative regulator of TFEB and TFE3 transcription factors, master controllers of lysosomal biogenesis and autophagy, by enabling their phosphorylation by the mechanistic Target Of Rapamycin Complex 1 (mTORC1). We have previously shown that deletion of Tfeb rescued the renal cystic phenotype of kidney-specific Flcn KO mice. Using Flcn/Tfeb/Tfe3 double and triple KO mice, we now show that both Tfeb and Tfe3 contribute, in a differential and cooperative manner, to kidney cystogenesis. Remarkably, the analysis of BHD patient-derived tumor samples revealed increased activation of TFEB/TFE3-mediated transcriptional program and silencing either of the two genes rescued tumorigenesis in human BHD renal tumor cell line-derived xenografts (CDXs). Our findings demonstrate in disease-relevant models that both TFEB and TFE3 are key drivers of renal tumorigenesis and suggest novel therapeutic strategies based on the inhibition of these transcription factors.
Keywords: BHD; TFE3; TFEB; cysts; kidney cancer.
© 2023 The Authors. Published under the terms of the CC BY 4.0 license.
Conflict of interest statement
AB is cofounder of Casma Therapeutics and advisory board member of Next Generation Diagnostics, Avilar Therapeutics and Coave Therapeutics. AB is an editorial advisory board member. This has no bearing on the editorial consideration of this article for publication.
Figures
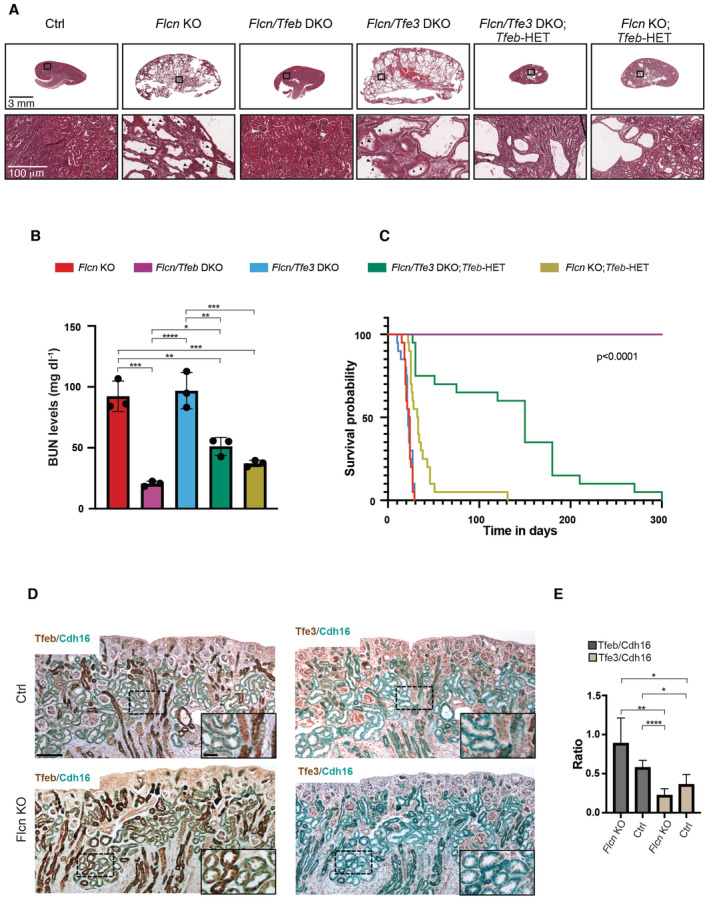
Hematoxylin and eosin (H&E) staining of kidneys from control (Flcn flox/flox ), Flcn KO, Flcn/Tfeb DKO, Flcn/Tfe3 DKO, Flcn/Tfe3 DKO; Tfeb‐HET and Flcn KO; Tfeb‐HET mice at p18 (replicated three times). Scale bars, 3 mm (upper panels). Boxed areas are magnified in the bottom panels. Arrowhead indicates tubular papillary atypical hyperplasia. Scale bars, 100 μm (lower panels).
Blood urea nitrogen (BUN) levels in mice of the indicated genotypes at p18 (mean ± SD, n = 3). One‐way ANOVA and the Tukey's HSD posthoc test (corrected for multiple comparisons) were applied. Significance for each comparison is provided in Materials and Methods.
Kaplan–Meyer survival analysis of the indicated genotypes (n = 20 for each genotype); log‐rank test, P‐value < 0.0001.
Representative immunohistochemical (IHC) analysis of Tfeb or Tfe3 and Cadherin‐16 (Cdh16) on adjacent kidney sections from mice of the indicated genotypes at p2. Tfeb and Tfe3 were stained in DAB, Cdh16 was stained in teal. Nuclei were stained with hematoxylin II (blue). Magnification: 10×, scale bar: 100 μm. Magnification: 20× (in inset image), scale bar: 25 μm.
Quantification of TFEB or TFE3 levels relative to cadherin 16 (indicated as ratio); values represent mean ± SEM (n = 4 biological replicates for each genotype). A Welch's One Way ANOVA test with the Dunnett's T3 multiple comparisons test was applied. Significance for each comparison is provided in Materials and Methods.
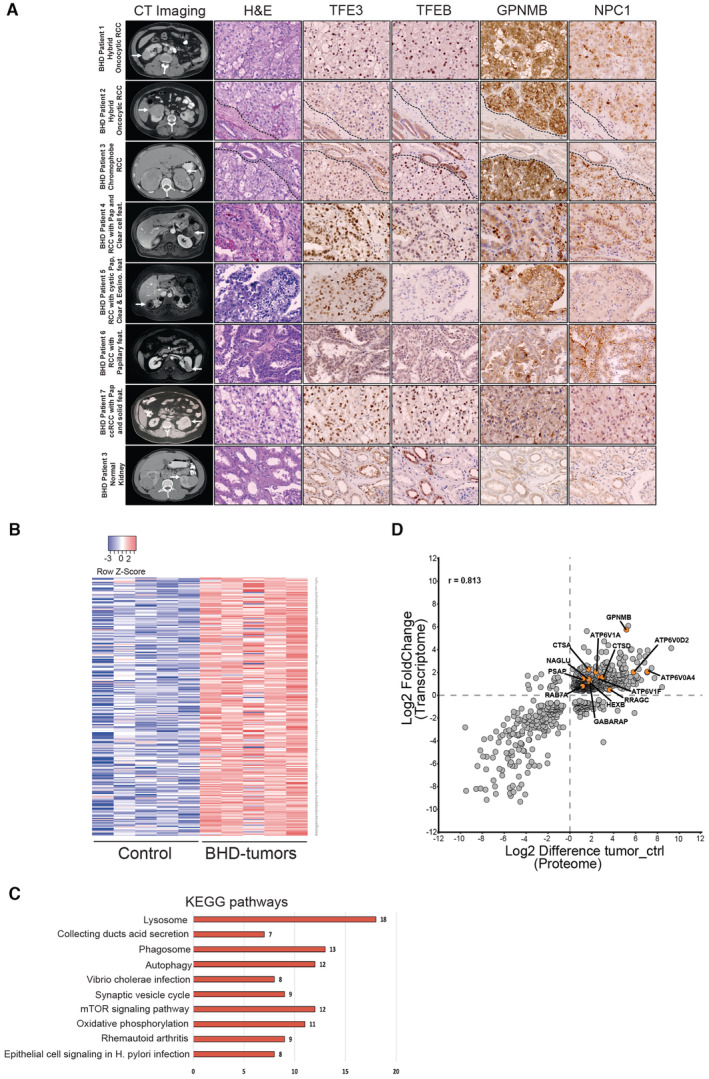
Abdominal imaging, H&E staining, and immunohistochemical staining for TFE3, TFEB, GPNMB, and NPC1 in Hybrid RCC tumors from BHD patients 1 and 2, BHD Chromophobe RCC tumor (patient 3), BHD papillary/clear RCC (patients 4, 5, and 6), a BHD patient with clear/eosinophilic/papillary RCC (patient 7, origin of the BHD RCC cell line UOK257), and an area of normal kidney from the BHD patient 3. In the rows 1–7, the arrows point to the tumor in the right or left kidney of BHD patients 1–7; in the bottom row, the arrow points to uninvolved, normal kidney in BHD patient 3.
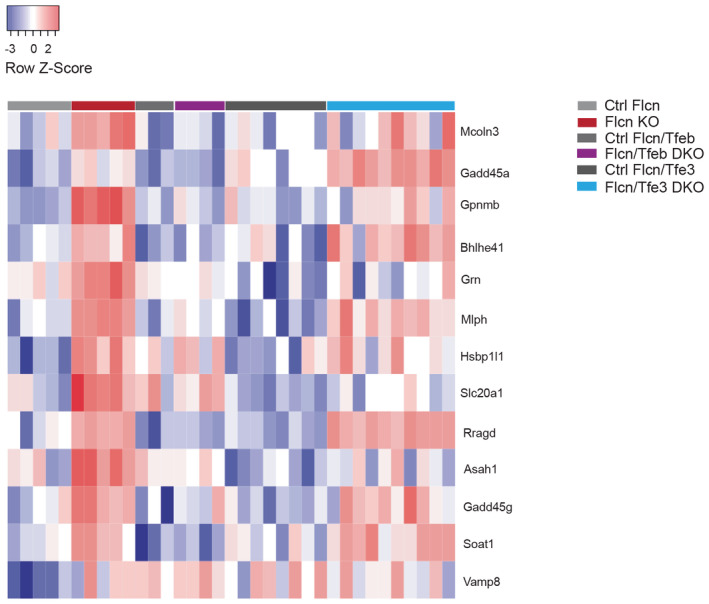
Heatmap showing validated TFEB/TFE3 target genes differentially expressed from kidney tumors of BHD patients and control kidney samples (relative to Dataset EV2). Genes are ranked from the most significantly upregulated to the less significantly upregulated in the tumor samples. Each row shows the relative expression level of a single gene. Each column shows the expression level of a single sample. Upregulated transcripts are shown in red and downregulated transcripts are shown in blue.
Kegg pathways associated with genes in (B).
Correlation between transcriptomic and proteomic analysis of BHD‐associated kidney tumor samples (n = 7 biological replicates) relative to control kidney tissues (n = 5 biological replicates).
- A–F
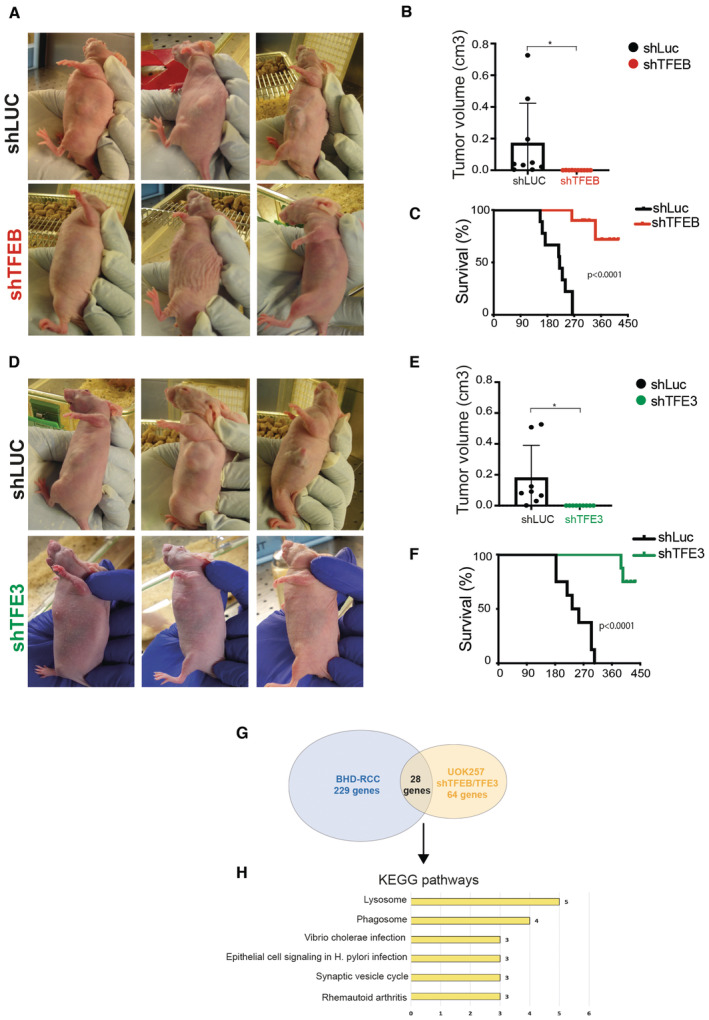
(A, D) Representative pictures of mice injected with UOK257 cells silenced for luciferase (shLuc) (A, D) or for TFEB (A) or for TFE3 (D). Pictures were taken approximately 4 months after injection. (B, E) Plots show tumor volumes in mice injected with UOK257/shLuc (n = 8) or UOK257/shTFEB (n = 10) (B) and mice injected with UOK257/shLuc (n = 8) or UOK257/shTFE3 (n = 9) (E); (mean ± SD). *P = 0.036 for plot in (B) and *P = 0.023 for plot in (E); unpaired t‐test. (C, F) Kaplan–Meier analysis of mice survival relative to the two experimental groups. Long‐rank test, P < 0.0001. The median survival time of mice injected with UOK257/shLuc is 219.5 days in (C) and 244.5 days in (F).
- G
Venn diagram showing overlapping genes in the analyzed data sets.
- H
KEGG pathways relative to overlapping genes in (G) (Dataset EV4).
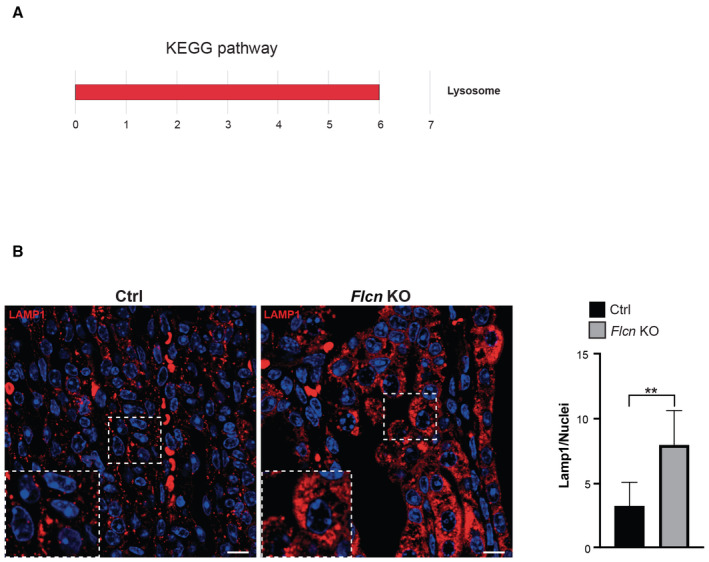
Kegg pathway associated with genes significantly upregulated in kidney tissues from Flcn KO mice relative to control mice at the precystic stage p2 (Dataset EV1).
Lamp1 immunostaining (in red) of renal tissues from control (Ctrl) and kidney‐specific Flcn KO (Flcn KO) mice. Insets show magnification of the boxed area. Nuclei were stained with DAPI (blue). Scale bar 10 μm. Bar graph shows quantification of Lamp1‐positive vesicles/nuclei. Mean ± 95% of confidence interval (n = 3 biological replicates). Unpaired t‐test **P < 0.01.
- A, B
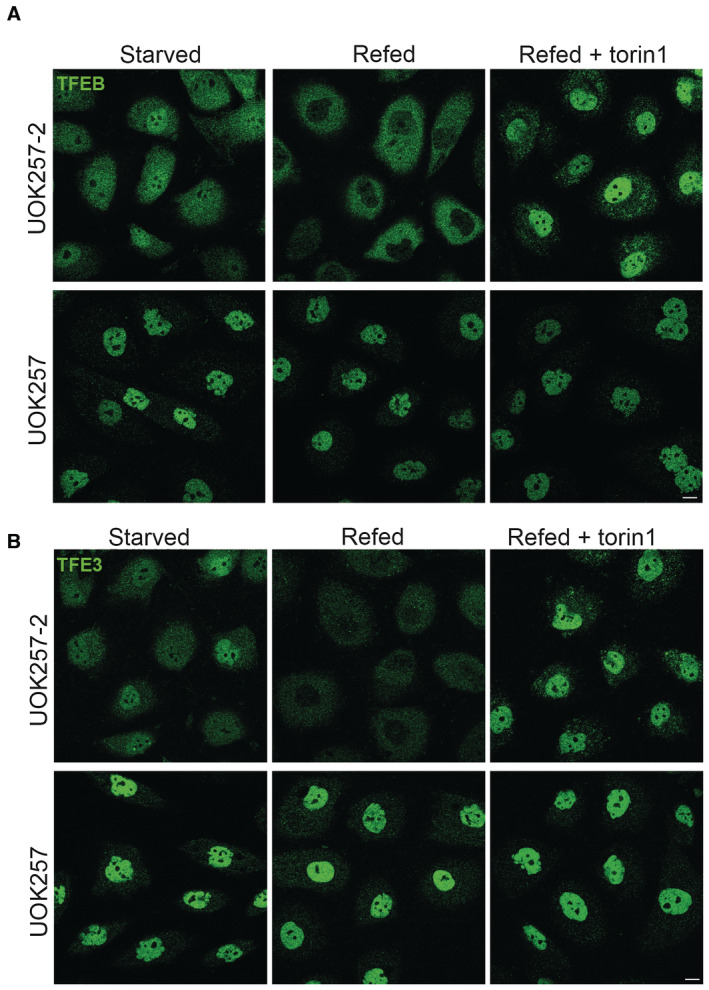
Representative immunofluorescence analysis of TFEB (A) or TFE3 (B) localization in BHD patient‐derived UOK257 cells and control UOK257‐2 cells, obtained by stable transfection of UOK257 cells with exogenous FLCN. Cells were deprived of amino acids for 2 h (starved) and then restimulated with amino acids (refed) for 1 h in the presence or absence of 300 nM torin1. Scale bar, 10 μm.
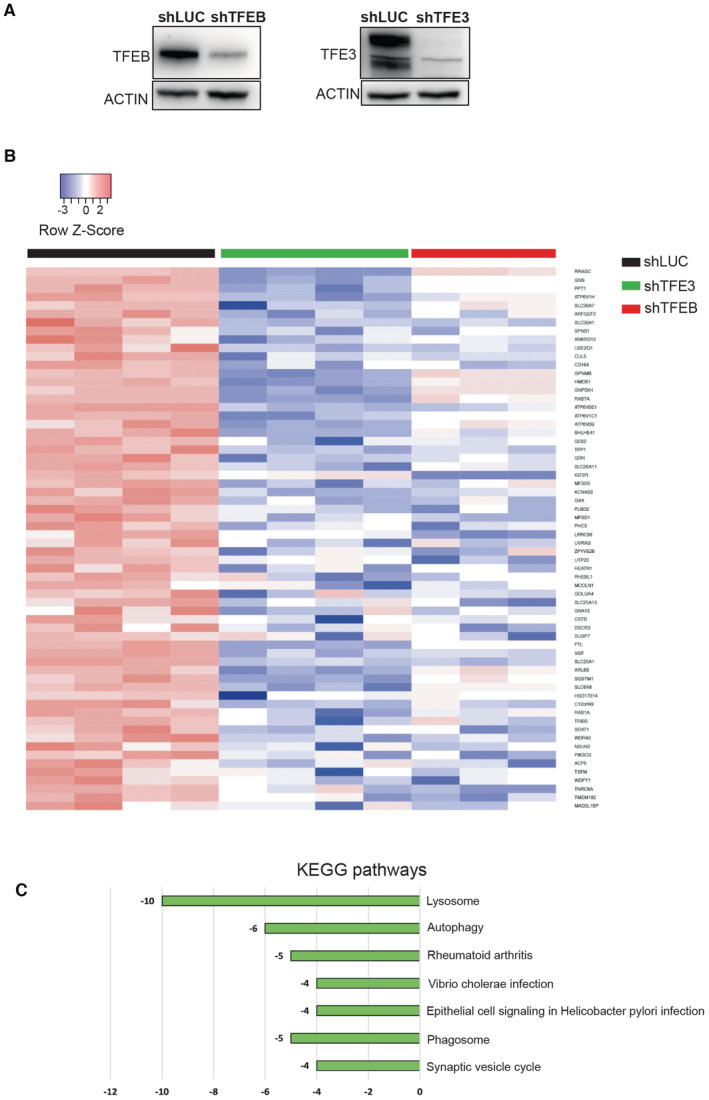
Immunoblot analysis of the indicated proteins in UOK257 cells silenced for luciferase (shLUC) or TFEB (shTFEB) or TFE3 (shTFE3).
Heatmap showing validated TFEB target genes differentially expressed from UOK257 cells infected with the indicated shRNA (relative to Dataset EV3). Genes are ranked from the most significantly upregulated to the less significantly upregulated in the cells infected with control shRNA (shLUC). Each row shows the relative expression level of a single gene. Each column shows the expression level of a single sample. Upregulated transcripts are shown in red and downregulated transcripts are shown in blue.
Kegg pathways associated with TFEB target genes significantly downregulated in (B).
- A, B
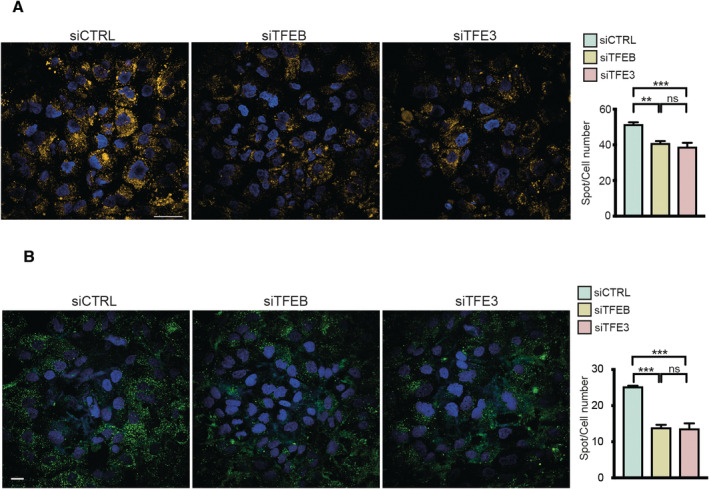
LysoTracker (A) and DQ‐BSA (B) analysis of UOK257 cells silenced for TFEB or TFE3 or scramble siRNA (CTRL). Scale bars: 50 μm in (A) and 20 μm in (B). Plots represent number of spots/cell and are expressed as mean ± SE (n = 3 biological replicates), ordinary one‐way ANOVA, Tukey's multiple comparisons test.
References
-
- Baba M, Hong S‐B, Sharma N, Warren MB, Nickerson ML, Iwamatsu A, Esposito D, Gillette WK, Hopkins RF, Hartley JL et al (2006) Folliculin encoded by the BHD gene interacts with a binding protein, FNIP1, and AMPK, and is involved in AMPK and mTOR signaling. Proc Natl Acad Sci USA 103: 15552–15557 - PMC - PubMed
-
- Baba M, Furihata M, Hong S‐B, Tessarollo L, Haines DC, Southon E, Patel V, Igarashi P, Alvord WG, Leighty R et al (2008) Kidney‐targeted Birt‐Hogg‐Dube gene inactivation in a mouse model: Erk1/2 and Akt‐mTOR activation, cell hyperproliferation, and polycystic kidneys. J Natl Cancer Inst 100: 140–154 - PMC - PubMed
-
- Baba M, Furuya M, Motoshima T, Lang M, Funasaki S, Ma W, Sun H‐W, Hasumi H, Huang Y, Kato I et al (2019) TFE3 Xp11.2 translocation renal cell carcinoma mouse model reveals novel therapeutic targets and identifies GPNMB as a diagnostic marker for human disease. Mol Cancer Res 17: 1613–1626 - PMC - PubMed
Publication types
MeSH terms
Substances
Associated data
- Actions
- Actions
- Actions
Grants and funding
LinkOut - more resources
Full Text Sources
Medical
Molecular Biology Databases
Research Materials
