. 2023 May 8;51(8):3590-3617.
doi: 10.1093/nar/gkad210.

The temporal transcriptomic signature of cartilage formation

Affiliations

The temporal transcriptomic signature of cartilage formation

Roland Takács et al. Nucleic Acids Res. .

Abstract

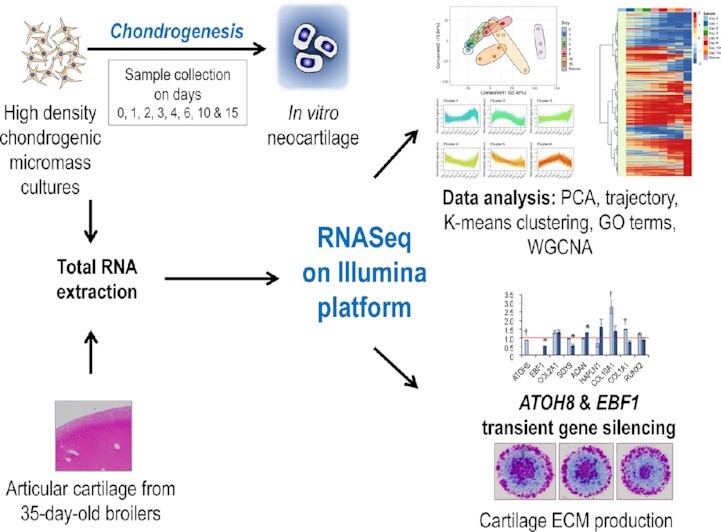
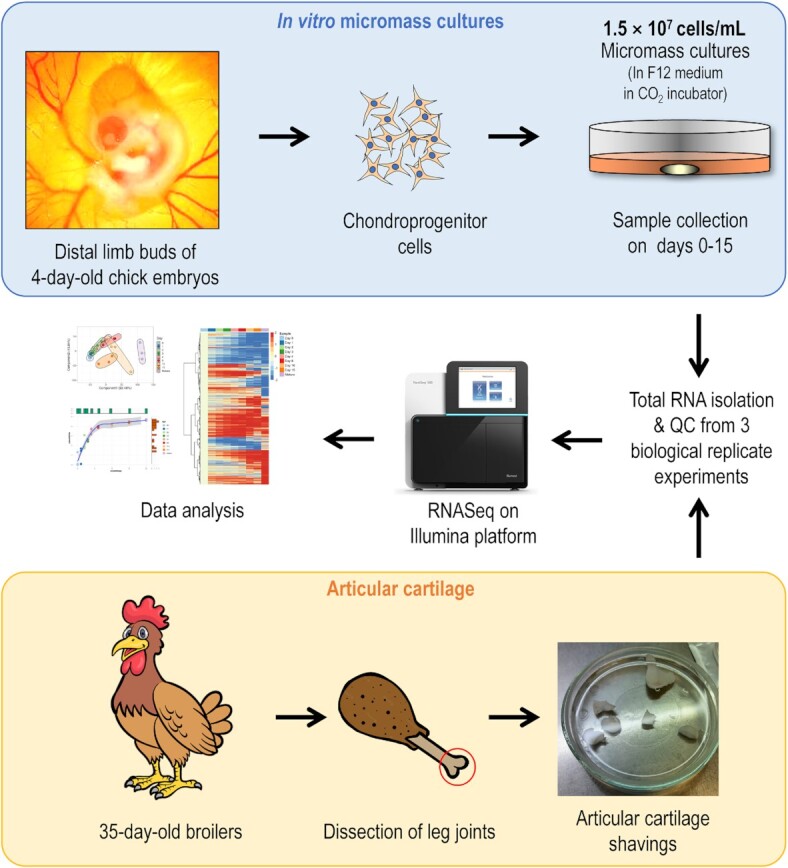
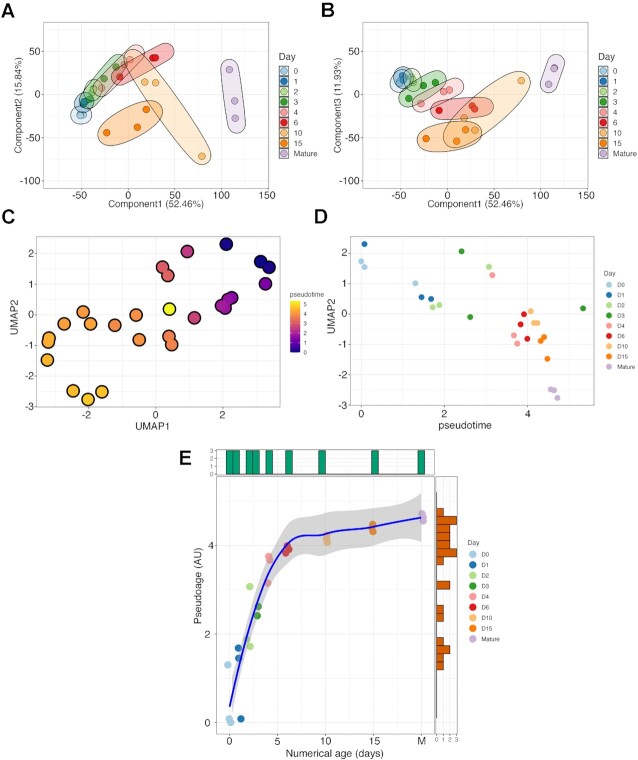
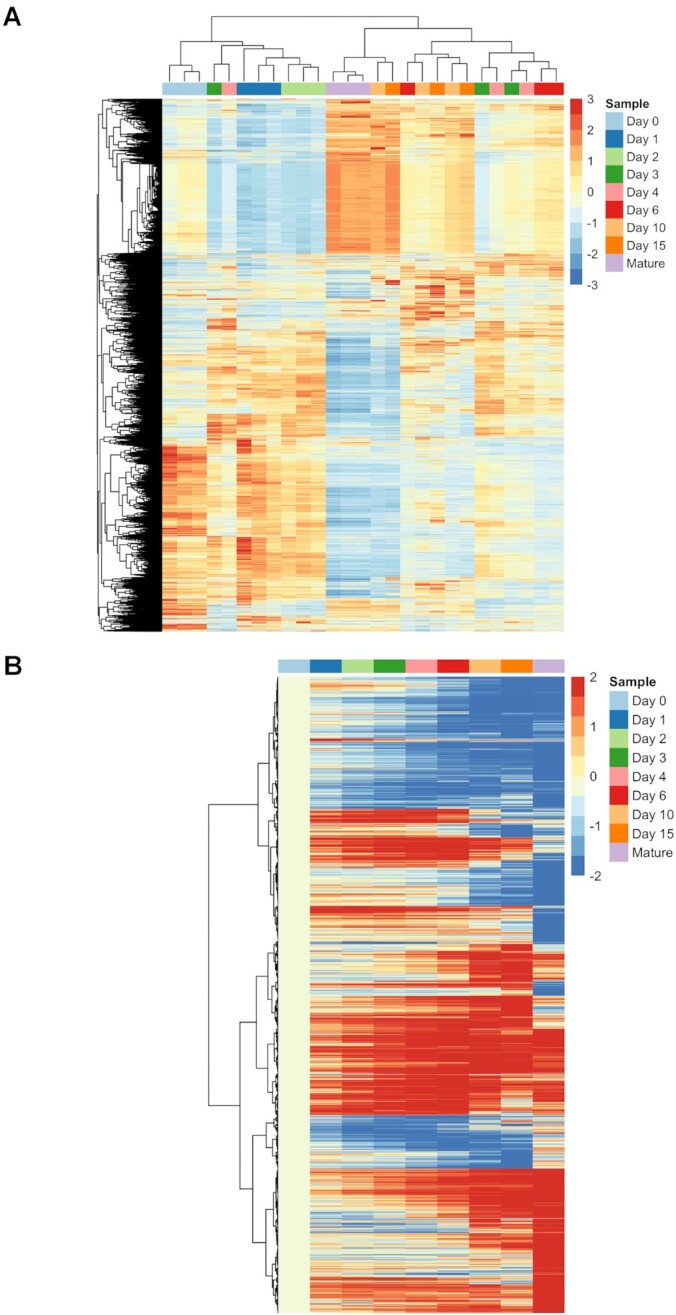
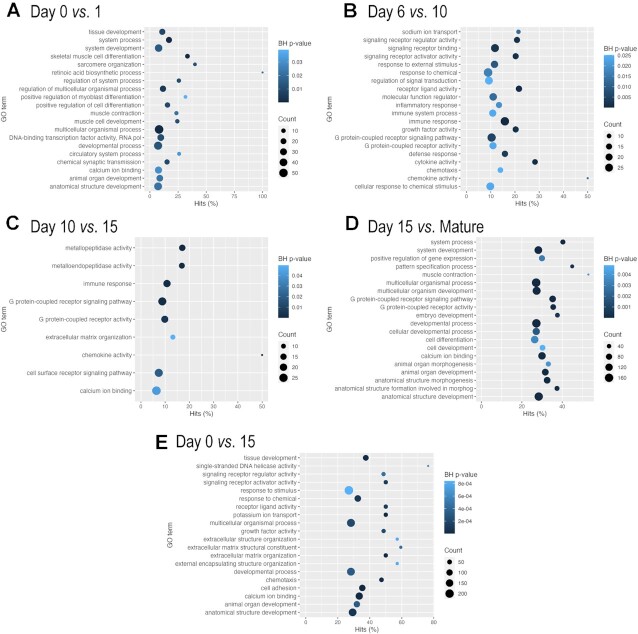
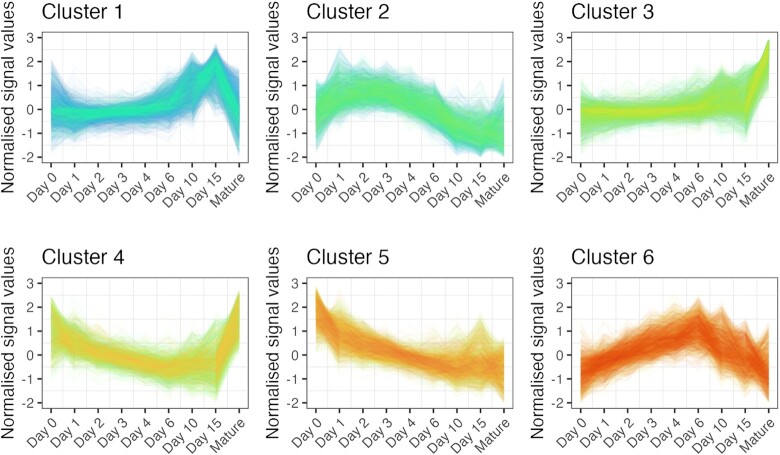
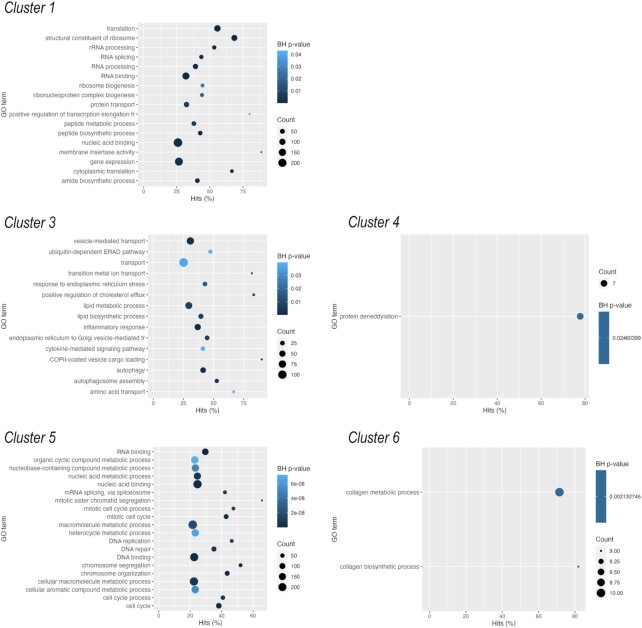
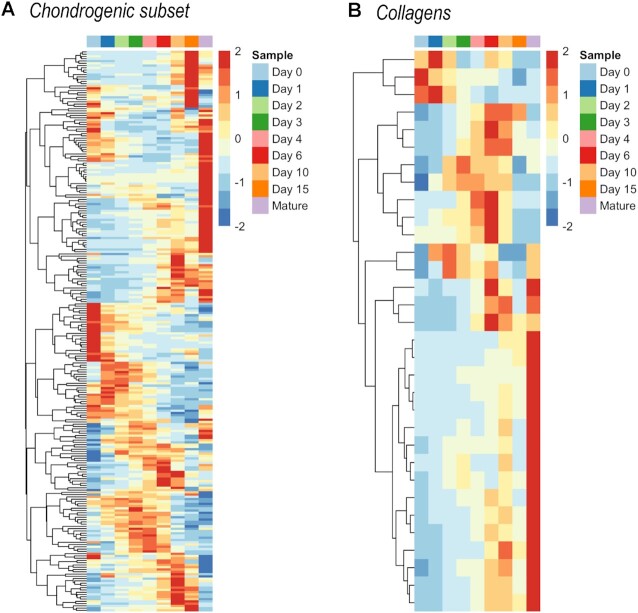
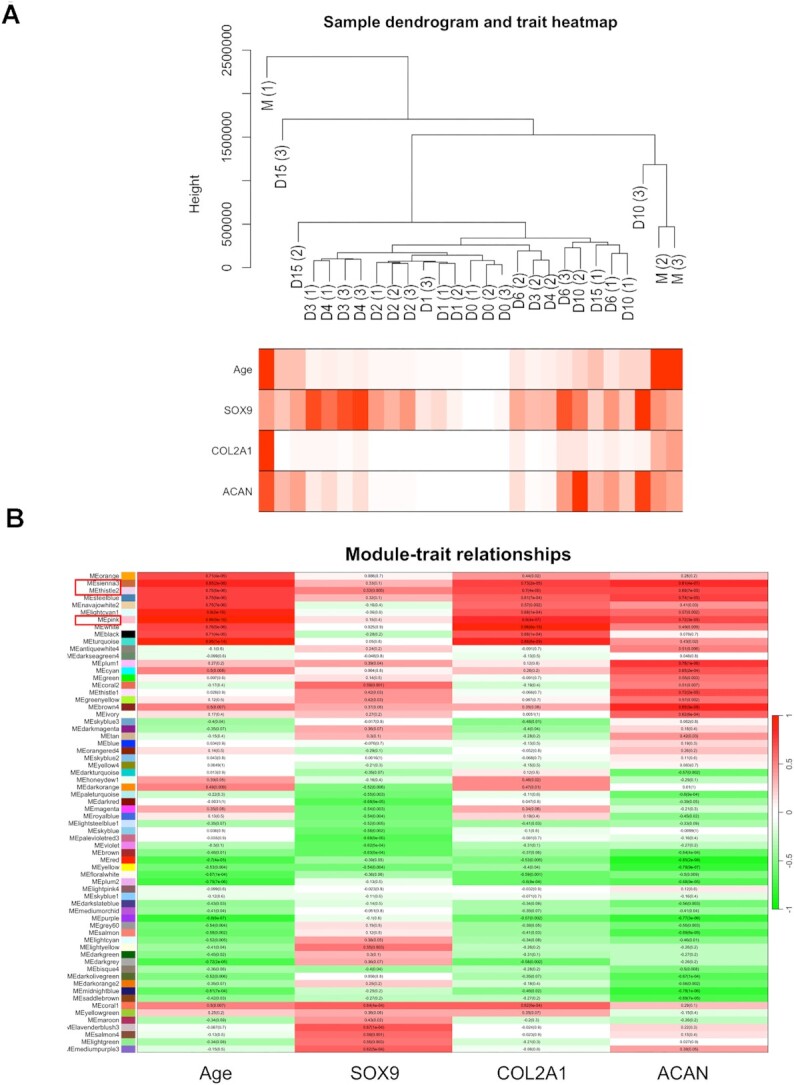
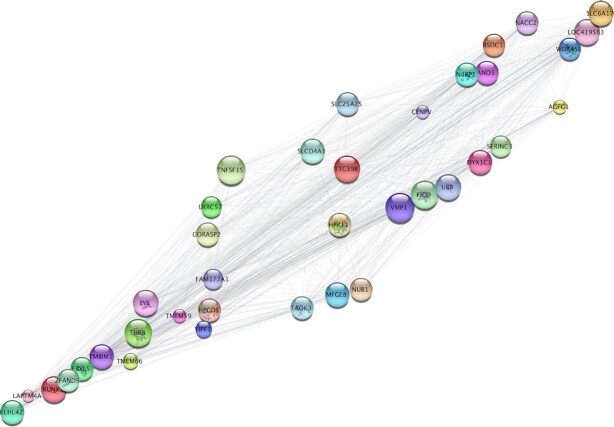
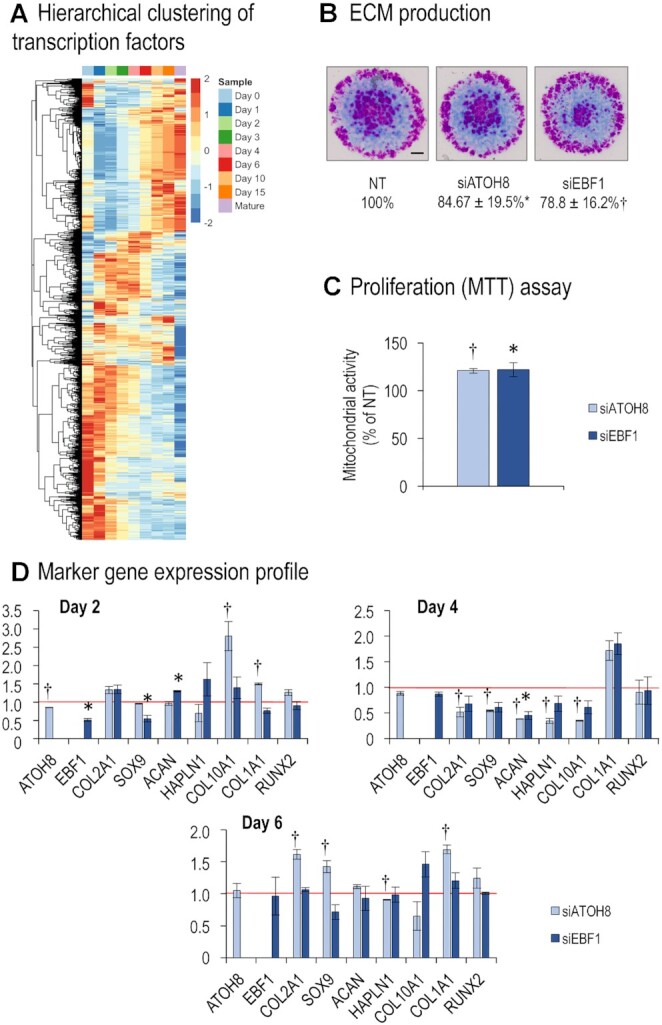
Chondrogenesis is a multistep process, in which cartilage progenitor cells generate a tissue with distinct structural and functional properties. Although several approaches to cartilage regeneration rely on the differentiation of implanted progenitor cells, the temporal transcriptomic landscape of in vitro chondrogenesis in different models has not been reported. Using RNA sequencing, we examined differences in gene expression patterns during cartilage formation in micromass cultures of embryonic limb bud-derived progenitors. Principal component and trajectory analyses revealed a progressively different and distinct transcriptome during chondrogenesis. Differentially expressed genes (DEGs), based on pairwise comparisons of samples from consecutive days were classified into clusters and analysed. We confirmed the involvement of the top DEGs in chondrogenic differentiation using pathway analysis and identified several chondrogenesis-associated transcription factors and collagen subtypes that were not previously linked to cartilage formation. Transient gene silencing of ATOH8 or EBF1 on day 0 attenuated chondrogenesis by deregulating the expression of key osteochondrogenic marker genes in micromass cultures. These results provide detailed insight into the molecular mechanism of chondrogenesis in primary micromass cultures and present a comprehensive dataset of the temporal transcriptomic landscape of chondrogenesis, which may serve as a platform for new molecular approaches in cartilage tissue engineering.


Figures

Graphical Abstract
Graphical Abstract
We analysed the transcriptomic gene signatures of in vitro chondrogenesis, and confirmed the role of ATOH8 and EBF1 transcription factors in regulating early cartilage formation.
Figure 1.
Figure 1.
Experimental workflow. Limb bud-derived 3D micromass cultures grown in plasticware (grey cylinder) in F12 medium (light orange) are represented by the yellow oval in the upper right corner. QC, quality check.
Figure 2.
Figure 2.
Light microscopy analysis of micromass cultures during the course of chondrogenic differentiation (days 0–15), and articular cartilage obtained from the knee joint of 35-day-old broilers. (A) Photomicrographs of alcian blue (AB), safranin-O (SafO) and dimethyl methylene blue (DMMB) stained cultures are shown. Original magnification was ×4. Scale bar, 1 mm. Values below images of DMMB stained cultures reflect results obtained using a MATLAB-based image analysis of metachromatic areas. Data are expressed as mean ± SEM, compared to day 6 (100%). (B) Photomicrographs of histological sections of chicken articular cartilage following haematoxylin-eosin (HE), neutral DMMB, and acidic (pH 1.8) DMMB staining. Original magnification was ×4. Scale bar, 1 mm. Representative data out of three biological replicates.
Figure 3.
Figure 3.
Collagen type I and II immunohistochemistry visualised by DAB chromogen reaction in chondrifying micromass cultures of various ages. Scale bars, 500 μm (thumbnail images in the upper panel) or 200 μm (inserts in the lower panel for more mature (i.e. day 6, 10, and 15) cultures). The brown deposits represent immunopositive signals for collagen type I or II, respectively, within the chondrogenic nodules of the micromass cultures. Values below images reflect the image analysis of immunopositive areas, normalised to haematoxylin nuclear staining. Data are expressed as mean ± SEM, compared to day 6 (100%). Representative photomicrographs are shown out of 3 biological replicate experiments.
Figure 4.
Figure 4.
Low-dimensional space representation, including principal component analysis (PCA; panels A, B) and uniform manifold approximation and projection (UMAP; panels C–E), of the RNA-seq data. PCA was performed on the normalised expression data. The first component (PC1) explains 52.46% of variability, the second component (PC2) explains 15.84% (A), and the third component (PC3) explains 11.93% (B). Each point represents an experimental sample; colours indicate different time points (days) of chondrogenesis, or mature articular cartilage. Samples clustered together by time points (culturing days/maturity), and there was minor variation between biological replicates, except for day 10. Following UMAP dimension reduction, RNA-seq data were ordered with reverse graph embedding and pseudotime calculated for each culture of known latent development time (C). Pseudotime plotted against UMAP component 1, showing that cultures progress systematically through pseudotime, but there is little separation once they reach 4.5 (D). Numerical time versus pseudotime plot (M, mature articular chondrocytes) shows the (pseudotime) developmental saturation occurring from approximately day 6 (E).
Figure 5.
Figure 5.
Hierarchical clustering (column dendrogram) of the global transcriptome of chondrogenic cells during the differentiation programme (days 0–15) and that of mature articular chondrocytes (A). Data for all 3 biological replicates are shown. Whilst most time points clustered separately (days 0, 1, 2 micromasses, and mature chondrocytes from 35-day-old broilers), days 3, 4 and 6, as well as days 10 and 15 clustered together, indicating overlapping transcriptomes at these time points. Heatmap showing differentially expressed genes (DEGs) normalised to day 0 (B). Average expression between biological replicates was used for calculating log2 fold change (LFC) values. A gradual increase in up and downregulation was observed during the course of differentiation towards mature articular chondrocytes.
Figure 6.
Figure 6.
Significant GO term (molecular function, biological process) enrichment (Benjamini-Hochberg (BH) adjusted p-value) in DEGs between pairwise comparisons of consecutive culturing days and mature articular chondrocytes (A–E). If not shown, there are no significantly enriched GO categories in that comparison.
Figure 7.
Figure 7.
Unsupervised clustering analysis of genes, based on their normalised expression values (‘Signal’) during chondrogenesis using the K-means algorithm, defined 6 groups of genes. The expression dynamics of each cluster are visible in clusters 1–6. x-axis, time points (days of culturing).
Figure 8.
Figure 8.
Significantly (Benjamini–Hochberg (BH) adjusted P-value) over-represented GO terms (molecular function, biological process) for the six clusters of genes defined by K-means algorithm. There were no significantly enriched GO categories in cluster 2.
Figure 9.
Figure 9.
Hierarchical clustering of the (A) chondrogenic subset, and (B) collagens in differentiating cells of micromass cultures undergoing chondrogenesis during days 0–15, as well as mature articular chondrocytes, based on normalised expression values. Average values for the three biological replicates are shown.
Figure 10.
Figure 10.
Unsigned WGCNA was used to identify subsets of genes that were highly correlated with the following traits: time points (age), SOX9, COL2A1 and ACAN expression patterns. Genes were then clustered into modules designated with arbitrary colours. (A) Dendrogram of RNA-seq samples (codes: D, day; M, mature; numbers in brackets indicate biological replicates) and corresponding changes in traits. The lowest values are shown in white; the highest values are depicted in red. (B) Modules whose eigengenes are highly correlated with age (days in culture) and the expression patterns of SOX9, COL2A1 and ACAN are highlighted by a red frame (sienna3, thistle2, pink); their corresponding Pearson correlation values are shown.
Figure 11.
Figure 11.
The edge data of the top ∼500 genes from the sienna3, thistle2, and pink modules from the WGCNA analysis were exported to Cytoscape. The genes were then sorted according to closeness centrality values, and the connections between the top ∼50 were visualised. Node size indicates closeness centrality values; edge length represents the strength of the correlation between the respective nodes.
Figure 12.
Figure 12.
Transcription factors in chondrogenesis of micromass cultures. (A) Hierarchical clustering of the transcription factors in differentiating cells of micromass cultures undergoing chondrogenesis during days 0–15, as well as mature articular chondrocytes, based on normalised expression values. Average values for the 3 biological replicates are shown. (B) Metachromatic cartilage areas after DMMB staining of 6-day-old micromass cultures following electroporation with ATOH8 or EBF1 siRNA, or non-targeting (NT) control. Original magnification was ×4. Scale bar, 1 mm. Values are results of a MATLAB-based image analysis of metachromatic areas. Data are expressed as mean ± SEM, compared to NT (100%). Representative data of 3 biological replicates. (C) MTT assay results carried out 6 days post electroporation with siATOH8 or siEBF1, normalised to the NT control. Average data of 3 biological replicates. (D) Gene expression data of selected osteo/chondrogenic markers 2, 4 and 6 days after transient gene silencing. Relative gene expression values are calculated by normalising to RPS7. Data are expressed as mean ± SEM (n = 3). For panels B–D, significant differences (P < 0.05) in relative gene expression data relative to NT controls are indicated by a dagger sign (†, in case of ATOH8) or an asterisk (*, in case of EBF1).

References

    1. Reinhardt R., Gullotta F., Nusspaumer G., Unal E., Ivanek R., Zuniga A., Zeller R.. Molecular signatures identify immature mesenchymal progenitors in early mouse limb buds that respond differentially to morphogen signaling. Development. 2019; 146:dev173328. - PMC - PubMed
    1. Eyre D.R., Weis M.A., Wu J.J.. Articular cartilage collagen: an irreplaceable framework?. Eur. Cell Mater. 2006; 12:57–63. - PubMed
    1. Bhosale A.M., Richardson J.B.. Articular cartilage: structure, injuries and review of management. Br. Med. Bull. 2008; 87:77–95. - PubMed
    1. Chaly Y., Hostager B., Smith S., Hirsch R.. The follistatin-like protein 1 pathway is important for maintaining healthy articular cartilage. ACR Open Rheumatol. 2020; 2:407–414. - PMC - PubMed
    1. Hunter D.J., Bierma-Zeinstra S.. Osteoarthritis. Lancet. 2019; 393:1745–1759. - PubMed

Publication types