Comparative Study
. 2023 May 22;51(9):4467-4487.
doi: 10.1093/nar/gkad228.

Structures, activity and mechanism of the Type IIS restriction endonuclease PaqCI

Affiliations
Comparative Study

Structures, activity and mechanism of the Type IIS restriction endonuclease PaqCI

Madison A Kennedy et al. Nucleic Acids Res. .

Abstract

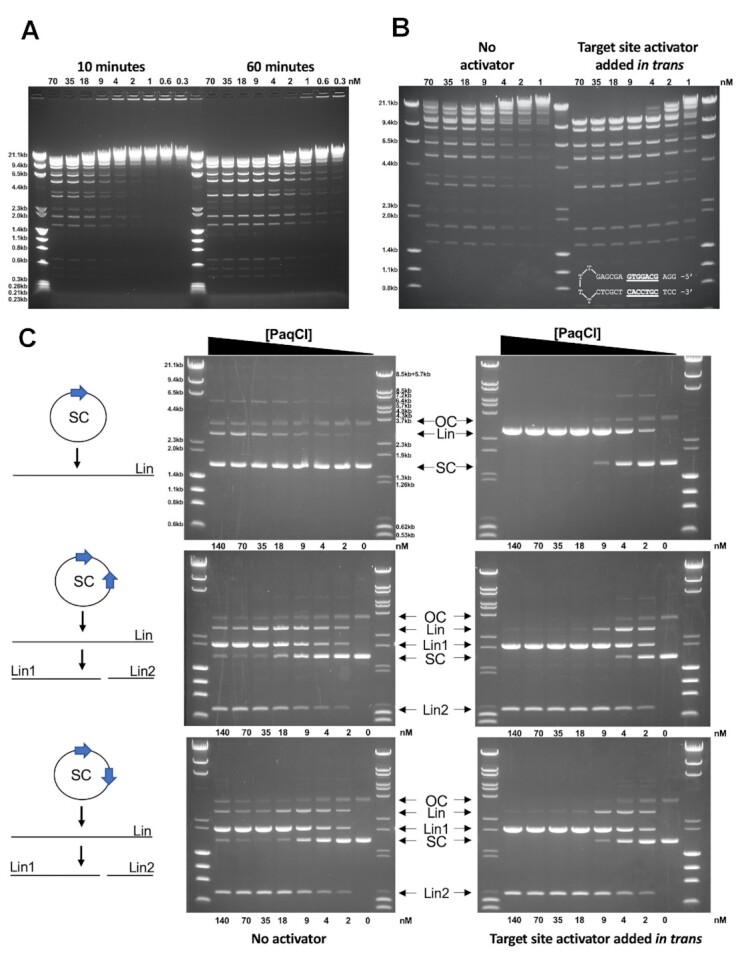
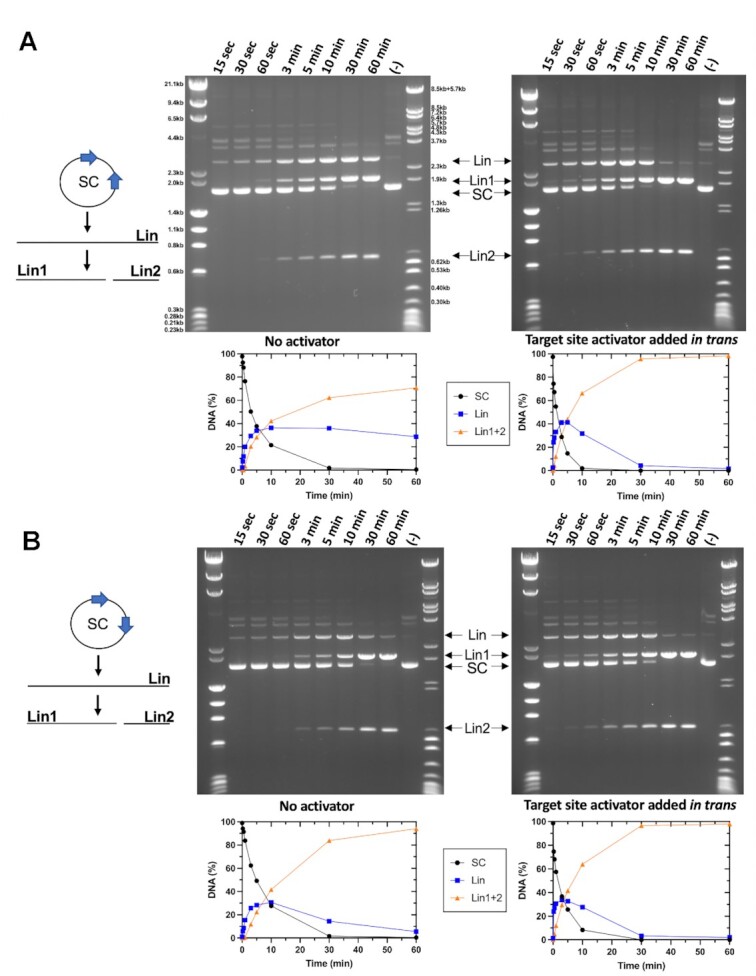
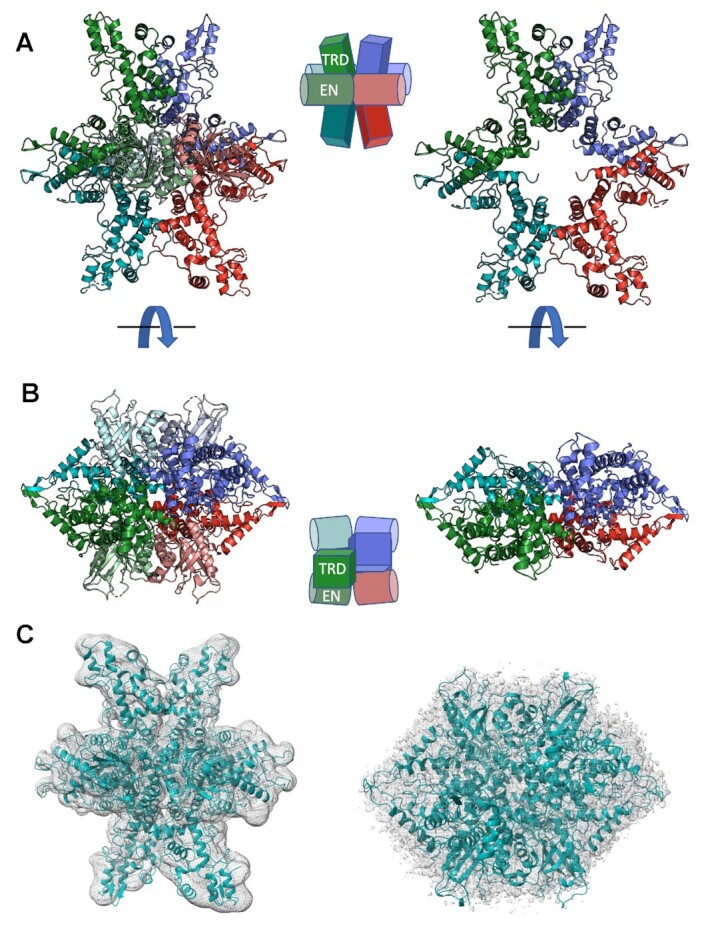
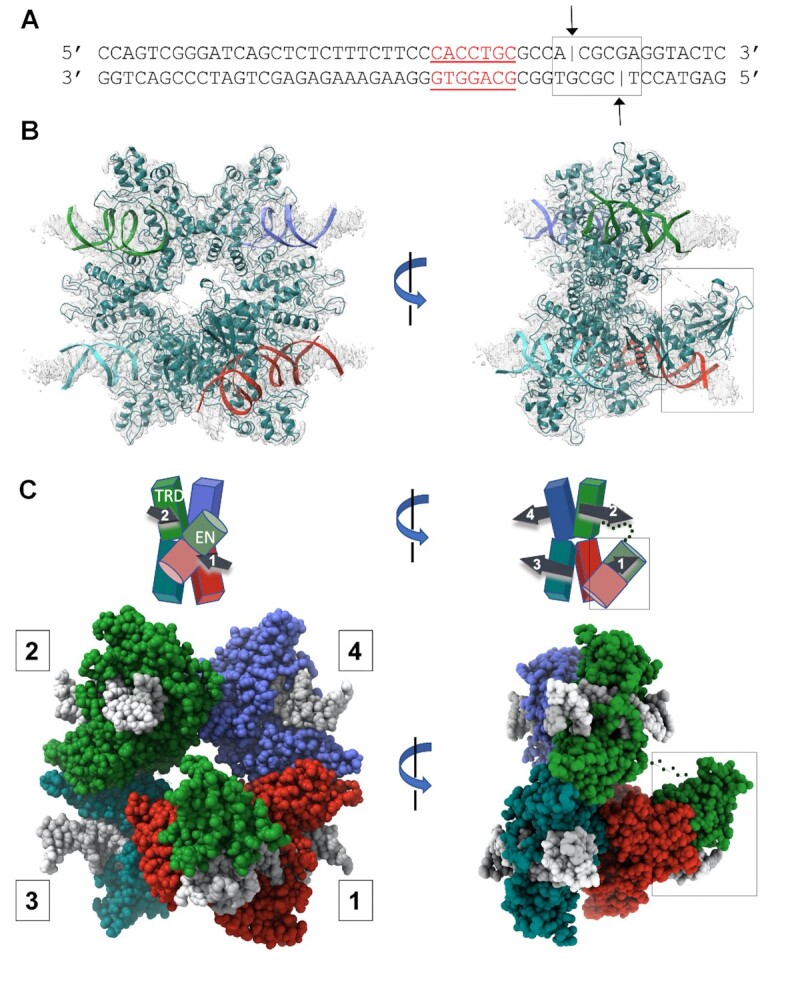
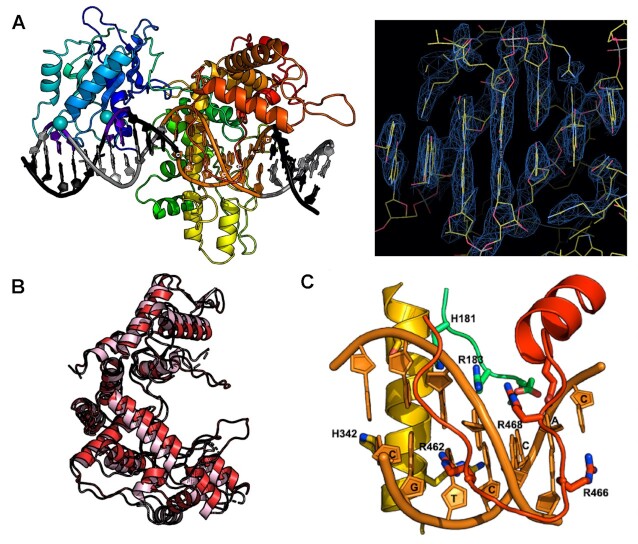
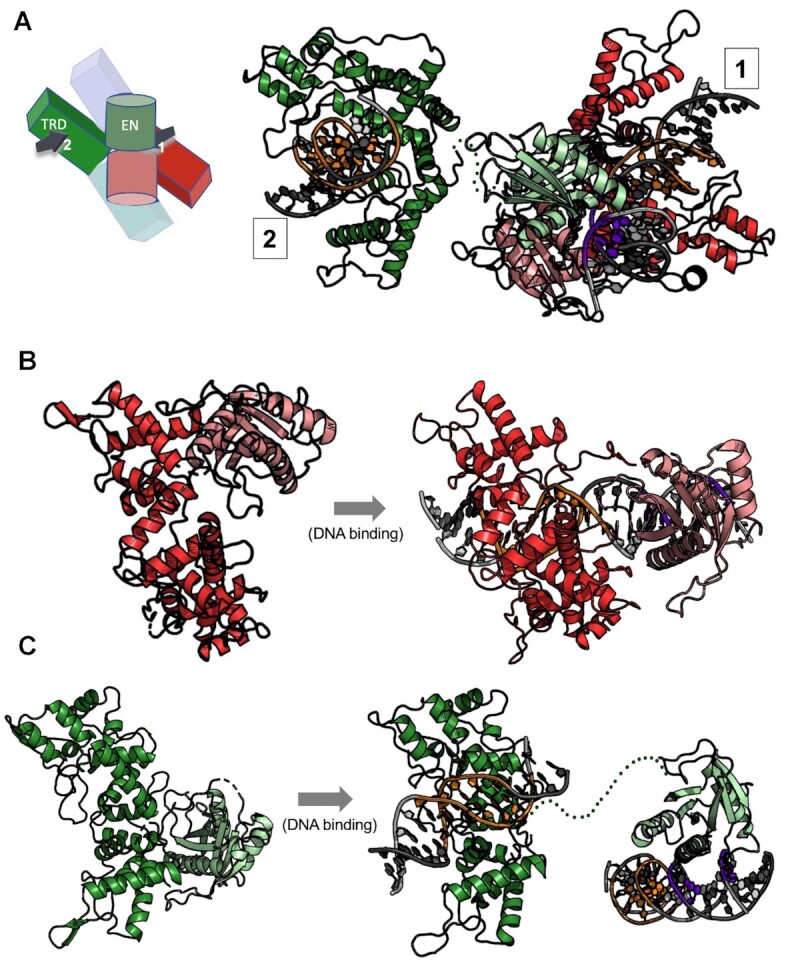
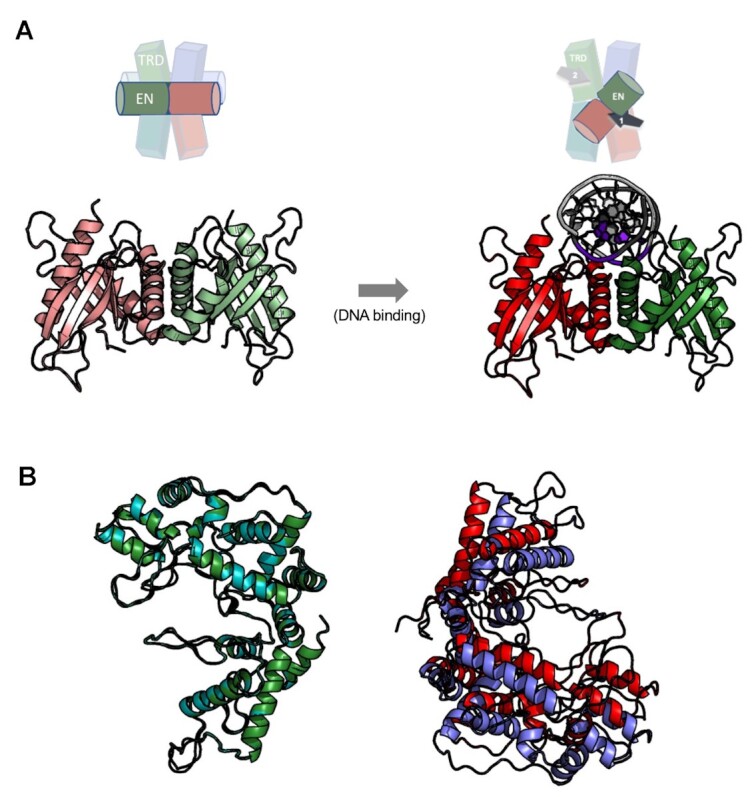
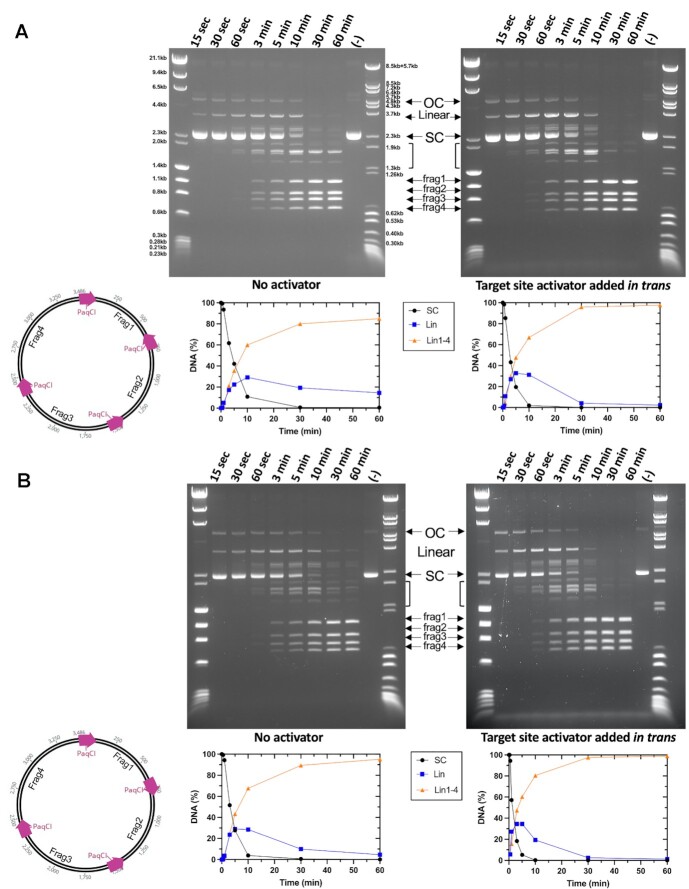
Type IIS restriction endonucleases contain separate DNA recognition and catalytic domains and cleave their substrates at well-defined distances outside their target sequences. They are employed in biotechnology for a variety of purposes, including the creation of gene-targeting zinc finger and TAL effector nucleases and DNA synthesis applications such as Golden Gate assembly. The most thoroughly studied Type IIS enzyme, FokI, has been shown to require multimerization and engagement with multiple DNA targets for optimal cleavage activity; however, details of how it or similar enzymes forms a DNA-bound reaction complex have not been described at atomic resolution. Here we describe biochemical analyses of DNA cleavage by the Type IIS PaqCI restriction endonuclease and a series of molecular structures in the presence and absence of multiple bound DNA targets. The enzyme displays a similar tetrameric organization of target recognition domains in the absence or presence of bound substrate, with a significant repositioning of endonuclease domains in a trapped DNA-bound complex that is poised to deliver the first of a series of double-strand breaks. PaqCI and FokI share similar structural mechanisms of DNA cleavage, but considerable differences in their domain organization and quaternary architecture, facilitating comparisons between distinct Type IIS enzymes.


Figures

Figure 1.
Figure 1.
Cleavage activity of PaqCI towards lambda phage DNA and plasmid substrates. (A) PaqCI demonstrates optimal activity at an equal to modest excess of enzyme binding sites to substrate target motifs, with an excess of enzyme to substrate leading to faster, but not more complete, cutting. Lambda phage DNA, with 12 PaqCI sites, are digested and quenched at various time points. Time points correspond to 10- and 60-min digests, with the concentration of enzyme monomers varied from 0.3 to 70 nM. The DNA recognition site concentration in all digests was 7.2 nM. At 60 min, enzyme concentrations greater than 1:1 enzyme-to-sites exhibit near-complete cleavage, while 0.5:1 enzyme-to-sites generates only slightly less cutting, and lesser amounts of enzyme result in more partial digestion. The molecular weight ladders Lambda-HindIII/PhiX174_HaeIII were used in panel a and b which spans 0.23 to 23.2 kb. This experiment was performed once. Concentrations are rounded to the nearest decimal place. (B) PaqCI cleaves DNA more efficiently when a short hairpin DNA duplex (inset in right gel panel of B) containing the enzyme's target site (underlined bases), is added to the reaction as a trans-activating factor. Lambda phage DNA was digested with variable concentrations of PaqCI from 1 to 70 nM (monomeric concentration) in the absence or presence of the trans activator (which was added at a 5:1 ratio to the PaqCI enzyme, i.e. 350 to 5 nM activator). All lanes correspond to 60-min digests. This experiment was performed once. Units were rounded to the nearest decimal place. (C) Further experiments examine the cleavage of plasmid substrates and demonstrate that PaqCI requires the interaction between multiple bound sites for cleavage. All lanes correspond to 60-min digests at fixed DNA concentrations, with variable enzyme (monomeric concentrations). The single-site substrate (11.4 nM sites) is cleaved far less efficiently than the 2-site substrates (22.8 nM sites). The difference in cleavage efficiency between single- or multiple-target plasmid substrates is eliminated by the presence of the activator DNA (5:1 ratio to enzyme) containing a target site added in trans. The key shows open circle (OC), single-cut linear (Lin), double-cut products (Lin1, Lin2), and super-coiled (SC) species. Two molecular weight ladders were used in these experiments: (i) Lambda-HindIII/PhiX174_HaeIII which spans 0.6 kb to 23.1 kb, and (ii) Lambda-BstEII/pBR322-MspII which spans 0.5–8.5 kb. This experiment was performed once.
Figure 2.
Figure 2.
Time-dependent digestion of plasmids with 2 PaqCI target sites with and without added activator indicate a sequential cleavage profile. (A) The no activator reaction (left gel) contained 22.8 nM DNA target sites and 17.2 nM of monomer PaqCI per 22.8nM DNA sites incubated in 50 μl buffer. The activator reaction (right gel) contained the same proportion of DNA to PaqCI with 80 nM of added activating oligoduplex (4.7:1 activator to PaqCI monomer) incubated in 50 μl buffer. To the left of the gel is a cartoon of the head-to-head substrate and reaction products shown in the gel. Digest time points were quenched at 0.25, 0.5, 1, 3, 5, 10, 30 and 60 min. The mobilities of the super coil (SC), and the cleaved linear (Lin, Lin1, and Lin2) forms of the plasmid are indicated in the middle key with arrows corresponding to their related bands. The intensities of each substrate and product band in the gels were quantitated using ImageJ (54) software and calculated as rough percentages to be shown graphically. The key in the middle shows supercoiled DNA substrate (purple circles, SC), linearized DNA (blue square, Lin), and double cut long and short linearized DNA (orange triangle, Lin1+2). Unlabeled bands exist in the control (time 0) lane before PaqCI begins cleaving and may correspond to a species of multimeric plasmid. The bands are degraded as the experiment progresses, but no new species are made. They are not necessary to the conclusion of the experiments and were left unlabeled for clarity of the visual and are not included in the quantitation. Two molecular weight ladders were used in this experiment; (i) Lambda-HindIII/PhiX174_HaeIII which spans 0.2–23.1 kb, and (ii) Lambda-BstEII/pBR322-MspII which spans 0.3–8.5 kb. This experiment was performed once. (B) Head-to-tail reactions were quenched at the time points indicated above each lane and experiments were conducted as in Panel A. This experiment was performed once.
Figure 3.
Figure 3.
Crystallographic structure and CryoEM analysis of DNA-free PaqCI apo-enzyme. (A, B) Ribbon diagrams and cartoon representation of DNA-free apo-enzyme structure and domain organization. Each of the four protein subunits are colored independently and similarly in the two depictions. The endonuclease (EN) domains are colored in a lighter shade than the target recognition domains (TRDs) they are associated with. In the cartoons, the TRDs are represented by rectangles and the EN domains are shown as cylinders. The ribbon diagrams on the left illustrate the full-length protein subunits. The ribbon diagrams on the right illustrate only the C-terminal TRDs; the N-terminal EN domains are removed for clarity. The ribbon diagrams in Panel b are turned 90° around the x-axis when compared with Panel A. (C) Independently generated CryoEM electron density map, at approximately 3.0 Å global resolution, of the DNA-free apo-enzyme closely match the crystallographic model of the enzyme tetramer, validating the quaternary structure and domain organization in a solution-based analysis free of crystallographic contacts and lattice artifacts. The views seen in Panel c are the same orientations as Panels A and B. Crystals, diffraction quality, additional structural features, and representative negative stain EM and CryoEM micrographs and class averages are further illustrated in Supplementary Figure S2.
Figure 4.
Figure 4.
CryoEM analysis of DNA-bound PaqCI. (A) Sequence and basepair arrangement of DNA duplexes used to form a DNA-bound enzyme complex. The duplex consists of 50 complementary basepairs and includes both the enzyme's 7 bp target site (red underlined bases) and its downstream cleavage sites on the top and bottom strands (black lines and arrows, 4 and 8 bp downstream from the final basepair of the target site). (B) CryoEM electron density corresponding to the DNA-bound PaqCI enzyme. Each of the four double-stranded DNA oligoduplex is independently colored to match that of its bound monomer shown in Panel C. The protein tetramer is colored in teal. The right image is rotated 90° around the y-axis and the endonuclease (EN) domains engaged for cleavage are boxed. (C) Cartoon representation and space filling model of DNA-bound enzyme structure and domain organization. The target recognition domains (TRDs) are represented by rectangles and the EN domains are shown as cylinders. DNA duplexes and their directionality (5’ to 3’) are denoted with black arrows in the cartoon. Each TRD is engaged with one DNA duplex, via contacts to bases and neighboring backbone atoms distributed across the target site. The downstream region of each bound DNA, including the sites of cleavage, extend away from the TRD tetramer. The DNA duplexes engaged to each protein dimer (DNA 1 and 2 on one side of the complex, and DNA 3 and 4 on the opposite side of the complex) are roughly parallel to one another, as indicated in the cartoon schematics. All four ENs have been released from their positions in the DNA-free apo-enzyme structure. Two ENs (from TRDs colored blue and teal bound to DNA 3 and 4) are disordered and are unobservable in the density map. The other two ENs (from TRDs colored red and green, cis and trans, bound to DNA 1 and 2) are observed to have undergone significant motions resulting in their engagement around the cleavage site on one bound DNA duplex. The two EN domains engaged for cleavage are boxed. Size exclusion chromatography traces of DNA-bound complexes, representative negative stain EM class averaged images, and electron density surrounding the DNA cleavage site complexes are further illustrated in Supplementary Figure S3.
Figure 5.
Figure 5.
Target site binding by PaqCI. (A) Cartoon representation of cis DNA-bound protein subunit and CryoEM electron density across the DNA target site bases. The protein ribbon is colored in a spectrum, with the N-terminal endonuclease (EN) domain in shades of blue, and the C-terminal target recognition domain (TRD) colored in shades of yellow, orange and red. Two calcium ions are shown as spheres. (B) Superposition of DNA-free and DNA-bound TRDs (pink and red, respectively) show a slight domain closure and ordering of several DNA-contacting loops. (C) A close up of one of the DNA-contacting loops of the TRD, displaying the base specific read out of the enzyme using primarily arginine residues.
Figure 6.
Figure 6.
Endonuclease motions and engagement on DNA. (A) Ribbon diagram and cartoon schematic of cis and trans protein subunits (as shown in Figure 4C) that position their respective endonuclease (EN) domains on both strands and cleavage positions on a single bound DNA duplex. In the cartoon schematic the DNA duplexes are drawn as arrows and numbered according to their protein subunit (cis = 1, trans = 2) (as shown in Figure 4C). EN domains are colored in a lighter shade than the target recognition domains (TRDs). The cleavage sites of the DNA duplex are shown in purple and the target site in orange. The 16 amino acid linker between the trans-acting EN domain and its C-terminal TRD is poorly ordered in the model and are represented in the figure as a dotted green line. (B) EN domain motion of the cis-acting endonuclease domain (red subunit in Figure 4C) acting on DNA 1. The EN domain (pink) swings about 180° about the axis to align with the cleavage site of DNA 1 to cut four bases from the target site while the TRD (red) stays fixed except for slight closure of the helices to bind DNA. Panel c: EN domain motion of the trans-acting endonuclease (green subunit in Figure 4C) acting on DNA 1. The TRD (green) is bound to a separate DNA duplex (DNA 2) than the one bound by the cis-acting EN and the trans-acting EN engage for cleavage (DNA 1). The EN domain (light green) reaches across the belt of TRDs to locate the cleavage site of the DNA 1 to cleave.
Figure 7.
Figure 7.
Contacts between EN domains in the enzyme tetramer in the presence and absence of a DNA cleavage site are conserved. (A) Endonuclease (EN) domain dimer organization in the DNA-free and DNA-bound PaqCI structures (left and right, respectively) shown as cartoon and ribbon diagrams. The dissociation of the two domains from their respective target recognition domains and subsequent re-association with the two DNA strands at the sites of cleavage result in nearly identical contacts and association between the two domains (backbone rmsd 0.8 Å). (B) Superposition of the ‘cleaving’ and ‘non-cleaving’ DNA-bound target recognition domains (colors correspond to Figure 4C) indicates that an asymmetry in the TRD tetrameric structure is induced when the cis- and trans-acting endonuclease domains associate with a DNA cleavage site associated with one of the two enzyme dimers.
Figure 8.
Figure 8.
Time-dependent digestion of plasmids with four PaqCI target sites indicate a sequential cleavage at individual sites. (A) Cleavage of a four-site substrate with and without an activator added in trans. The no activator reaction (left gel) contained 37 nM DNA target sites and 17.2 nM of monomer PaqCI per 37nM DNA target sites incubated in 50 μl buffer. The activator reaction (right gel) had the same substrate and PaqCI enzyme concentrations with 80 nM of added activating oligoduplex incubated in 50 μl buffer. Digest time points were quenched at 0.25, 0.5, 1, 3, 5, 10, 30 and 60 min. The mobilities of the super coil (SC), single-cut linear (Linear), intermediates (brackets), and the complete-cleavage linear (frag1, frag2, frag3 and frag4) forms of the plasmid are indicated in the middle key with arrows corresponding to their related bands. Intermediate bands correspond to a less than fully cleaved plasmid; either 1, 2 or 3 cleavage events at any of the sites available. To the left of the gels is a cartoon of the substrate and reaction products shown in the gel. The intensities of each substrate and product band in the gels were quantitated using ImageJ (54) software and calculated as rough percentages to be shown graphically. The key in the middle shows supercoiled DNA substrate (purple circles, SC), linearized DNA (blue square, Lin), and final product linearized DNA (orange triangle, frag1–4). Two molecular weight ladders were used in this experiment: (i) Lambda-HindIII/PhiX174_HaeIII which spans 0.2–23.1 kb, and (ii) Lambda-BstEII/pBR322-MspII which spans 0.3–8.5 kb. This experiment was performed once. (B) The cleavage of an alternative four-site substrate with and without an activator added in trans. Reactions were conducted as in Panel a. This experiment was performed once.
Figure 9.
Figure 9.
DNA pre-bound at all four sites in the PaqCI tetramer is cut sequentially. (A) Cleavage of a four-site plasmid substrate either pre-bound (left) or not pre-bound (right) with a 1:1 enzyme-binding-site to DNA-sites ratio. The pre-bound reaction (left gel) contained 37 nM DNA target sites and 37 nM of PaqCI per 37 nM DNA target sites in 50 μl buffer lacking Mg2+ ions. The enzyme was allowed to bind for 15 min at 37°C. An aliquot was removed (time 0) and the cleavage reaction was initiated by adding Mg2+ to 10 mM. The no pre-binding reaction (right gel) had the same substrate and PaqCI enzyme concentrations in normal buffer, with time points started upon enzyme addition. Digest time points were quenched at 0.25, 0.5, 1, 3, 5, 10, 30, 60 min. The mobilities of the super coil (SC), single-cut linear (Linear), intermediates (brackets), and the completely-cleaved linear (frag1, frag2, frag3 and frag4) forms of the plasmid are indicated in the middle key with arrows corresponding to their related bands. Intermediate bands correspond to a less than fully cleaved plasmid; single, dual, triple and complete cleavage events. To the left of the gels is a cartoon of the substrate and reaction products shown in the gel. Molecular weight ladders were Lambda-HindIII/PhiX174_HaeIII which spans 0.2–23.1 kb. These experiments were performed once. (B) Same reaction conditions and plasmid, as in Panel a right side, except that the PaqCI enzyme concentration was increased to 2:1 (74 nM enzyme to 37 nM DNA sites) or 4:1 (148 nM enzyme to 37 nM DNA sites) ratio of enzyme to DNA sites. These experiments were performed once.
Figure 10.
Figure 10.
Schematic of PaqCI’s mechanism as suggested by kinetic and structural data. The PaqCI tetramer is shown in the first panel in red and a double-stranded DNA in blue with a single target site. The point of the target site reflects the direction of the asymmetric target sequence. Each monomer (i.e. PaqCIA) of the oligomer is represented by an oval (TRD), a circle (EN domain), and a thin line connecting them (linker). PaqCI operates by scanning the DNA for four identical asymmetric target sites that are 7 bp long. Once it finds four identical target sites, it brings them together in a synapse using the TRDs. The binding of the four target sites triggers the release of all the EN domains from the TRDs. As the EN domains are free in solution, two find the cleavage site on one double-stranded DNA and engage that site for cleavage.

References

    1. Loenen W.A., Dryden D.T., Raleigh E.A., Wilson G.G.. Type I restriction enzymes and their relatives. Nucleic Acids Res. 2014; 42:20–44. - PMC - PubMed
    1. Pingoud A., Wilson G.G., Wende W.. Type II restriction endonucleases–a historical perspective and more. Nucleic Acids Res. 2014; 42:7489–7527. - PMC - PubMed
    1. Rao D.N., Dryden D.T., Bheemanaik S.. Type III restriction-modification enzymes: a historical perspective. Nucleic Acids Res. 2014; 42:45–55. - PMC - PubMed
    1. Koonin E.V., Makarova K.S.. Orgins and evolution of CRISPR-Cas systems. Philos. Trans. Roy. Soc. Lond, B. 2019; 374:20180087. - PMC - PubMed
    1. Egido J.E., Costa A.R., Aparicio-Maldonado C., Haas P.J., Brouns S.J.J.. Mechanisms and clinical importance of bacteriophage resistance. FEMS Microbiol. Rev. 2022; 46:1–16. - PMC - PubMed

Publication types

MeSH terms

Substances

LinkOut - more resources