. 2023 May 1;129(5):1045-1060.
doi: 10.1152/jn.00429.2022. Epub 2023 Mar 29.

Cholinergic depolarization recruits a persistent Ca2+ current in Aplysia bag cell neurons

Affiliations

Cholinergic depolarization recruits a persistent Ca2+ current in Aplysia bag cell neurons

Kelly H Lee et al. J Neurophysiol. .

Abstract

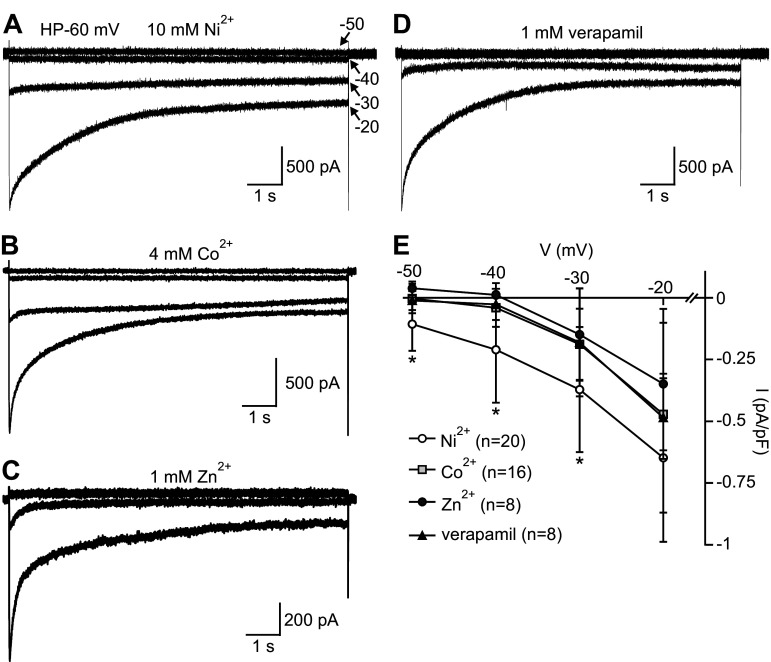
Many behaviors and types of information storage are mediated by lengthy changes in neuronal activity. In bag cell neurons of the hermaphroditic sea snail Aplysia californica, a transient cholinergic synaptic input triggers an ∼30-min afterdischarge. This causes these neuroendocrine cells to release egg laying hormone and elicit reproductive behavior. When acetylcholine is pressure-ejected onto a current-clamped bag cell neuron, the evoked depolarization is far longer than the current evoked by acetylcholine under voltage clamp, suggesting recruitment of another conductance. Our earlier studies found bag cell neurons to display a voltage-dependent persistent Ca2+ current. Hence, we hypothesized that this current is activated by the acetylcholine-induced depolarization and sought a selective Ca2+ current blocker. Rapid Ca2+ current evoked by 200-ms depolarizing steps in voltage-clamped cultured bag cell neurons demonstrated a concentration-dependent sensitivity to Ni2+, Co2+, Zn2+, and verapamil but not Cd2+ or ω-conotoxin GIVa. Leak subtraction of Ca2+ current evoked by 10-s depolarizing steps using the IC100 (concentration required to eliminate maximal current) of Ni2+, Co2+, Zn2+, or verapamil revealed persistent Ca2+ current, demonstrating persistent current block. Only Co2+ and Zn2+ did not suppress the acetylcholine-induced current, although Zn2+ appeared to impact additional channels. When Co2+ was applied during an acetylcholine-induced depolarization, the amplitude was reduced; furthermore, protein kinase C activation, previously established to enhance the persistent Ca2+ current, extended the depolarization. Therefore, the persistent Ca2+ current sustains the acetylcholine-induced depolarization and may translate brief cholinergic input into afterdischarge initiation. This could be a general mechanism of triggering long-term change in activity with a short-lived input.NEW & NOTEWORTHY Ionotropic acetylcholine receptors mediate brief synaptic communication, including in bag cell neurons of the sea snail Aplysia. However, this study demonstrates that cholinergic depolarization can open a voltage-gated persistent Ca2+ current, which extends the bag cell neuron response to acetylcholine. Bursting in these neuroendocrine cells results in hormone release and egg laying. Thus, this emphasizes the role of ionotropic signaling in reaching a depolarized level to engage Ca2+ influx and perpetuating the activity necessary for behavior.

Keywords: acetylcholine receptor; mollusk; peptidergic neuron; prolonged depolarization; reproduction.


Conflict of interest statement

No conflicts of interest, financial or otherwise, are declared by the authors.

Figures

None
Graphical abstract
Figure 1.
Figure 1.
Cholinergic current and depolarization are kinetically distinct. Two separate cultured bag cell neurons are bathed in normal artificial seawater (nASW) and subjected to either sharp-electrode current clamp (CC) with a K+-acetate-based pipette solution or whole cell voltage clamp (VC) with a K+-Asp-based intracellular solution. Top: a 2-s pressure ejection (at arrow) of 1 mM acetylcholine (ACh) evokes depolarization and bursting from a resting potential of −61 mV under current clamp. The response does not recover until the end of the trace (∼8 min). Bottom: the same stimulus in a different neuron under voltage clamp at −60 mV causes a transient inward current that fully recovers by ∼1.5 min. Timescale applies to both top and bottom. Left inset, the time to 75% recovery of the current is significantly faster than the depolarization (t5.75 = 6.06; *P = 0.001; unpaired Student’s t test, Welch corrected). Right inset, a cultured bag cell neuron with a whole cell recording electrode and a pressure-ejection pipette. Numbers within the bars are n values that reflect number of neurons.
Figure 2.
Figure 2.
Rapid, voltage-dependent Ca2+ currents in bag cell neurons. A: a neuron is whole cell voltage clamped in Ca2+-Cs+-tetraethylammonium artificial seawater with Cs+-Asp intracellular solution to isolate Ca2+ currents. From a holding potential of −60 mV, 200-ms steps to +60 mV in 10-mV increments (top) evoke rapid-onset, voltage-dependent Ca2+ current (bottom). Capacitance artifact at onset is truncated for display. B: summary of peak current (I) normalized to capacitance and plotted against the step voltages (V) from A. Onset is −30 mV, with peak at +10 mV and reversal of +57.5 mV. C: summary of conductance normalized to maximal (G/Gmax) at +30 mV and plotted against step voltage. Conductance was derived from peak current divided by the driving force, i.e., step voltage minus reversal potential. V1/2 indicates the voltage at which conductance is half-maximum, and k reflects the slope factor.
Figure 3.
Figure 3.
Co2+, Zn2+, or verapamil reduce the Ca2+ current in a concentration-dependent manner. A, C, and E: separate bag cell neurons are voltage-clamped at −60 mV in Ca2+-Cs+-tetraethylammonium artificial seawater with Cs+-Asp intracellular solution and given a step to +10 mV for 100 or 200 ms. The step is repeated in the presence of Co2+ (A), Zn2+ (C), or verapamil (E) at the indicated concentrations. Zn2+ is tested at 1 concentration per cell. Co2+ or verapamil is added incrementally, with a saturating concentration always being added at the end after some combination of lower concentrations. Order of potency is: Co2+ > Zn2+ > verapamil. B, D, and F: Co2+ (B), Zn2+ (D), and verapamil (F) dose-response curves. Peak current (ICa) evoked in Co2+, Zn2+, or verapamil is divided by the corresponding control current, plotted against the applied concentration, and fit with an asymmetric sigmoidal curve to obtain the IC50 and Hill coefficient.
Figure 4.
Figure 4.
Effect of select divalent metals or verapamil on Ca2+ current voltage dependence. A: Ca2+ currents from separate neurons evoked by 200-ms pulses from −60 mV [holding potential (HP)] to +60 mV in 10-mV increments while exposed to the IC100 (concentration required to eliminate maximal current) of Ni2+ (top; 10 mM), Co2+ (top middle; 4 mM), Zn2+ (bottom middle; 1 mM), or verapamil (bottom; 1 mM). Capacitance artifacts are truncated for display. Scale bars apply to all traces. B: average peak Ca2+ current (I) plotted against step voltage (V), along with all parallel control currents pooled for comparison. The divalent metals and verapamil cause a complete or a near-complete block with no observable voltage dependence to the inhibition, except to a small extent with Zn2+. C–E: activation curves of Ca2+ current under control conditions and in the presence of the IC50 of Co2+ (1 mM; C), verapamil (300 µM; D), or Zn2+ (300 µM; E). The activation curve in Co2+ is shifted to the right compared with control, as indicated by the more positive half-maximal voltage of activation (V1/2). Conversely, the activation curve in verapamil is shifted moderately to the left vs. control, as indicated by the more negative V1/2. The impact of Zn2+ on activation is negligible. I/Imax, Ca2+ current normalized to maximal current (at +10 mV).
Figure 5.
Figure 5.
Cd2+ and ω-conotoxin GIVa (ω-ctx) are ineffective Ca2+ current blockers. A: a bag cell neuron is dialyzed with Cs+-Asp-based intracellular solution, voltage-clamped at −60 mV [holding potential (HP)], and exposed to cumulative doses of Cd2+ (at steps) in Ca2+-Cs+-tetraethylammonium artificial seawater; 3 mM resulted in a marked increase in holding current (n = 4). Inset, at an intermediate concentration of 700 µM Cd2+ weakly inhibits the current density (nA/nF). V, voltage. B: summary of peak Ca2+ current normalized to capacitance and plotted against step voltage in control or neurons pretreated with 8 µM ω-ctx. Peak Ca2+ current density in the presence of ω-ctx (●) is similar to control (○), although the maximum current is shifted to the right. C: activation curves of the Ca2+ current in the absence and presence of ω-ctx. Current is normalized to that at +10 mV (I/Imax), plotted against step voltage, and fit with a Boltzmann function. The activation curve in conotoxin is shifted to the right as indicated by the more positive half-maximal voltage of activation (V1/2).
Figure 6.
Figure 6.
Persistent voltage-activated Ca2+ current is revealed by select divalent metals or verapamil. A–D: applying the IC100 (concentration required to eliminate maximal current) of Ni2+ (10 mM; A), Co2+ (4 mM; B), Zn2+ (1 mM; C), or verapamil (1 mM; D) in Ca2+-Cs+-tetraethylammonium external reveals Ca2+ currents evoked by 10-s square pulses from a −60 mV holding potential (HP) to −50 mV through to −20 mV in 10-mV increments in neurons dialyzed with Cs+-Asp-based intracellular solution. Leak currents are eliminated by delivering the voltage steps before and after the block and then subtracting postblock from preblock current. At ≥ −30 mV, steady-state, tonic inward current is evident. E: summary graph of mean persistent Ca2+ current normalized to cell capacitance. Current is calculated as the mean of the last 1 s of the 10-s steps. Ni2+ reveals significantly more Ca2+ current relative to the other blockers at −50 mV (F3,48 = 9.112, P < 0.0001, 1-way ANOVA; P = 0.0007 Co2+ vs. Ni2+, P = 0.0151 verapamil vs. Ni2+, P = 0.0002 Zn2+ vs. Ni2+, Dunnett’s multiple comparisons test) and −40 mV (H = 16.842, df = 3; P = 0.0008, Kruskal-Wallis 1-way ANOVA; P = 0.01495 Co2+ vs. Ni2+, P = 0.0259 verapamil vs. Ni2+, P = 0.0012 Zn2+ vs Ni2+, Dunn’s multiple comparisons test), as well as Zn2+ and Co2+ at −30 mV (F3,48 = 3.633, P = 0.0192, 1-way ANOVA; P = 0.0337 Co2+ vs. Ni2+, P = 0.0927 verapamil vs. Ni2+, P = 0.0399 Zn2+ vs. Ni2+, Dunnett's multiple comparisons test). No significant effects were detected between the blockers at −20 mV (F3,48 = 2.320, P = 0.0871, 1-way ANOVA).
Figure 7.
Figure 7.
Cholinergic-like depolarizing waveforms cause Ca2+ influx. A, top: voltage-ramp waveform mimicking 1 of 2 typical acetylcholine-induced depolarizations (waveform 1) is biphasic (see results text for details). The waveform is applied to a voltage-clamped bag cell neuron bathed in Ca2+-Cs+-tetraethylammonium artificial seawater (ASW) and dialyzed with Cs+-Asp-based intracellular saline. Leak currents are eliminated by delivering the waveform before and after 4 mM Co2+ block and then subtracting the postblock current from preblock. Bottom: the resulting inward Ca2+ current. Scale bars apply to both A and B. B, top: voltage-ramp waveform of the second type of acetylcholine-induced depolarization (waveform 2), which is essentially monophasic. Bottom: the evoked Ca2+ current is markedly larger compared with that induced by waveform 1. C: average peak current (top) and Ca2+ influx (bottom), calculated as area above the curve, both normalized to cell capacitance, during waveform 1 or waveform 2. The peak current density is not significantly different between waveform 1 and waveform 2 (t1.11 = 5.30; P = 0.3142; unpaired Student’s t test, Welch corrected). However, waveform 2 elicits significantly greater total Ca2+ influx than waveform 1 (t3.13 = 6.05; *P = 0.0201; unpaired Student’s t test). D: changes in intracellular Ca2+ quantified by 340/380 nm ratiometric imaging. Neurons are bathed in normal ASW and dialyzed with K+-Asp-based intracellular saline containing 1 mM fura PE3. Ca2+ influx is evoked by waveform 1, and once the Ca2+ returns to baseline waveform 2 is applied, which produces a markedly larger change. E: summary of percent change in fluorescence from baseline. Waveform 2 elicits a significantly greater increase in intracellular Ca2+ than waveform 1 (U4,4 = 9.0; *P = 0.0286; Mann–Whitney U test). Numbers within the bars are n values that reflect number of neurons.
Figure 8.
Figure 8.
The acetylcholine-induced current shows differential sensitivity to hexamethonium, Ni2+, verapamil, Zn2+, and Co2+. A: a bag cell neuron is voltage-clamped at −60 mV [holding potential (HP)], bathed in normal artificial seawater, and dialyzed with K+-Asp-based intracellular solution. The neuron is pressure-ejected with 1 mM acetylcholine (ACh) for 2 s (at arrow). The resulting current has a rapid onset and lasts <1 min. After a 10-min recovery period, acetylcholine is applied a second time to the same cell; however, the amplitude of the second current is reduced to ∼60% of the first. B: extracellular application of the ionotropic acetylcholine receptor blocker hexamethonium (500 µM), 10 min after the first acetylcholine application, eliminates the second current. C and D: delivering the IC50 of the Ca2+ current blockers Ni2+ (1.5 mM; C) and verapamil (300 µM; D) also reduces the second acetylcholine-induced current more than control. E: delivering the IC50 of Co2+ (1.0 mM) does not suppress the second acetylcholine-induced current compared with control. F: average fraction of remaining current (IACh) evoked by the second vs. first acetylcholine application. Compared with control (cntl), there is significantly less residual current in the presence of all blockers except for 1 mM Co2+ (F6,51 = 2.667, P < 0.0001, 1-way ANOVA; P < 0.0001 for cntl vs. hex, Ni2+, verapamil (vera), or 4 mM Co2+, P = 0.8250 for cntl vs. 1 mM Co2+, Dunnett’s multiple comparisons test). G, left: a 5-s microperfusion of 1 mM acetylcholine (at bar) to the soma of bag cell neuron voltage-clamped at −60 mV evokes a current that desensitizes by ∼60% when acetylcholine is flowed a second time 10 min later. Right: superfusion of Zn2+ starting ∼2 min before the second application of acetylcholine does not alter the extent of desensitization compared with control. H: summary data demonstrate no significant difference between fraction of remaining acetylcholine-induced current in the absence or presence of Zn2+ (t1.71 = 11.97; P = 0.1129; unpaired Student’s t test, Welch corrected). Numbers within the bars are n values that reflect number of neurons.
Figure 9.
Figure 9.
The prolonged acetylcholine-induced depolarization is suppressed by Co2+. A: a bag cell neuron is sharp-electrode current-clamped to −60 mV with constant bias current while being perfused with normal artificial seawater (nASW). Top: a 5-s perfusion of 1 mM acetylcholine (ACh; at bar) in nASW causes an ∼30-mV depolarization with action potentials that lasts ∼2 min. Bottom: in a different neuron, perfusing 1 mM Co2+ ∼5 s after acetylcholine causes the depolarization to subside more rapidly. B, top: summary data show that the time to 75% recovery in neurons exposed to acetylcholine alone is significantly different from Co2+ after acetylcholine (t2.70 = 10.53; *P = 0.0214; unpaired Student’s t test). Bottom: average peak depolarization amplitude is not significantly different between neurons superfused with acetylcholine and those receiving Co2+ after acetylcholine (t0.84 = 13.45; P = 0.4178; unpaired Student’s t test). C, top: a 2-s pressure ejection of acetylcholine in nASW results in an ∼27-mV depolarization with ∼20 spikes lasting ∼1 min. Bottom: in a different neuron pretreated with 100 nM phorbol 12-myristate 13-acetate (PMA) for ∼20 min, acetylcholine evokes an ∼38-mV depolarization with ∼140 spikes lasting ∼5 min. D, top: group data establish that time to 75% recovery in control neurons returns to baseline significantly faster than in PMA-pretreated neurons (t3.43 = 4.05; *P = 0.026; unpaired Student’s t test). Bottom: mean number of action potentials in neurons with PMA is higher than that of control during acetylcholine-induced depolarization (t3.72 = 5.46; *P = 0.0117; unpaired Student’s t test). Numbers within the bars are n values that reflect number of neurons.

References

    1. Haj-Dahmane S, Andrade R. Muscarinic activation of a voltage-dependent cation nonselective current in rat association cortex. J Neurosci 16: 3848–3861, 1996. doi:10.1523/JNEUROSCI.16-12-03848.1996. - DOI - PMC - PubMed
    1. Egorov AV, Hamam BN, Fransén E, Hasselmo ME, Alonso AA. Graded persistent activity in entorhinal cortex neurons. Nature 420: 173–178, 2002. doi:10.1038/nature01171. - DOI - PubMed
    1. Zhang Z, Reboreda A, Alonso A, Barker PA, Séguéla P. TRPC channels underlie cholinergic plateau potentials and persistent activity in entorhinal cortex. Hippocampus 21: 386–397, 2011. doi:10.1002/hipo.20755. - DOI - PubMed
    1. Baker AL, O’Toole RJ, Gulledge AT. Preferential cholinergic excitation of corticopontine neurons. J Physiol 596: 1659–1679, 2018. doi:10.1113/JP275194. - DOI - PMC - PubMed
    1. Fu X, Ye H, Jia H, Wang X, Chomiak T, Luo F. Muscarinic acetylcholine receptor-dependent persistent activity of layer 5 intrinsic-bursting and regular-spiking neurons in primary auditory cortex. J Neurophysiol 122: 2344–2353, 2019. doi:10.1152/jn.00184.2019. - DOI - PubMed

Publication types

Grants and funding

LinkOut - more resources