. 2023 Mar 29;118(1):13.
doi: 10.1007/s00395-023-00984-5.

Membrane remodelling triggers maturation of excitation-contraction coupling in 3D-shaped human-induced pluripotent stem cell-derived cardiomyocytes

Affiliations

Membrane remodelling triggers maturation of excitation-contraction coupling in 3D-shaped human-induced pluripotent stem cell-derived cardiomyocytes

Fatemeh Kermani et al. Basic Res Cardiol. .

Abstract

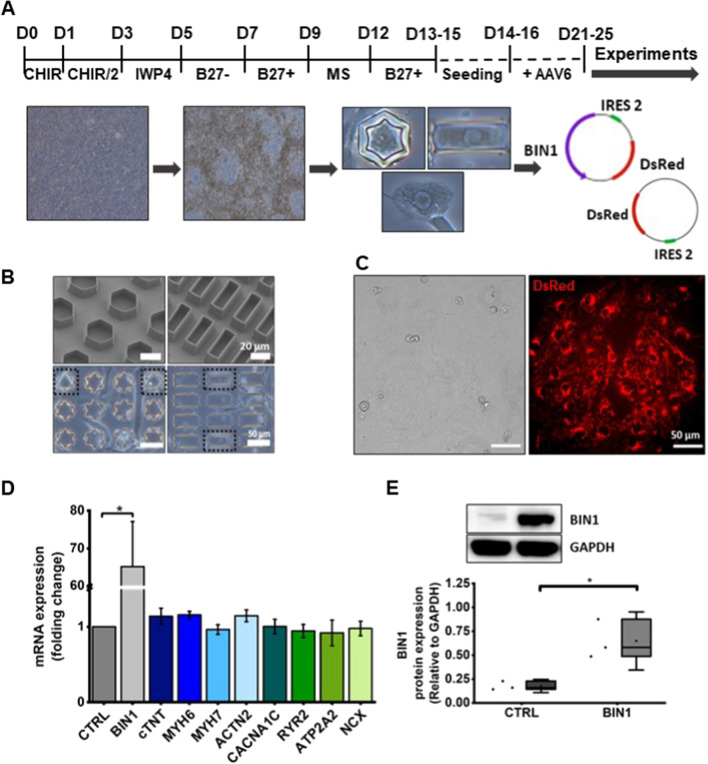
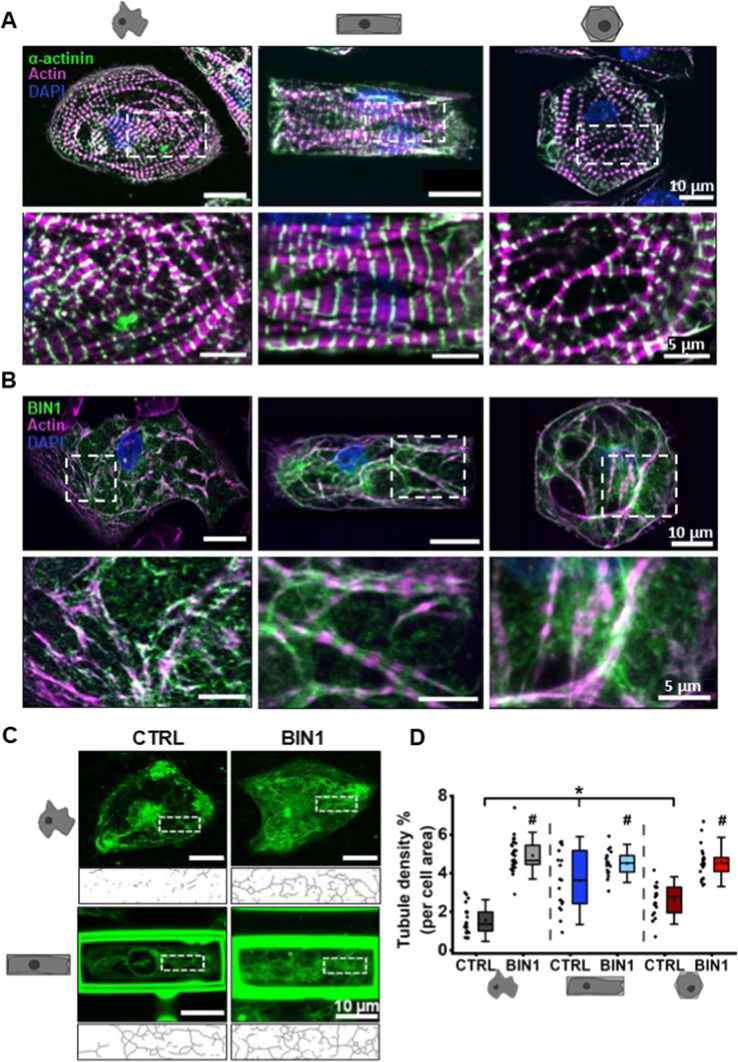
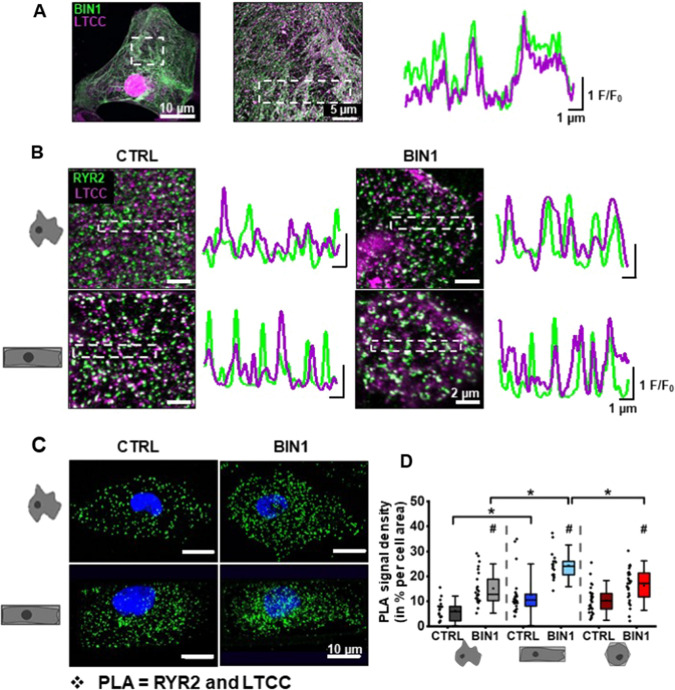
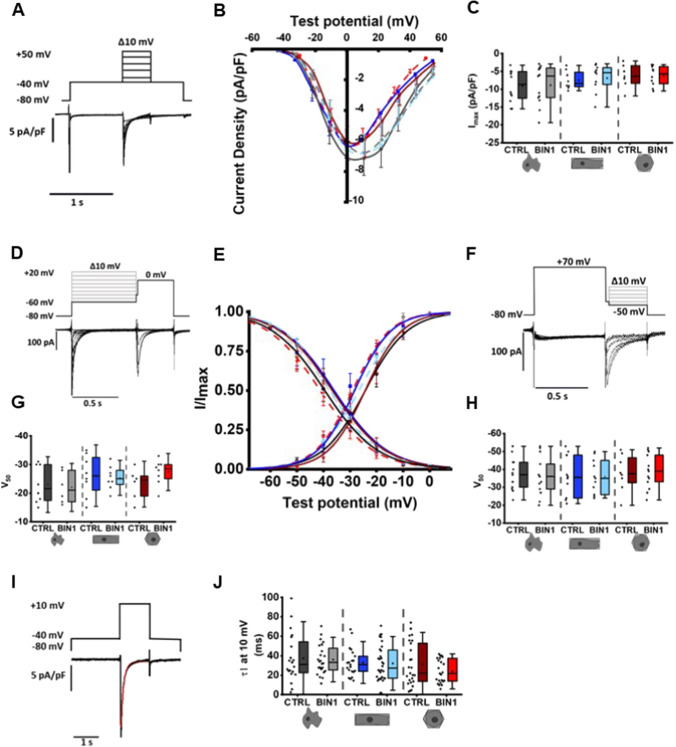
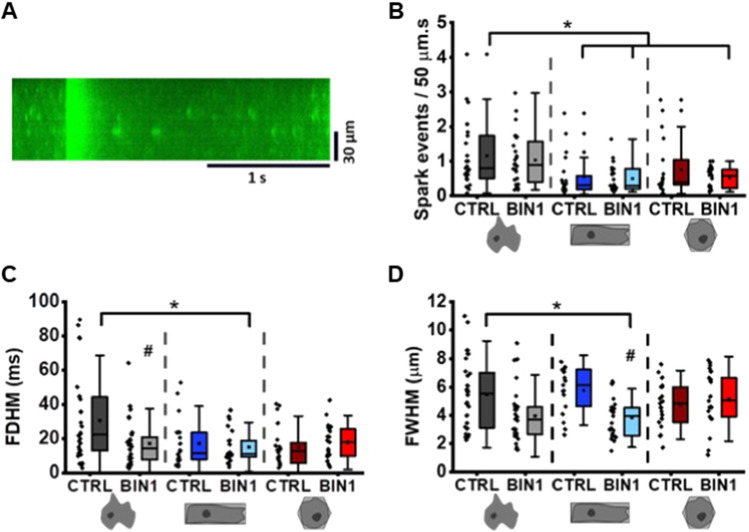
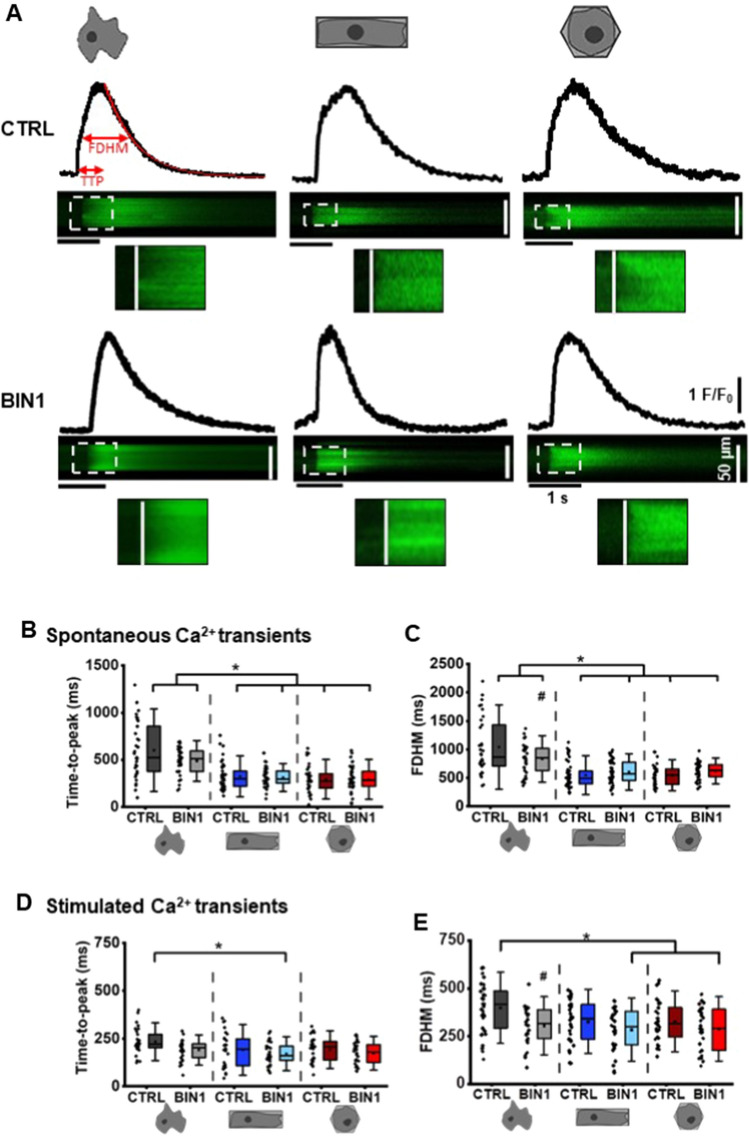
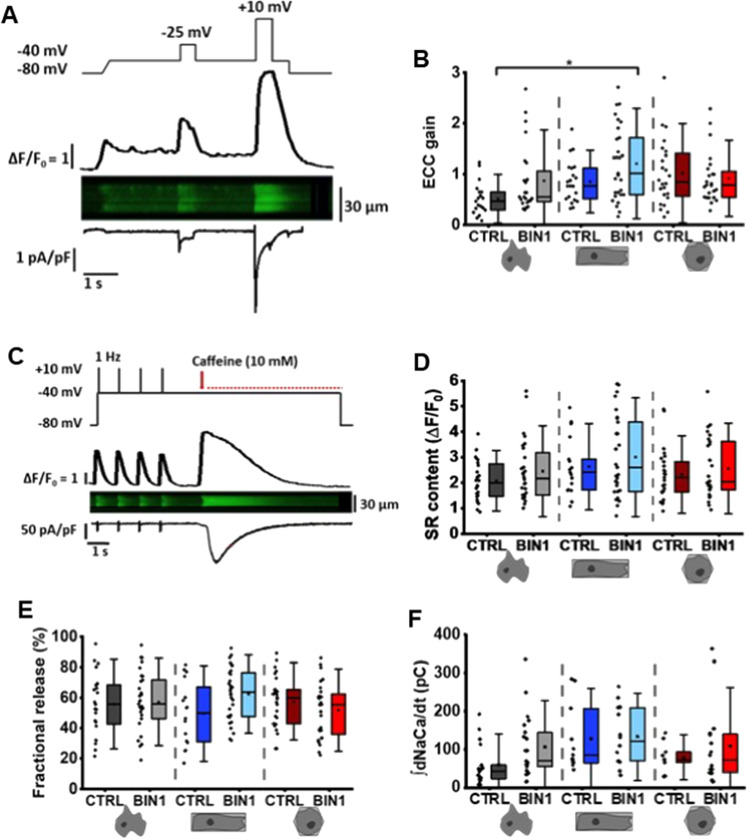
The prospective use of human-induced pluripotent stem cell-derived cardiomyocytes (hiPSC-CM) for cardiac regenerative medicine strongly depends on the electro-mechanical properties of these cells, especially regarding the Ca2+-dependent excitation-contraction (EC) coupling mechanism. Currently, the immature structural and functional features of hiPSC-CM limit the progression towards clinical applications. Here, we show that a specific microarchitecture is essential for functional maturation of hiPSC-CM. Structural remodelling towards a cuboid cell shape and induction of BIN1, a facilitator of membrane invaginations, lead to transverse (t)-tubule-like structures. This transformation brings two Ca2+ channels critical for EC coupling in close proximity, the L-type Ca2+ channel at the sarcolemma and the ryanodine receptor at the sarcoplasmic reticulum. Consequently, the Ca2+-dependent functional interaction of these channels becomes more efficient, leading to improved spatio-temporal synchronisation of Ca2+ transients and higher EC coupling gain. Thus, functional maturation of hiPSC-cardiomyocytes by optimised cell microarchitecture needs to be considered for future cardiac regenerative approaches.

Keywords: 3D reshaping; BIN1; Excitation–contraction coupling; Maturation; hiPSC cardiomyocytes; t-tubules.


Conflict of interest statement

None to declare.

Figures

Fig. 1
Fig. 1
BIN1 is successfully expressed in transduced hiPSC-CM. A Schematic timeline of cardiogenic differentiation and subsequent experimental design. B 3D scaffolds in hexagonal (left images) and cuboid (right images) shapes. C Representative images of bright field (left image) and dsRed expression (right image) of hiPSC-CM. D Quantification of mRNA expression levels relative to control, measured by real-time qRT-PCR (N = 4–5, *p < 0.05 for BIN1 vs. CTRL). The list of primers can be found in Table S1. E Immunoblot of BIN1 protein expression in transduced hiPSC-CM. Quantification of the change in protein abundance of BIN1 (N = 3, *p < 0.05). Data are presented as mean ± SE (bar graph) or mean ± SD (box blot), significance tested by Student’s t test
Fig. 2
Fig. 2
3D reshaping and BIN1 overexpression lead to adaptations in cell morphology and microarchitecture. Immunolabeling of α-actinin (green, A), BIN1 (green, B), actin (magenta) and DNA (DAPI, blue) in BIN1-expressing, non-patterned, cuboid and hexagonally shaped hiPSC-CM. White boxes indicate the area of magnification. C Representative images of confocal live cell imaging of the sarcolemma using di-8-ANEPPS to visualise the tubular membrane network. White boxes illustrate the skeletonized images of the analysed regions of interest (ROI). D Statistical analysis of the tubule density within the ROIs in different experimental groups of hiPSC-CM. Two-way ANOVA was conducted to examine the synergistic effect of BIN1 expression and 3D reshaping on tubule density. N = 4, n = 19–31 cells; *indicates comparison between different shapes, and # between BIN1-overexpressing and shape control cells; p < 0.05. Data are presented as a box plot and whiskers show SD
Fig. 3
Fig. 3
Membrane remodelling reorganises the expression pattern of Ca2+ handling proteins and induces dyad formation. A Representative confocal images of the expression pattern of BIN1 (green) and LTCC (magenta) in a BIN1-expressing hiPSC-CM (left image; centre image: magnification of the ROI) and intensity profiles of the depicted ROI in the centre image. B Immunolabelling of RYR2 (green) and LTCC (magenta) and intensity profiles from the ROIs (white boxes) demonstrating spatial alignment of both ion channels relative to each other. C Representative confocal images from PLA: green signals indicate the sites of interaction between RYR2 and LTCC in dyad microdomains (< 40 nm). Nuclei are stained in blue. D PLA signal density was measured as a fraction of cell area occupied by fluorescence signals. Two-way ANOVA was conducted to examine the effect of BIN1 expression and 3D reshaping on LTCC-RyR2 cluster density. N = 4, n = 18–30 cells; * indicates comparison between different shapes; # indicates comparison between BIN1-overexpressing and shape control cells; p < 0.05. Data are presented as a box plot and whiskers show SD
Fig. 4
Fig. 4
Characterisation of ICaL properties in reshaped BIN1-overexpressing hiPSC-CM. A, D, F, I Representative ICaL traces triggered by the indicated voltage protocols. B Current–voltage relationship, E voltage-dependent steady-state activation and inactivation curves. C Analysis of peak current (Imax, N = 4–5, n = 7–13 cells). G, H Analysis of half-maximal voltage-dependent (V1/2) activation and inactivation (N = 4–5, n = 6–13 cells). I, J Analysis of the time constant of the Ca2+-dependent inactivation of ICaL (τ1) at + 10 mV fitted with a bi-exponential function (N = 7–8, n = 20–32 cells). Two-way ANOVA revealed no significant differences between the experimental groups. Data are presented as a box plot and whiskers show SD
Fig. 5
Fig. 5
Characterisation of Ca2+ spark events in reshaped BIN1-overexpressing hiPSC-CM. A Representative line-scan image of a spontaneous Ca2+ transient and Ca2+ sparks. Analysis of the number of spark events per 50 µm and second (B), full duration at half maximum (FDHM, C) and full width at half maximum (FWHM, D) in the different groups of hiPSC-CM. Statistical differences were tested by two-way ANOVA (N = 3, n = 17–30 cells); *indicates comparison between different shapes; # indicates comparison between BIN1-overexpressing and shape control cells; p < 0.05. Data are presented as a box plot and whiskers show SD
Fig. 6
Fig. 6
Maturation of Ca2+ transient dynamics in 3D-reshaped BIN1-overexpressing hiPSC-CM. A Representative line-scan images and plot profiles of spontaneous Ca2+ transients in the different experimental groups. Analysis of time-to-peak (TTP; B, D), and full duration half maximum (FDHM; C, E) of spontaneous and stimulated Ca2+ transients, respectively. Statistical differences were tested by two-way ANOVA (N = 3–4, n = 33–49 cells); *indicates comparison between different shapes; #indicates comparison between BIN1-overexpressing and shape control cells; p < 0.05. Data are presented as a box plot and whiskers show SD
Fig. 7
Fig. 7
EC coupling gain is improved in cuboid BIN1-expressing hiPSC-CM. A Voltage protocol for ICaL stimulation (upper panel), Ca2+ transients with corresponding line-scan image and line profile (middle panel) and recordings of ICaL (lower traces). B EC coupling gain measured at − 25 mV (N = 7–8, n = 19–29 cells) and distribution curves. C Stimulation protocol (upper panel), Ca2+ transient (line-scan and line profile, middle panel), and current traces (lower traces) to measure fractional release. Evaluation of (D) SR content, E fractional release and F NCX activity in hiPSC-CM (N = 5–6, n = 9–24 cells). Statistical comparison by two-way ANOVA. Data are presented as a box plot and whiskers show SD. *indicates comparison between different shapes; # indicates comparison between BIN1-overexpressing and control cells; p < 0.05

References

    1. Balijepalli RC, Lokuta AJ, Maertz NA, Buck JM, Haworth RA, Valdivia HH, Kamp TJ. Depletion of T-tubules and specific subcellular changes in sarcolemmal proteins in tachycardia-induced heart failure. Cardiovasc Res. 2003;59:67–77. doi: 10.1016/S0008-6363(03)00325-0. - DOI - PubMed
    1. Brette F, Orchard C. T-tubule function in mammalian cardiac myocytes. Circ Res. 2003;92:1182–1192. doi: 10.1161/01.RES.0000074908.17214.FD. - DOI - PubMed
    1. De La Mata A, Tajada S, O’Dwyer S, Matsumoto C, Dixon RE, Hariharan N, Moreno CM, Santana LF. BIN1 induces the formation of T-tubules and adult-like Ca 2+ release units in developing cardiomyocytes. Stem Cells. 2019;37:54–64. doi: 10.1002/stem.2927. - DOI - PMC - PubMed
    1. Eisner DA, Caldwell JL, Kistamás K, Trafford AW. Calcium and excitation-contraction coupling in the heart. Circ Res. 2017;121:181–195. doi: 10.1161/CIRCRESAHA.117.310230. - DOI - PMC - PubMed
    1. Fabiato A. Calcium-induced release of calcium from the cardiac sarcoplasmic reticulum. Am J Physiol - Cell Physiol. 1983;245:C1–C14. doi: 10.1152/ajpcell.1983.245.1.c1. - DOI - PubMed

Publication types

MeSH terms

Substances

LinkOut - more resources