. 2023 Jul 25;7(14):3624-3636.
doi: 10.1182/bloodadvances.2022009564.

Postazacitidine clone size predicts long-term outcome of patients with myelodysplastic syndromes and related myeloid neoplasms

Affiliations

Postazacitidine clone size predicts long-term outcome of patients with myelodysplastic syndromes and related myeloid neoplasms

Yasuhito Nannya et al. Blood Adv. .

Abstract

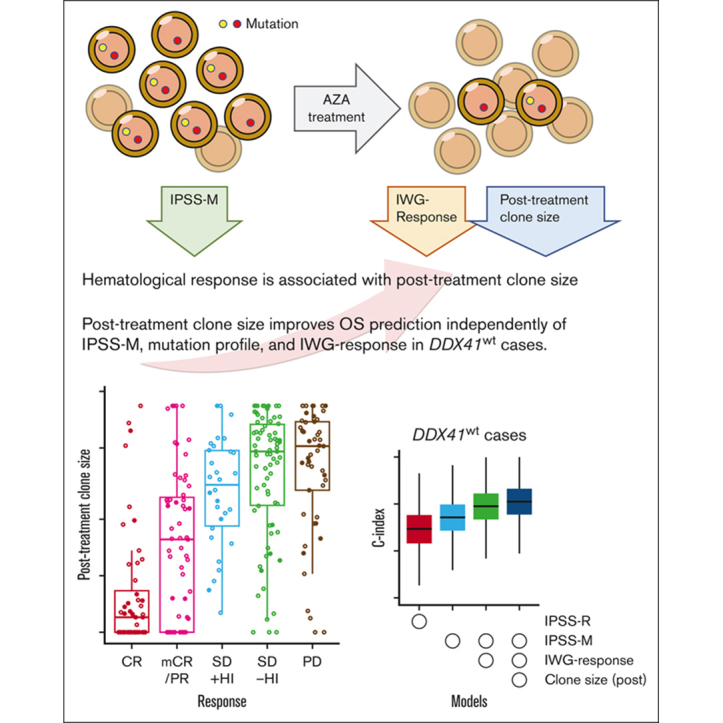
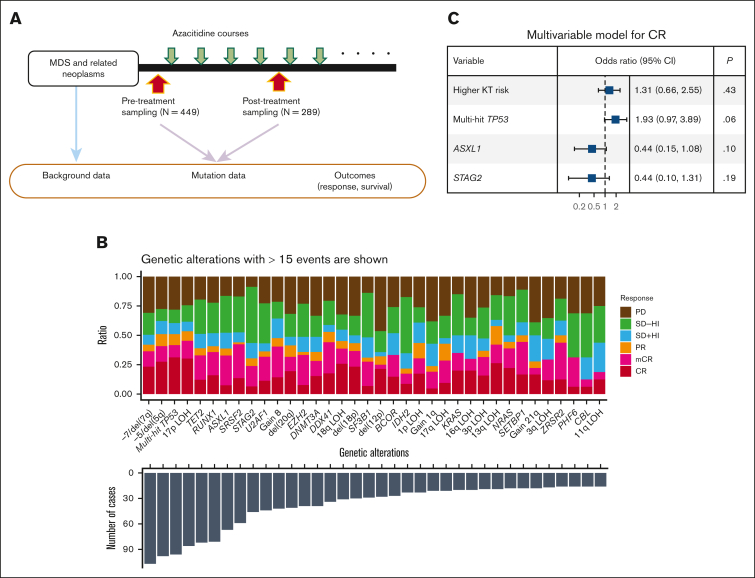
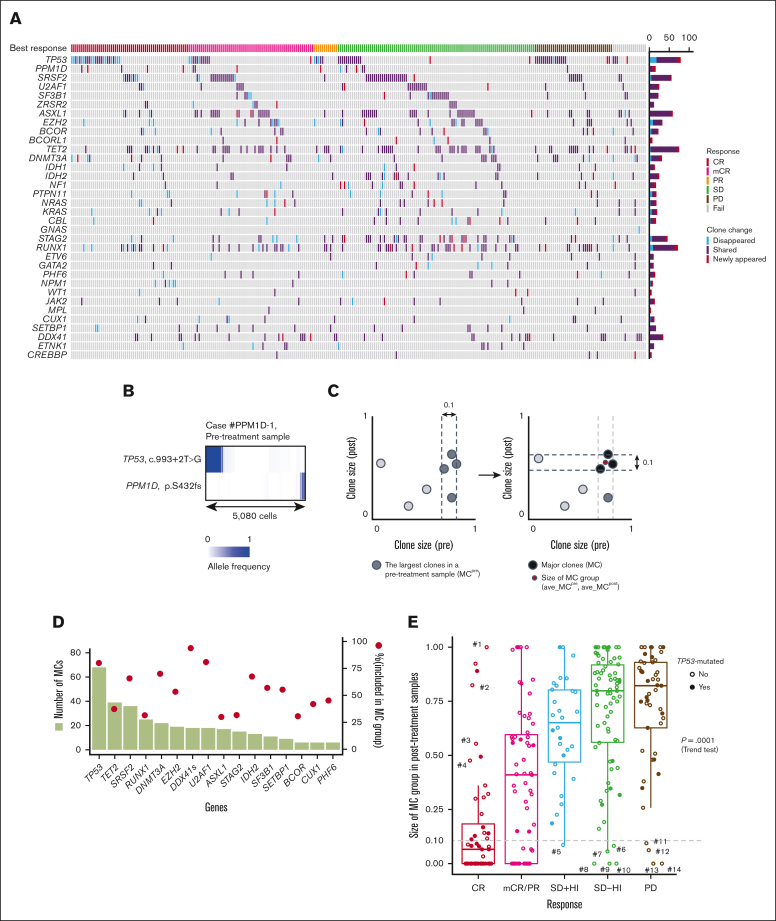
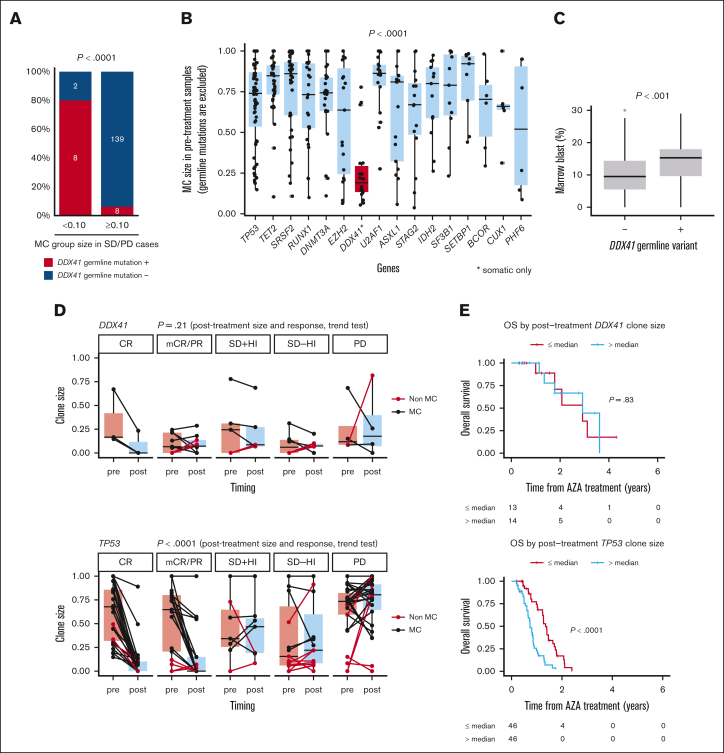
Azacitidine is a mainstay of therapy for myelodysplastic syndrome (MDS)-related diseases. The purpose of our study is to elucidate the effect of gene mutations on hematological response and overall survival (OS), particularly focusing on their posttreatment clone size. We enrolled a total of 449 patients with MDS or related myeloid neoplasms. They were analyzed for gene mutations in pretreatment (n = 449) and posttreatment (n = 289) bone marrow samples using targeted-capture sequencing to assess the impact of gene mutations and their posttreatment clone size on treatment outcomes. In Cox proportional hazard modeling, multihit TP53 mutation (hazard ratio [HR], 2.03; 95% confidence interval [CI], 1.42-2.91; P < .001), EZH2 mutation (HR, 1.71; 95% CI, 1.14-2.54; P = .009), and DDX41 mutation (HR, 0.33; 95% CI, 0.17-0.62; P < .001), together with age, high-risk karyotypes, low platelets, and high blast counts, independently predicted OS. Posttreatment clone size accounting for all drivers significantly correlated with International Working Group (IWG) response (P < .001, using trend test), except for that of DDX41-mutated clones, which did not predict IWG response. Combined, IWG response and posttreatment clone size further improved the prediction of the original model and even that of a recently proposed molecular prediction model, the molecular International Prognostic Scoring System (IPSS-M; c-index, 0.653 vs 0.688; P < .001, using likelihood ratio test). In conclusion, evaluation of posttreatment clone size, together with the pretreatment mutational profile as well as the IWG response play a role in better prognostication of azacitidine-treated patients with myelodysplasia.


Conflict of interest statement

Conflict-of-interest disclosure: Y.N. reports a consulting or advisory Role at Otsuka Pharmaceutical. K.U. received research funding from Otsuka Pharmaceutical and Nippon Shinyaku; and is on speakers’ bureau at Otsuka Pharmaceutical. K.I. received honoraria from Nippon Shinyaku. T.K. received grants from and is on speakers’ bureau at Nippon Shinyaku. K.O. received honoraria from Nippon Shinyaku. Y.M. received honoraria from Nippon Shinyaku.

Figures

None
Graphical abstract
Figure 1.
Figure 1.
Genetic and clinical factors associated with response and OS. (A) A summary chart of the study design. (B) Bar plots showing the number of cases with the genetic alterations indicated on the x-axis (bottom) and with the proportion of the cases showing response indicated by color (top). (C) A forest plot showing the result of a multivariable logistic regression analysis for the factors associated with achieving CR with complete data for response analysis (n = 396). Explicative variables included in the multivariable model are high-risk karyotypes (poor and very poor groups based on IPSS-R–based karyotype risk classification), multihit TP53 mutations, and mutations in ASXL1 and STAG2. The x-axis is log10 scaled. CI, confidential interval.
Figure 2.
Figure 2.
Clone changes during azacitidine treatment and genetic mechanisms of CR. (A) An oncoprint panel showing the change of gene mutation profiles between pre and postazacitidine treatment. Blue and red cells show gene mutations that disappeared and newly appeared after treatment, respectively. Purple cells show gene mutations that are shared between pre- and posttreatment samples. When 2 or more mutations are observed in a gene in a patient, the largest variant in pretreatment samples is assumed. Clinical response is shown at the top of the panel. (B) Single-cell analysis (n = 5080) with Tapestri platform of the case #PPM1D-1 (sample IDs correspond to those indicated in supplemental Table 7) that had mutations in TP53 and PPM1D. Shaded colors indicate the variant allele frequencies of the variants. (C) A schematic explanation of MC determined accounting for the clone size in pre (x-axis) and posttreatment (y-axis) samples from a patient. A set of mutations showing the largest and near largest size (difference in size is <0.10 compared with the largest mutation) in a pretreatment sample were defined as MCpre (left). Among the MCpre, a set of mutations showing the largest and near largest size in a posttreatment sample were assumed to be MC (right). The detailed description of definition appears in supplemental Methods. (D) Bar plots showing the numbers of MC (left) represented by the genes indicated on x-axis. Filled circles indicate the proportion of the variants (right) classified as MC out of all the mutations in the paired cohort. DDX41s indicates DDX41 somatic mutation. (E) Box plots showing the MC group sizes of posttreatment samples (ave_MCpost) in the paired cohort having the response indicated on x-axis. P = .0001, using Jonckheere-Terpstra tests. PR, partial response; SD, stable disease.
Figure 3.
Figure 3.
Somatic DDX41-mutated clone size does not correlate with blast ratio or response to treatment. (A) Percentage of the cases that have DDX41 germ line variants is shown among the cases showing SD/PD with MC group sizes <0.10 (n = 10) and ≥0.10 (n = 147). P < .0001, using Fisher exact test. (B) Box plots showing the size of MC groups in pretreatment samples that have mutations in the genes indicated on x-axis. MC groups with somatic DDX41 mutations are highlighted with red color. P value is derived from a two-sided t test for comparison of pretreatment MC sizes represented by DDX41 and the other genes. (C) Box plots showing marrow blast percentage for the cases with or without DDX41 germ line mutations. P value is derived from a two-sided t test. (D) Paired box plots showing the changes in clone size between pre- and posttreatment samples with mutations in DDX41 (top) and TP53 (bottom). The same mutations are connected by lines. Colors of lines represent whether they are MC (black) or not (red). P values are derived from Jonckheere-Terpstra tests under the hypothesis that there is no correlation between clinical response and posttreatment clone sizes. (E) Kaplan-Meier estimates of OS per clone sizes in posttreatment samples. Cases with somatic DDX41 mutations (top; n = 27) and TP53 mutations (bottom; n = 92) are shown. The posttreatment clone sizes were divided by the median value for each gene. The number of the cases at risk at each time is indicated in the table below. P values are derived from two-sided log-rank tests. HI, hematological improvement.
Figure 4.
Figure 4.
The role of posttreatment clone size on improvement of OS model. (A) A forest plot showing the result of Cox proportional hazards regression model for OS performed on the paired cohort with complete data for OS analysis (n = 223). Explicative variables are age, IPSS-M score, the largest VAF values adjusted for copy number alterations in posttreatment samples (MaxVAFpost), and clinical response per the IWG 2006 criteria (CR or not). The x-axis is log scaled. The new risk score of the novel OS model (prognostic scoring system after azacitidine treatment; PSS-AZA) is calculated according to the formula shown below the forest plot. The threshold for risk classification is also presented below the forest plot. (B) Kaplan-Meier estimates of OS per risk classes based on PSS-AZA are presented. The number of the cases at risk at each time is indicated in the tables below. P values are derived from two-sided log-rank tests. (C,D) Kaplan-Meier estimates of OS per risk classes based on PSS-AZA are presented for IPSS-M–very high-risk (C) and IPSS-M high-risk (D) group cases. Kaplan-Meier estimates of IPSS-M–based risk groups are overlaid with light-colored curves. (E) A schematic presentation of the analysis that examines the improvement of predictability. The paired cohort was randomly split into 75% training and 25% validation subsets 10 000 times and constructed a model for each training set to fit the model and calculated the concordance index (c-index) for the corresponding validation set. (F) Box plots indicating the distribution of c-index in the validation cohorts of 10 000 simulations.
Figure 5.
Figure 5.
The role of posttreatment clone size in predicting posttransplant outcomes. A swimmer plot showing the clinical course for the 16 cases who underwent transplant with TP53 mutations. Red and black asterisks indicate TP53 allelic state. Colors of horizontal bars indicate the period having the clinical state. Vertical bars show the clone size of TP53 variants in pre- and posttreatment samples.

References

    1. Silverman LR, Demakos EP, Peterson BL, et al. Randomized controlled trial of azacitidine in patients with the myelodysplastic syndrome: a study of the cancer and leukemia group B. J Clin Oncol. 2002;20(10):2429–2440. - PubMed
    1. Papageorgiou SG, Vasilatou D, Kontos CK, et al. Treatment with 5-azacytidine improves clinical outcome in high-risk MDS patients in the 'real life' setting: a single center observational study. Hematology. 2016;21(1):34–41. - PubMed
    1. Fenaux P, Mufti GJ, Hellstrom-Lindberg E, et al. Efficacy of azacitidine compared with that of conventional care regimens in the treatment of higher-risk myelodysplastic syndromes: a randomised, open-label, phase III study. Lancet Oncol. 2009;10(3):223–232. - PMC - PubMed
    1. Itzykson R, Kosmider O, Cluzeau T, et al. Impact of TET2 mutations on response rate to azacitidine in myelodysplastic syndromes and low blast count acute myeloid leukemias. Leukemia. 2011;25(7):1147–1152. - PubMed
    1. Itzykson R, Thepot S, Quesnel B, et al. Prognostic factors for response and overall survival in 282 patients with higher-risk myelodysplastic syndromes treated with azacitidine. Blood. 2011;117(2):403–411. - PubMed

Publication types