. 2023 Dec;18(1):2192375.
doi: 10.1080/15592294.2023.2192375.

Phenotypic and transcriptomic impact of expressing mammalian TET2 in the Drosophila melanogaster model

Affiliations

Phenotypic and transcriptomic impact of expressing mammalian TET2 in the Drosophila melanogaster model

Joy N Ismail et al. Epigenetics. 2023 Dec.

Abstract

Ten-Eleven Translocation (TET) proteins have recently come to light as important epigenetic regulators conserved in multicellular organisms. TET knockdown studies in rodents have highlighted the critical role of these proteins for proper brain development and function. Mutations in mammalian mTET proteins and mTET2 specifically are frequent and deregulated in leukaemia and glioma respectively. Accordingly, we examined the role of mTET2 in tumorigenesis in larval haemocytes and adult heads in Drosophila melanogaster. Our findings showed that expression of mutant and wild type mTET2 resulted in general phenotypic defects in adult flies and accumulation of abdominal melanotic masses. Notably, flies with mTET2-R43G mutation at the N-terminus of mTET2 exhibited locomotor and circadian behavioural deficits, as well as reduced lifespan. Flies with mTET2-R1261C mutation in the catalytic domain, a common mutation in acute myeloid leukaemia (AML), displayed alterations affecting haemocyte haemostasis. Using transcriptomic approach, we identified upregulated immune genes in fly heads that were not exclusive to TET2 mutants but also found in wild type mTET2 flies. Furthermore, inhibiting expression of genes that were found to be deregulated in mTET2 mutants, such as those involved in immune pathways, autophagy, and transcriptional regulation, led to a rescue in fly survival, behaviour, and hemocyte number. This study identifies the transcriptomic profile of wild type mTET2 versus mTET2 mutants (catalytic versus non-catalytic) with indications of TET2 role in normal central nervous system (CNS) function and innate immunity.

Keywords: Drosophila melanogaster; TET2; behaviour; circadian rhythm; glioma; innate immunity; leukaemia.


Conflict of interest statement

No potential conflict of interest was reported by the authors.

Figures

Figure 1.
Figure 1.
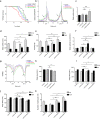
Morphological and survival defects exhibited by mTET2 expressing flies. (a) Schematic representation of mTET2 with its functional domains. Mutations R43G at the N-terminus and R121C at the catalytic domain are depicted. Transgenes tested in the study in dTet-expressing cells using the dTet promoter (dTet-Gal4) are indicated in (Supplemental Figure S1). (b) Validation of transgene expression in flies by Western blot against Flag tag (n = 3, 20 adult heads per group). (c) the expression of mTET2 is associated with an alteration in levels of 5hmc on RNA (5hmrC). Representative images from dot blot assays on 5hmrC abundance in adult heads with quantification of signal intensity normalized to loading control and shown as relative to control. Methylene blue (MB) was used as a loading control. 900 ng of RNA were loaded. (d) the average percentage of third instar larvae that eclosed as adults (n = 3, 30 larvae per group). Mean is shown with s.e.m. (e-panel A) Light microscopy images of male flies showing the malformation and protrusion of male genitalia in mutant flies as compared to the wild type control. Scale bar, 500 μm. (e-panel B) Light microscopy images of flies showing the presence of melanotic masses in the abdomen of transgenic flies that are not found in the wild type controls. Scale bar, 500 μm (second panel). (e-panel C) Light microscopy images of adult flies showing gaps along the midline in the thorax and abdomen (arrows). (f) Quantification of the average size of thorax and abdomen gaps in adult flies (n = 3, 20 flies per group), (g) Quantification of the occurrence of the melanotic masses in adult flies (n = 3, 20 flies per group), (h) Quantification of the occurrence of penis malformation in males (n = 3, 10 flies per group) (i) Representative confocal maximum intensity projections of adult brains stained with the glial marker Repo. Scale bar, 100 μm. Quantification of the average amount of glia per brain as calculated by ImageJ’s ITCN tool (n = 30 per genotype). Mean is shown with s.e.m. Confocal maximum intensity projection of Tet-Gal4>UAS-nuclear GFP brains showing the pattern of cells in which expression of transgenes is driven. Scale bar, 100 μm (lower panel). Control group used is a driver control dTet-Gal4>w1118); (j) Number of haemocytes present in larval haemolymph expressing either no transgene (driver control; dTet-Gal4>w1118) (n = 30), mTET2-wt (n = 30), mTET2-R43G (n = 30), or mTET2-R1261C (n = 34) with mTET2-wt and mTET2-R1261C showing a remarkable increase (n ≅ 30 in each genotype). *p < 0.05, **p < 0.01, ***p < 0.001 and ****p < 0.0001.
Figure 2.
Figure 2.
Expression of human mTET2-R43G and mTET2-R1261C in dTet expressing flies results in altered lifespan and circadian phenotypes. (a) Kaplan-Meier survival curve of male flies expressing either no transgene (w1118 control, n = 24), mTET2-wt (n = 24), mTET2-R43G (n = 28), or mTET2-R1261C (n = 32) driven by dTet-Gal4. Statistical significance of the difference between survival curves was determined using the Mantel-Haenszel test. Survival of mTET2-wt, mTET2-R43G, and mTET2-R1261C was significantly reduced compared to control (* p < 0.05, ****p < 0.0001). Survival of mTET2-R43G flies was significantly reduced compared to mTET2-wt and mTET2-R1261C (Unpaired t-test; *p < 0.05, **p < 0.01). (b) Locomotor activity graphs were analysed over 30 days. For each group, the locomotor activity levels of individual male flies were measured in 5-minute bins and then averaged to obtain a representative activity profile. Drosophila melanogaster generally exhibits two activity bouts: one centred around ZT0 (morning peak) and the second around ZT12 (evening peak), arrows indicate the anticipatory activity prior to light transition states. (c) Graph showing the average activity of the flies over 24 h intervals (Unpaired t-test; ns: p > 0.05). (d) the flies are subdivided into two groups in an age-dependent manner as locomotion is age-dependent: ‘young’ represents 1–13 days old and ‘old’ represents 14–30 days old. Note that mTET2-R43G young flies are significantly less active (* p < 0.05), whereas old mTET2-R1261C flies are more active (* p < 0.05) compared to mTET2-wt. (e) Graph showing the average locomotor activity over 12 h intervals (day: light on, night: light off) (Unpaired t-test; ns: p > 0.05). (f) Graph illustrating the wake activity counts per min over 12 h intervals. The wake activity is a measure of the activity rate when the flies are awake. Note that there is a significant decrease in the wake activity in mTET2-R1261C flies compared to mTET2-wt flies (*p < 0.05). (g) Graph illustrating the percentage of time that flies spent sleeping over several days. For each group, the percentage of flies sleeping was measured in 5-minute bins and then averaged to obtain a representative sleep profile. (h) Graph showing the average sleep of the flies over 24 h intervals. ZT0 indicates the morning peak and ZT12 the evening peak. Note that there is a significant decrease in the average of sleeping in mTET2-R1261C flies compared to mTET2-wt flies (****p < 0.0001). (i) Young and old mTET2-R1261C flies and old mTET2-R43G flies sleep significantly less compared to mTET2-wt flies (Unpaired t-test; * p < 0.05, **p < 0.01, ***p < 0.001). (j) Graph showing the average of daily sleep minutes for all flies over 12 h intervals over 30 days. During day and night, mTET2-R1261C expressing flies showed a significant decrease in sleep time compared to mTET2-wt flies (Unpaired t-test, ** p < 0.01, *** p < 0.001). (k) Graph showing the average number of rest bouts for all flies in one group for 12 h intervals over 30 days. During the day, mTET2-R43G flies showed significantly more rest bouts compared to mTET2-wt flies (Unpaired t-test, ** p < 0.01). During the day and night, mTET2-R1261C expressing flies showed significantly more rest bouts compared to mTET2-wt flies (Unpaired t-test ***p < 0.001, ** p < 0.005). (For all figures, ns: p > 0.05).
Figure 3.
Figure 3.
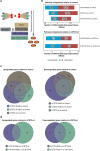
Differentially expressed genes in flies expressing mammalian TET2 transgenes relative to control and mTET2-wt. (a) Schematic of flies used in the transcriptomic analysis. (b) Several differentially expressed genes (DEGs) were identified in each group relative to dTet-Gal4>w1118 (control) and mTET2-wt (lower panel). Blue genes are downregulated, red genes are upregulated. (c-d) Venn diagram of the DEGs that are common and different between the groups when compared to dTet-Gal4>w1118 (control) and mTET2-wt. (c) Depicts up- and down-regulated genes compared to dTet-Gal4>w1118 (control) (d) Depicts up- and down-regulated genes compared to mTET2-wt.
Figure 4.
Figure 4.
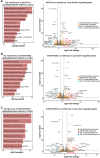
Gene ontology of genes that are upregulated in all mTET2 expressing flies versus controls. Gene ontology of top 10 upregulated DEGs that were identified in mTET2 heads versus controls, with most being involved in immune related pathways. Volcano plot indicating top 15 genes upregulated and downregulated relative to control group.
Figure 5.
Figure 5.
Top 15 enriched genes in mTET2-R43G and mTET2-R1261C fly heads compared to mTET2-wt. Volcano plots representing the most significantly up- or down-regulated genes. Several of these are commonly found in both mTET2-R43G and mTET-R1261C.
Figure 6.
Figure 6.
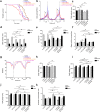
Knocking down atg16 gene in mTET2-R43G expressing flies rescues the survival, altered activity, and circadian phenotypes. (a) Kaplan-Meier survival curve of male flies expressing no transgene (w1118 control, n = 24), mTET2-wt (n = 24), mTET2-R43G (n = 28), mTET2-R43 G+atg16 RNAi (n = 24), or mTET2-wt+atg16 RNAi (n = 21) driven by dTet-Gal4. Statistical significance of the difference between survival curves was determined using the Mantel-Haenszel test. Survival of mTET2-R43 G+atg16 RNAi was significantly higher and almost similar to the w1118 control and mTET2-wt flies compared to mTET2-R43G flies (****p < 0.0001). (b) Locomotor activity graphs were analysed over 30 days. For each group, the locomotor activity levels of male flies were measured in 5-minute bins and then averaged to obtain a representative activity profile. Drosophila melanogaster generally exhibits two activity bouts: one centred around ZT0 (morning peak) and the second around ZT12 (evening peak). (c) Graph showing the average activity of the flies over 24 h intervals (Unpaired t-test; ns: p > 0.05). (d) the flies are subdivided into two groups in an age-dependent manner since locomotion is age-dependent: ‘young’ refers to 1–13 days old and ‘old’ refers to 14–30 days old. mTET2-R43G young flies are significantly less active (* p < 0.05), compared to mTET2-wt, whereas young mTET2-R43 G+atg16 RNAi expressing flies are more active compared to mTET2-R43G young flies (* p < 0.05). (e) Graph showing the average locomotor activity over 12 h intervals (day: light on, night: light off). During the night, mTET2-wt+atg16 RNAi flies are more active compared to mTET2-wt flies (Unpaired t-test; * p < 0.05). (f) Graph illustrating the wake activity counts per minute over 12 h intervals. The wake activity is a measure of the activity rate when the flies are awake. mTET2-wt+atg16 RNAi flies demonstrate higher wake activity at night compared to mTET2-wt flies (Unpaired t-test; * p < 0.05). (g) Graph illustrating the percent of the time that flies spend sleeping over several days. For each group, the percent of flies sleeping was measured in 5-minute bins and then averaged to obtain a representative sleep profile. ZT0 indicates the morning peak and ZT12 the evening peak. (h) Graph showing the average sleep of the flies over 24 h intervals. (Unpaired t-test; ns: p > 0.05). (i) the flies are subdivided into two age groups considering that sleep is also age-dependent: ‘young:’ 1-13 days old and ‘old:’ 14–30 days old (Unpaired t-test; * p < 0.05, ns: p > 0.05). (j) Graph showing the average of daily sleep minutes for all flies over 12 h intervals over 30 days. During the night, mTET2-wt+atg16 RNAi flies showed a significant decrease in sleep time compared to mTET2-wt flies. (Unpaired t-test, ****: p < 0.0001). (k) Graph showing the average number of rest bouts for all flies in one group for 12 h intervals over 30 days. During the day, mTET2-R43G flies showed significantly more rest bouts compared to mTET2-wt flies (Unpaired t-test, **: p < 0.005). During the day, mTET2-R43 G+atg16 RNAi flies showed significantly fewer rest bouts compared to mTET2-R43G flies (Unpaired t-test; **p < 0.005). mTET2-wt+atg16 RNAi flies showed significantly more rest bouts compared to mTET2-wt flies (Unpaired t-test; * p < 0.05).
Figure 7.
Figure 7.
Knocking down ich gene in mTET2-R43G expressing flies impacts the survival, activity, and circadian phenotypes. (a) Kaplan-Meier survival curve of male flies expressing no transgene (w1118 control, n = 24), mTET2-wt (n = 24), mTET2-R43G (n = 28), mTET2-R43 G+ich RNAi (n = 26), mTET2-wt+ich RNAi (n = 20) driven by dTet-Gal4. Statistical significance of the difference between survival curves was determined using the Mantel-Haenszel test. Survival of mTET2-R43 G+ich RNAi was significantly higher and similar to the control compared to mTET2-R43G flies (***p < 0.0001). (b) Locomotor activity graphs were analysed over 30 days. For each group, the locomotor activity levels were measured in 5-minute bins and then averaged to obtain a representative activity profile. The activity bout centred around ZT0 represents the morning peak while ZT12 represents the evening peak. mTET2-R43 G+ich RNAi flies exhibit abnormal hyperactivity relative to all other groups. (c) Graph showing the average activity of all flies over 24 h intervals (Unpaired t-test; ns: p > 0.05). mTET2-R43 G+ich RNAi expressing flies are significantly more active than mTET2-R43G flies (* p < 0.05). (d) Flies were subdivided into two groups by age, with ‘young’ representing 1–13 days old and ‘old’ representing 14–30 days old. mTET2-R43G young flies are significantly less active than mTET2-wt (*p < 0.05). (e) Graph showing the average locomotor activity over 12 h intervals (day: light on, night: light off). During the day, mTET2-wt+ich RNAi flies are significantly less active compared to mTET2-wt flies (Unpaired t-test; *** p < 0.0005). mTET2-R43 G+ich RNAi expressing flies display significantly higher activity during the day and night compared to mTET2-R43G flies (Unpaired t-test; * p < 0.05, ** p < 0.005). (f) Graph illustrating the wake activity counts per min over 12 h intervals. The wake activity is a measure of the activity rate when flies are awake. mTET2-wt +ich RNAi flies demonstrate significantly lower wake activity during the day in contrast to mTET2-wt flies (Unpaired t-test, ****: p < 0.0001). (g) Graph illustrating the proportion of time that flies spend sleeping over several days. The percent of flies sleeping was measured in 5-minute bins and then averaged to obtain a representative sleep profile. ZT0 indicates the morning peak and ZT12 indicates the evening peak. (h) Graph showing the average sleep of the flies over 24 h intervals. (Unpaired t-test; ns: p > 0.05). (i) Flies were subdivided into two groups by age, with ‘young’ representing 1–13 days old and ‘old’ representing 14–30 days old. (Unpaired t-test; * p < 0.05, ns: p > 0.05). (j) Graph showing the average of daily sleep minutes for all flies over 12 h interval over 30 days (Unpaired t-test, ns: p > 0.05). (k) Graph showing the average number of rest bouts for all flies in one group for 12 h intervals over 30 days. During the day, mTET2-R43G flies showed significantly more rest bouts compared to mTET2-wt flies (Unpaired t-test, **: p < 0.005). mTET2-R43 G+Iich RNAi flies showed significantly fewer rest bouts during the day compared to mTET2-R43G flies (Unpaired t-test; ***p < 0.0005). Similarly, during the day, the number of rest bouts was significantly lower in mTET2-wt+ich RNAi expressing flies compared to mTET2-wt flies (Unpaired t-test; **p < 0.005).
Figure 8.
Figure 8.
Expression of Myd88 RNAi and Stat92E RNAi in mTET2-R1261C expressing larvae rescues the increase in the number of haemocytes. Graphs showing the number of haemocytes in third instar larvae expressing either no transgene (w1118 control), mTET2-wt, or mTET2-R1261C, mTET2-R1261C + Myd88 RNAi, mTET2-wt + Myd88 RNAi, mTET2-R1261C + Stat92E RNAi, mTET2-wt + Stat92E RNAi, mTET2-R1261C + Relish RNAi, mTET2-wt +Relish RNAi, mTET2-R1261C + GFP RNAi, or mTET2-wt + GFP RNAi driven by dTet-Gal4 (n ≅ 30). (a) mTET2-R1261C + Myd88 RNAi expressing larvae show a significant decrease in the number of haemocytes compared to mTET2-R1261C larvae (Unpaired t-test; ****p < 0.0001). (b) Number of haemocytes in mTET2-R1261C + Stat92E RNAi expressing larvae was significantly reduced compared to mTET2-R1261C larvae (Unpaired t-test; ****p < 0.0001). mTET2-wt + Stat92E RNAi expressing larvae showed a significant decrease in haemocytes number compared to mTET2-wt larvae (Unpaired t-test; * p < 0.05). (c) mTET2-R1261C + Relish RNAi expressing larvae showed no significant difference in the number of haemocytes compared to mTET2-R1261C larvae (Unpaired t-test; ns: p > 0.05).

References

    1. Tahiliani M, Koh KP, Shen Y, et al. Conversion of 5-methylcytosine to 5-hydroxymethylcytosine in mammalian DNA by MLL partner TET1. Science. 2009;324(5929):930–26. - PMC - PubMed
    1. Ito S, D’Alessio, A.C, Taranova, O.V, et al. Role of Tet proteins in 5mc to 5hmc conversion, ES-cell self-renewal and inner cell mass specification. Nature. 2010;466(7310):1129–1133. - PMC - PubMed
    1. Koh KP, Yabuuchi A, Rao S, et al. Tet1 and Tet2 regulate 5-hydroxymethylcytosine production and cell lineage specification in mouse embryonic stem cells. Cell Stem Cell. 2011;8(2):200–213. - PMC - PubMed
    1. Ito S, Shen L, Dai Q, et al. Tet proteins can convert 5-methylcytosine to 5-formylcytosine and 5-carboxylcytosine. Science. 2011;333(6047):1300–1303. - PMC - PubMed
    1. He YF, Li B-Z, Li Z, et al. Tet-mediated formation of 5-carboxylcytosine and its excision by TDG in mammalian DNA. Science. 2011;333(6047):1303–1307. - PMC - PubMed

Publication types