. 2023 Mar 29;18(3):e0282821.
doi: 10.1371/journal.pone.0282821. eCollection 2023.

Functionally distinct BMP1 isoforms show an opposite pattern of abundance in plasma from non-small cell lung cancer subjects and controls

Affiliations

Functionally distinct BMP1 isoforms show an opposite pattern of abundance in plasma from non-small cell lung cancer subjects and controls

Margaret K R Donovan et al. PLoS One. .

Abstract

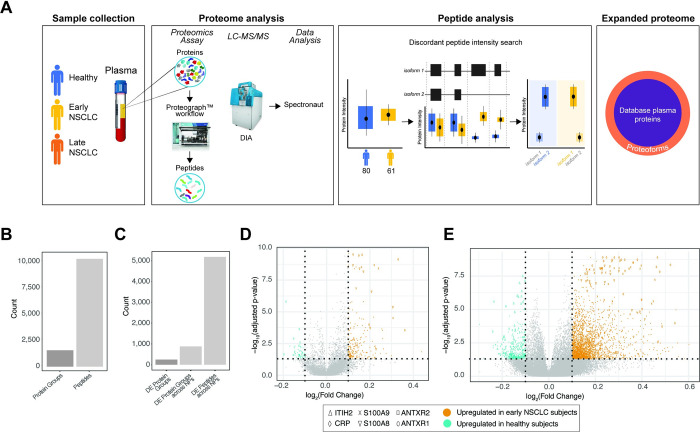
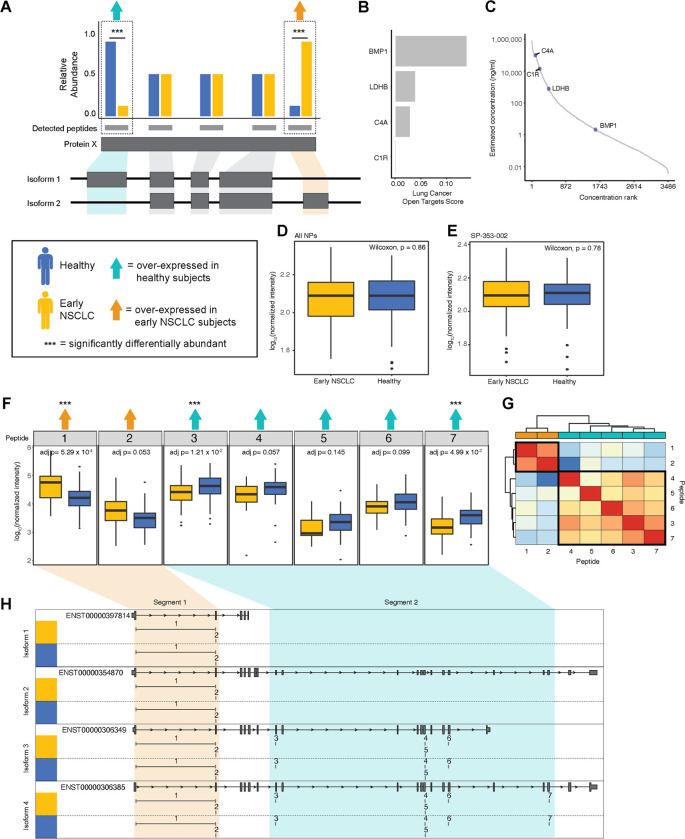
Advancements in deep plasma proteomics are enabling high-resolution measurement of plasma proteoforms, which may reveal a rich source of novel biomarkers previously concealed by aggregated protein methods. Here, we analyze 188 plasma proteomes from non-small cell lung cancer subjects (NSCLC) and controls to identify NSCLC-associated protein isoforms by examining differentially abundant peptides as a proxy for isoform-specific exon usage. We find four proteins comprised of peptides with opposite patterns of abundance between cancer and control subjects. One of these proteins, BMP1, has known isoforms that can explain this differential pattern, for which the abundance of the NSCLC-associated isoform increases with stage of NSCLC progression. The presence of cancer and control-associated isoforms suggests differential regulation of BMP1 isoforms. The identified BMP1 isoforms have known functional differences, which may reveal insights into mechanisms impacting NSCLC disease progression.


Conflict of interest statement

OCF. has financial interest in Selecta Biosciences, Tarveda Therapeutics, and Seer. MKRD, YH, JEB, JW, DH, SF, IM, SK, MK, RWB, TLP, SB, OCF, and AS have financial interest in Seer. LAD is a member of Seer’s Scientific Advisor Board and is financially compensated for that role. Only Seer, and no other companies mentioned here, was involved in the study design, data collection and analysis, and manuscript writing/editing. This does not alter our adherence to PLOS ONE policies on sharing data and materials.

Figures

Fig 1
Fig 1. Proteome analysis of healthy and NSCLC subjects using a 5 NP plasma workflow.
A. Overview of this proof-of-concept proteoform identification study. Plasma samples were collected from healthy (blue), early non-small cell lung cancer (NSCLC; yellow), late NSCLC (orange), and co-morbid (green) subjects (Sample Collection). The plasma proteomes were analyzed for each of these subjects, which included protein extraction, protein discovery using the NP-based Proteograph platform, then DIA protein/peptide identification and quantification using LC-MS/MS and search algorithms (Proteome Analysis). Proteoforms were then identified using a discordant peptide intensity search, which included examining peptide mappings to known protein coding isoforms and using differential abundance to discover protein isoforms. Together, these identified proteoforms represent an expanded plasma proteome database not captured in standard MS-based or targeted proteomic studies (Expanded proteome). B. Barplots showing the number of peptides and proteins groups retained after filtering to those present in at least 50% of subjects from either heathy or early NSCLC. C. Barplots showing the number of differentially abundant (DA): 1) protein groups, with collapsed abundances using MaxLFQ; 2) protein groups across NPs (i.e., DA independently across NPs); and 3) peptides across NPs. D. Volcano plot showing the significance (adjusted p-value; y-axis) and fold change (x-axis) from calculating the differential abundance of protein groups across NPs between healthy and early NSCLC subjects. Protein groups with a log2(Fold Change) greater or less than 1.0 and adjusted p-value < 0.05 are highlighted, where protein groups with increased abundance in early NSCLC subjects are shown in orange and protein groups with increased abundance in healthy subjects are shown in teal. Proteins with known roles in cancer and immune response (ITIH2, CRP, S100A9, S100A8, ANTXR2, and ANTXR1) are highlighted with various shapes. E. Volcano plot showing the significance (adjusted p-value; y-axis) and fold change (x-axis) from calculating the differential abundance of peptides across NPs between healthy and early NSCLC subjects. Peptides with a log2(Fold Change) greater or less than 1.0 and adjusted p-value < 0.05 are highlighted, where peptides with increased abundance in early NSCLC subjects are shown in orange and peptides with increased abundance in healthy subjects are shown in teal. Peptides mapping to proteins with known roles in cancer and immune response (ITIH2, CRP, S100A9, S100A8, ANTXR2, and ANTXR1) are highlighted with various shapes.
Fig 2
Fig 2. Identification of four proteoforms, including BMP1, in 141 healthy and early NSCLC subjects using a discordant peptide intensity search.
A. Cartoon describing the discordant peptide intensity search strategy. We calculated DA across peptides between healthy (blue) and early NSCLC (yellow). Protein groups with at least one peptide significantly over-expressed (triple asterisks) in healthy subjects (teal arrow) and at least one peptide over-expressed in early NSCLC subjects (orange arrow) were identified as having putative proteoforms. Mapping the peptides to the gene structure, we inferred potential exon usage and segments suggesting the detection of more than one protein isoform. B. Barplot showing four proteins in which we potentially captured multiple protein isoforms: BMP1, C4A, C1R, and LDHB and their associated Open Target Score for lung carcinoma. C. Plot showing the four proteins with putative proteoforms matched to a reference database (HPPP) plotted as a distribution by the rank order of published concentrations (x-axis) and by the log10 published concentration (ng/ml; y-axis). D. Box plot showing the log10 median normalized intensities of BMP1 in early NSCLC subjects (yellow) and in healthy subjects (blue) with collapsed abundances across NPs. P-values, calculated using a Wilcoxon test, are shown. E. Box plot showing the log10 median normalized intensities of BMP1 in early NSCLC subjects (yellow) and in healthy subjects (blue) in NP, SP-353-002. P-values, calculated using a Wilcoxon test, are shown. F. Series of boxplots showing the log10 median normalized intensities of seven peptides mapping BMP1 in early NSCLC (yellow) and healthy subjects (blue). Peptides that are over-expressed in healthy subjects are indicated with a teal arrow and in early NSCLC are indicated with an orange arrow. Peptides that are significantly DA are indicated with a triple asterisk. P-values, calculated using a Wilcoxon test and adjusted, are shown. G. Heatmap showing the Pearson correlation of the seven BMP1 peptide abundances, where low correlation is indicated in shades of blue and high correlation is indicated in shades of red. Correlation values were clustered using hierarchical clustering. Peptides are annotated by the direction of DA, including over-expressed in healthy subjects are highlighted in teal and early NSCLC are highlighted in orange. H. Gene structure plots of four known BMP1 protein coding transcripts (i.e., isoforms) with the seven BMP1 peptides mapped to genomic region. Peptides spanning intronic regions are indicated with a horizontal line. Peptides 1 and 2, corresponding to being over-expressed early NSCLC, are boxed in orange, creating one segment. Peptides 37, corresponding to being over-expressed healthy, are boxed in teal, creating a second segment. Segment 1 appears to correspond to the shorter isoform 1, whereas segment 2 appears to correspond to the longer isoforms 2–4.

References

    1. Smith LM, Kelleher NL, Proteomics TC for TD. Proteoform: a single term describing protein complexity. Nat Methods. 2014;10(3):186–7. - PMC - PubMed
    1. Li YI, Van De Geijn B, Raj A, Knowles DA, Petti AA, Golan D, et al.. RNA splicing is a primary link between genetic variation and disease. Science. 2016. Apr 29;352(6285):600–4. doi: 10.1126/science.aad9417 - DOI - PMC - PubMed
    1. Lisitsa A, Moshkovskii S, Chernobrovkin A, Ponomarenko E, Archakov A. Profiling proteoforms: promising follow-up of proteomics for biomarker discovery. Expert Rev Proteomics. 2014. Feb;11(1):121–9. doi: 10.1586/14789450.2014.878652 - DOI - PubMed
    1. Satpathy S, Krug K, Jean Beltran PM, Savage SR, Petralia F, Kumar-Sinha C, et al.. A proteogenomic portrait of lung squamous cell carcinoma. Cell. 2021;184(16):4348–4371.e40. doi: 10.1016/j.cell.2021.07.016 - DOI - PMC - PubMed
    1. Kisluk J, Ciborowski M, Niemira M, Kretowski A, Niklinski J. Proteomics biomarkers for non-small cell lung cancer. J Pharm Biomed Anal. 2014. Dec;101:40–9. doi: 10.1016/j.jpba.2014.07.038 - DOI - PubMed

Publication types