. 2023 Mar 29;9(13):eadf0927.
doi: 10.1126/sciadv.adf0927. Epub 2023 Mar 29.

Aberrant cell state plasticity mediated by developmental reprogramming precedes colorectal cancer initiation

Affiliations

Aberrant cell state plasticity mediated by developmental reprogramming precedes colorectal cancer initiation

Pratyusha Bala et al. Sci Adv. .

Abstract

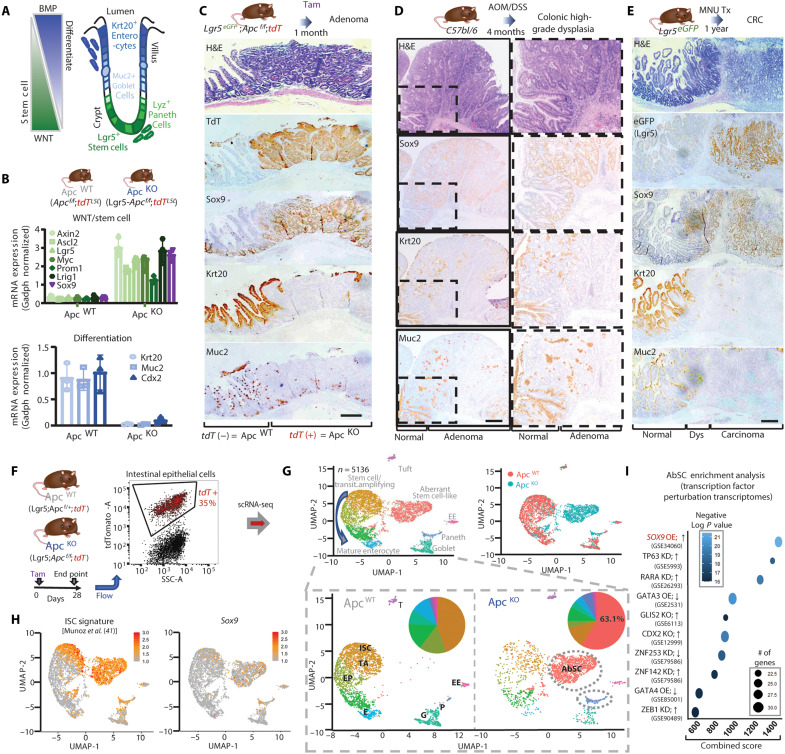
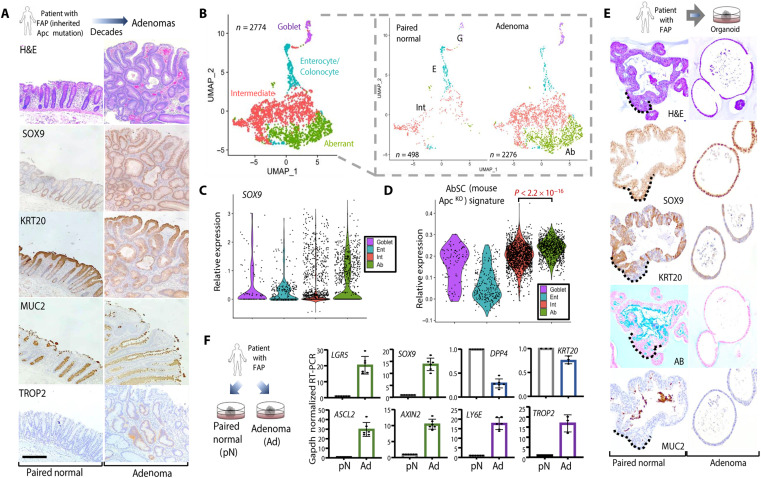
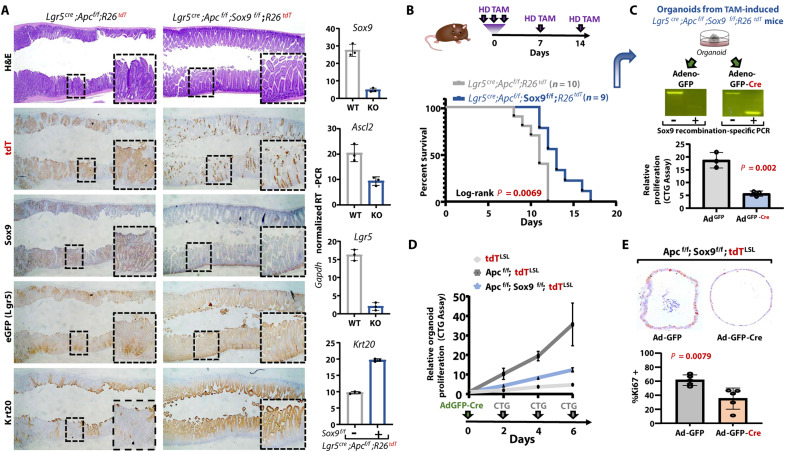
Cell state plasticity is carefully regulated in adult epithelia to prevent cancer. The aberrant expansion of the normally restricted capability for cell state plasticity in neoplasia is poorly defined. Using genetically engineered and carcinogen-induced mouse models of intestinal neoplasia, we observed that impaired differentiation is a conserved event preceding cancer development. Single-cell RNA sequencing (scRNA-seq) of premalignant lesions from mouse models and a patient with hereditary polyposis revealed that cancer initiates by adopting an aberrant transcriptional state characterized by regenerative activity, marked by Ly6a (Sca-1), and reactivation of fetal intestinal genes, including Tacstd2 (Trop2). Genetic inactivation of Sox9 prevented adenoma formation, obstructed the emergence of regenerative and fetal programs, and restored multilineage differentiation by scRNA-seq. Expanded chromatin accessibility at regeneration and fetal genes upon Apc inactivation was reduced by concomitant Sox9 suppression. These studies indicate that aberrant cell state plasticity mediated by unabated regenerative activity and developmental reprogramming precedes cancer development.


Figures

Fig. 1.
Fig. 1.. Impaired differentiation is a conserved mechanism of aberrant cell state plasticity in mouse models of intestinal neoplasia.
(A) Schematic depicting WNT and BMP signaling gradient in normal intestines. Stem cells and Paneth cells reside in the crypt base, whereas differentiated cell types are in the villus. (B) Relative mRNA expression of Wnt/stem cell (top) and differentiation (bottom) genes in intestines of indicated mice by quantitative reverse transcription polymerase chain reaction (qRT-PCR); means ± SD of three biological replicates. (C) Representative images of intestinal lesions from Lgr5Cre;Apcf/f;R26tdT mice including hematoxylin and eosin (H&E) staining and tdTomato (tdT), Sox9, Krt20, and Muc2 IHC. Scale bar, 250 μm. (D) Representative images of intestinal lesions from AOM/DSS-treated mice including H&E staining Sox9, Krt20, and Muc2 IHC. Normal and adenoma regions were labeled. Scale bar, 250 μm. (E) Representative images of intestinal lesions from MNU-treated Lgr5eGFP mice including H&E staining and eGFP (Lgr5-expressing cells), Sox9, Krt20, and Muc2 IHC. Normal, dysplastic, and carcinoma regions were labeled. Scale bar, 250 μm. (F) tdT+ intestinal epithelial cells isolated by fluorescence-activated cell sorting (FACS) from Lgr5Cre; Apcf/+;R26tdT (control) and Lgr5Cre;Apcf/f;R26tdT (experimental) mice 28 days following tamoxifen induction. (G) Uniform manifold approximation and projection (UMAP) representation of single-cell transcriptome profiling of tdT+ epithelial cells from Lgr5Cre; Apcf/+;R26tdT (control) and Lgr5Cre;Apcf/f;R26tdT (experimental) mice colored by cell type (top left) and sample identity (top right). UMAP of separated samples along with pie chart indicating cell type distribution (bottom). TA, transit amplifying; EP, enterocyte progenitor; E, mature enterocyte; G, goblet cell; P, Paneth cell; EE, enteroendocrine; T, tuft cell; AbSC, aberrant stem cell–like. (H) UMAP representation of ISC signature (left) (41) and Sox9 (right). (I) Transcription factor perturbation gene ontology analysis (Enrichr) of top 100 genes up-regulated in AbSC cluster.
Fig. 2.
Fig. 2.. Reactivation of genes associated with fetal intestinal development upon Apc inactivation.
(A) Volcano plot showing differentially expressed genes from AbSC cluster. Enterocyte (blue), stem cell (green), regeneration (salmon), and fetal intestine (purple) genes are highlighted. (B) Normalized regeneration gene signature expression (42) on UMAP plot. (C) Normalized Ly6a expression on UMAP plot (top). Chromatin accessibility at Ly6a genomic locus in tdT+ cells isolated by FACS from Lgr5-tdT and Lgr5-Apcf/f-tdT mice by ATAC-seq (bottom). (D) Representative images of intestinal lesions from Lgr5-Apcf/f-tdT mice including H&E staining and tdTomato (tdT), Sca-1 (quantification on top right), Trop2, and Krt20 IHC. Scale bar, 250 μm. (E) Normalized fetal-like intestinal gene signature expression (48) on UMAP plot. (F) Average expression of differentially up-regulated (red) and down-regulated (blue) genes across fetal intestines at indicated time points of mouse development by RNA-seq (1). Heatmap representing differentially expressed genes in embryonic day 12 (E12) fetal intestines compared to adult intestines ranked by fold change; a normalized enrichment score of up-regulated genes in AbSC is shown on the right (P < 1 × 10−5). Ad, adult. (G) Normalized Tacstd2 expression on UMAP plot (top). Chromatin accessibility at Tacstd2 genomic locus in tdT+ cells isolated by FACS from Lgr5-tdT and Lgr5-Apcf/f-tdT mice by ATAC-seq (bottom). (H) Pseudotime analysis of AbSCs using Monocle 3. (I) Violin plot indicated expression of fetal-like intestinal gene signature expression (48) in tdT+ intestinal cells from Lgr5-tdT control and Lgr5-Apcf/f-tdT at day 10 and 28 following tamoxifen induction. P value calculated by Wilcoxon rank sum test with Bonferroni correction.
Fig. 3.
Fig. 3.. scRNA-seq of carcinogen-induced model of colonic neoplasia demonstrates developmental reprogramming.
(A) UMAP plot of epithelial cells from a colon lesion and adjacent normal epithelium of an AOM/DSS-treated mouse model of colon carcinogenesis, colored by cell type (top left) and origin (top right). UMAPs from lesions and normal are separately depicted (bottom). TA, transit amplifying; E, mature enterocyte. (B) Feature plot of Lgr5;ApcKO gene signature on AOM/DSS UMAP. (C) Feature plot of fetal-like gene signature (48) on AOM/DSS UMAP. (D) Feature plot of Tacstd2 (Trop2) expression on UMAP. (E) Representative images of a high-grade dysplastic colonic lesion from an AOM/DSS-treated mouse including H&E and Alcian blue (AB) staining, as well as Sox9, Krt20, Sca-1, and Trop2 IHC. (F) Experimental workflow for AOM/DSS induced colonic tumor model (GSE178145) (49). Bulk RNA-seq of three biological replicates at indicated time points was analyzed. (G) Gene set enrichment analysis (GSEA) of regeneration gene signature (42) on AOM/DSS lesions at week 10 versus controls (left) and heatmap of associated genes over time (right) (49). (H) GSEA of fetal-like intestinal gene signature (left) (48) on AOM/DSS lesions at week 10 versus controls (left) and heatmap of associated genes over time (right) (49). (I) Normalized enrichment scores for regeneration gene signature, fetal-like intestinal gene signature, and AbSC gene signature over time in AOM/DSS data from (49).
Fig. 4.
Fig. 4.. Characterization of human FAP adenomas by histopathology and scRNA-seq.
(A) Representative images of adenoma and normal adjacent colon tissue from patient with FAP including H&E staining SOX9, KRT20, and MUC2 IHC. Scale bars, 250 μm. (B) UMAP representation of scRNA-seq of human adenoma and paired normal indicating four distinct cell clusters; E, enterocyte; Int, intermediate; Ab, aberrant; G, Goblet. (C) Violin plot indicated SOX9 expression in four different cell clusters. (D) Violin plot indicated the expression of the AbSC gene signature in four different cell clusters. P value calculated by Wilcoxon rank sum test with Bonferroni correction. (E) Representative images of organoids derived from adenoma and adjacent-normal tissue from patient with FAP including H&E and AB staining Sox9, Krt20, and Muc2 IHC; the dotted line in the paired normal sample indicates one of several crypts in the organoid. (F) mRNA expression of SOX9, stem cell marker LGR5, WNT pathway markers AXIN2 and ASCL2, AbSC markers LY6E and TROP2, and intestinal differentiation markers KRT20 and DPP4 in FAP organoids by qRT-PCR. Data are expressed as means ± SD of three biological and two technical replicates.
Fig. 5.
Fig. 5.. Sox9 is required for ApcKO adenomas and organoids.
(A) Representative images of H&E staining and tdT, Sox9, Lgr5(eGFP), and Krt20 IHC from Lgr5-Apcf/f-tdT (control) and Lgr5-Apcf/f-Sox9f/f-tdT (experimental) mice small intestine; corresponding normalized mRNA expression of Sox9, Ascl2, Lgr5, and Krt20. Data are expressed as means ± SD of three biological replicates. (B) Schematic of in vivo experimental design. Kaplan-Meier survival curve of Lgr5-Apcf/f-tdT (n = 10) and Lgr5-Apcf/f-Sox9f/f-tdT (n = 9) mice using high-dose (HD) tamoxifen (TAM) for induction and maintenance. Log-rank P = 0.0069. (C) Organoids from Lgr5-Apcf/f-Sox9f/f-tdT mice were generated at the experimental endpoint, treated with either AdGFP or AdGFP-Cre, and subjected to Sox9 recombination-specific PCR and a proliferation assay by CTG. Data are expressed as means ± SD of three biological replicates. P values were calculated by a two-sided Student’s t test. (D) Proliferation of organoids derived from tdT, Apcf/f-tdT, and Apcf/f-Sox9f/f-tdT mice and infected with AdGFP-Cre at indicated time points by CTG. Data are expressed as means ± SD of three biological replicates. (E) Organoids derived from tdT, Apcf/f-tdT, and Apcf/f-Sox9f/f-tdT mice were infected with AdGFP or AdGFP-Cre, formalin-fixed, and then processed for histopathology. Representative images of Ki67 IHC. Quantification of %Ki67 positivity in five to six organoids per condition. P values were calculated by two-sided Student’s t test. WT, wild type; KO, knockout.
Fig. 6.
Fig. 6.. Sox9 suppression restricts AbSC and developmental reprogramming by scRNA-seq.
(A) UMAP representation of scRNA-seq data from tdT+ cells isolated by FACS from Lgr5-tdT, Lgr5-Apcf/f-tdT, and Lgr5-Apcf/f-Sox9f/+-tdT mice a month after tamoxifen induction colored by clusters and then separated by sample. Violin plot of normalized single-cell Sox9 expression in each group. Pie charts indicating the distribution of clusters in each sample. SC, stem cell, TA, transient amplifying; E, enterocyte; EEC, enteroendocrine cell. (B) Violin plot of normalized expression of AbSC gene signature (top) and fetal-like intestines gene signature (bottom) (48) in each group. P value calculated by Wilcoxon rank sum test with Bonferroni correction. (C) Heatmap depicting chromatin accessibility at fetal genes from two published signatures (, 48) in tdT+ cells flow-sorted from the intestines of Lgr5-tdT (n = 2), Lgr5-Apcf/f-tdT (n = 2), and Lgr5-Apcf/f-Sox9f/+-tdT (n = 2) mice. (D) Integrative genomics viewer screenshots depicting chromatin accessibility at Ly6a, Ly6e, and Tacstd2 genomic loci in tdT+ cells flow-sorted from the intestines of Lgr5-tdT, Lgr5-Apcf/f-tdT, and Lgr5-Apcf/f-Sox9f/+-tdT mice.
Fig. 7.
Fig. 7.. SOX9 KD impairs fetal reprogramming and induces differentiation in FAP adenoma organoids.
(A) Heatmap of SOX9 binding associated with AbSC genes (1130 peaks) in normal colon (n = 4 technical replicates) and adenoma (n = 4 technical replicates) organoids from a patient with FAP by CUT&RUN. (B) Venn diagram of high-confidence SOX9 bound genes (peaks) using log fold change ≥ 0.5 compared to immunoglobulin G (IgG) control in normal colon and adenoma organoids for genes in AbSC (top) and fetal-like intestines (bottom) (48). (C) Heatmap of SOX9 binding associated with fetal-like intestinal (730 peaks) (48) in normal colon and adenoma organoids by CUT&RUN. (D) SOX9 binding at fetal intestinal genes TACSTD2 and CLU in normal colon and adenoma organoids by CUT&RUN. (E) Phase contrast images depicting differentiation phenotype (folded) of organoids derived from normal colon and adenoma organoid cultures (top row); adenoma organoids expressing NTC or two distinct shRNAs against SOX9 (bottom row). Quantification of differentiating organoids in indicated cultures at days 2 and 3; Par, parental. (F) Representative images of H&E; AB staining; and SOX9, KRT20, and MUC2 IHC of NTC and SOX KD FAP adenoma organoids. (G) Normalized mRNA expression of SOX9, LGR5, AXIN2, KRT20, LY6E, and TROP2 in indicated organoids: normal adjacent mucosa (N), adenoma-NTC (Ad), and adenoma-SOX9 KD (Ad-KD). (H) Schematic summarizing AbSC transcriptional program and developmental reprogramming obstructing intestinal differentiation in CRC initiation and the ability of SOX9 suppression to reverse these effects.

References

    1. K. K. Banerjee, M. Saxena, N. Kumar, L. Chen, A. Cavazza, N. H. Toke, N. K. O'Neill, S. Madha, U. Jadhav, M. P. Verzi, R. A. Shivdasani, Enhancer, transcriptional, and cell fate plasticity precedes intestinal determination during endoderm development. Genes Dev. 32, 1430–1442 (2018). - PMC - PubMed
    1. F. de Sousa E Melo, F. J. de Sauvage, Cellular plasticity in intestinal homeostasis and disease. Cell Stem Cell 24, 54–64 (2019). - PubMed
    1. D. Shlyueva, G. Stampfel, A. Stark, Transcriptional enhancers: From properties to genome-wide predictions. Nat. Rev. Genet. 15, 272–286 (2014). - PubMed
    1. I. Arozarena, C. Wellbrock, Phenotype plasticity as enabler of melanoma progression and therapy resistance. Nat. Rev. Cancer 19, 377–391 (2019). - PubMed
    1. P. B. Gupta, I. Pastushenko, A. Skibinski, C. Blanpain, C. Kuperwasser, Phenotypic plasticity: driver of cancer initiation, progression, and therapy resistance. Cell Stem Cell 24, 65–78 (2019). - PMC - PubMed