. 2023 Mar 29;15(689):eadf0141.
doi: 10.1126/scitranslmed.adf0141. Epub 2023 Mar 29.

The neuronal pentraxin Nptx2 regulates complement activity and restrains microglia-mediated synapse loss in neurodegeneration

Affiliations

The neuronal pentraxin Nptx2 regulates complement activity and restrains microglia-mediated synapse loss in neurodegeneration

Jiechao Zhou et al. Sci Transl Med. .

Abstract

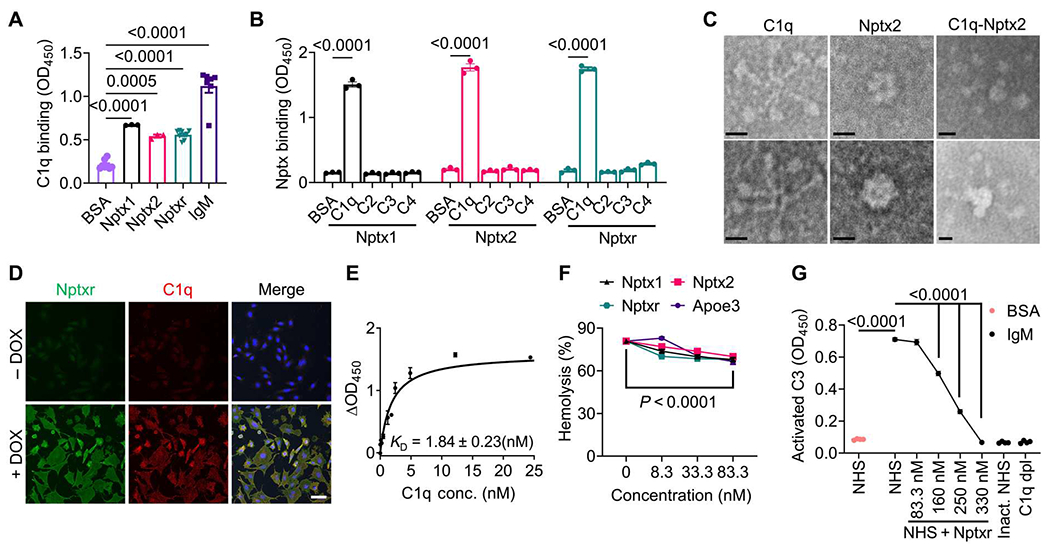
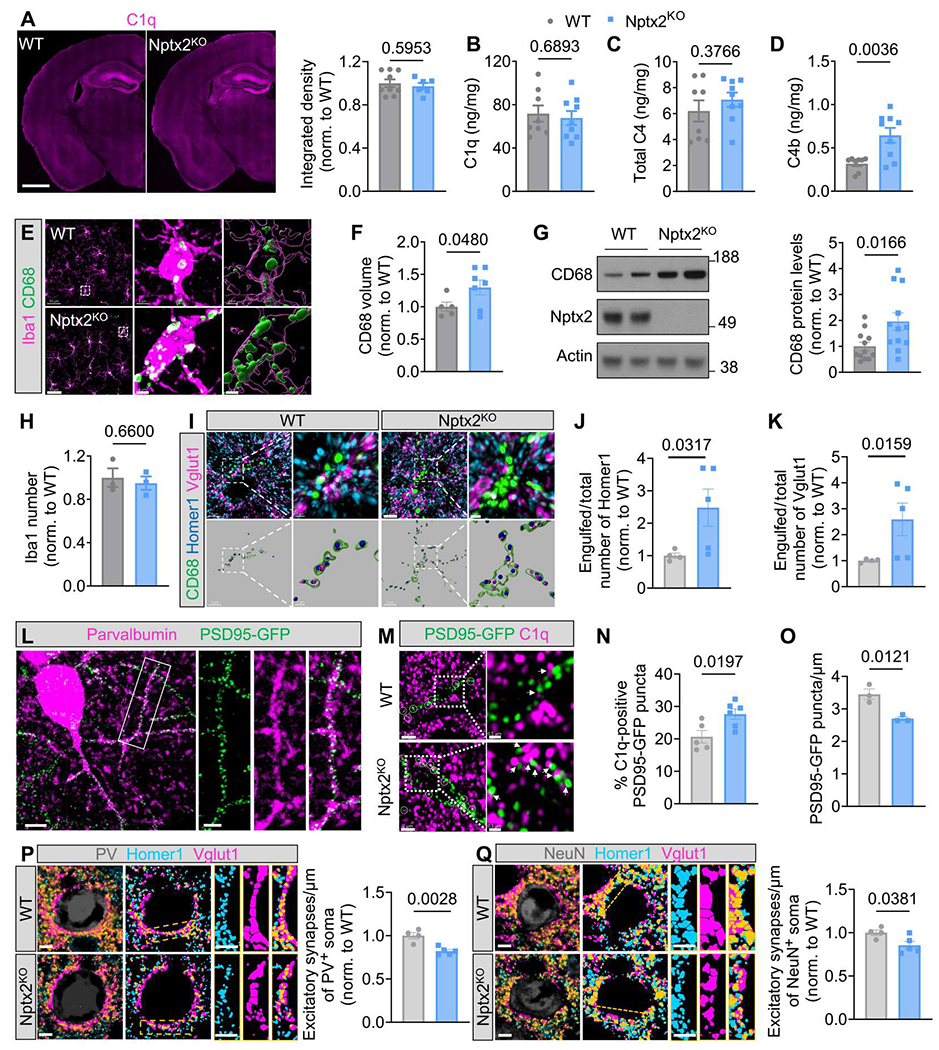
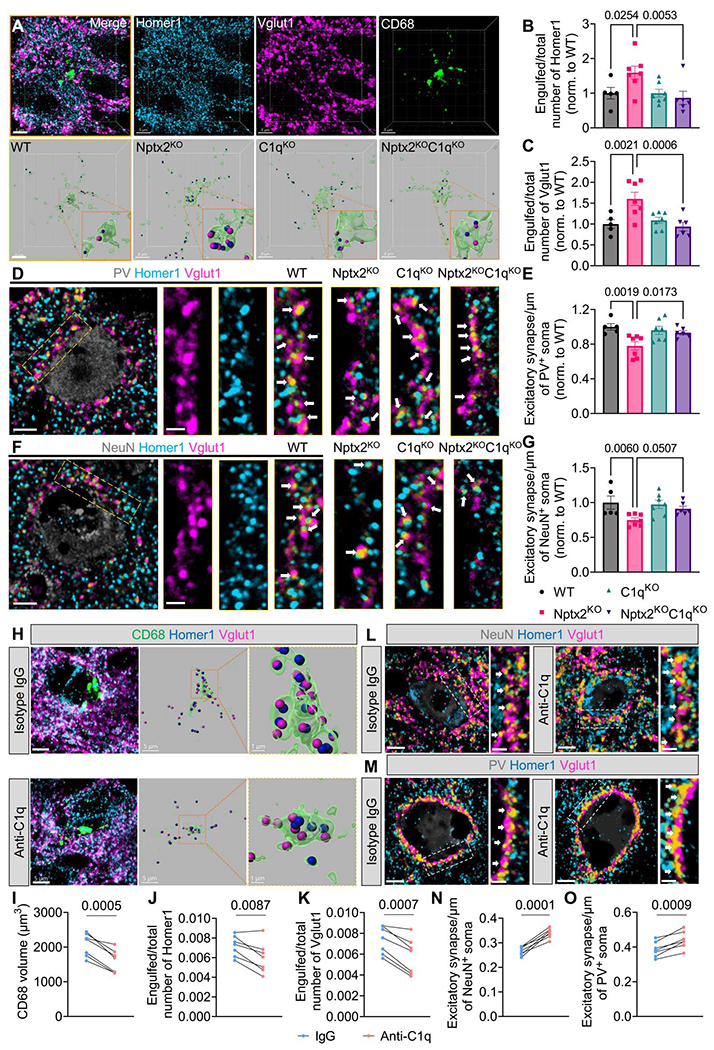
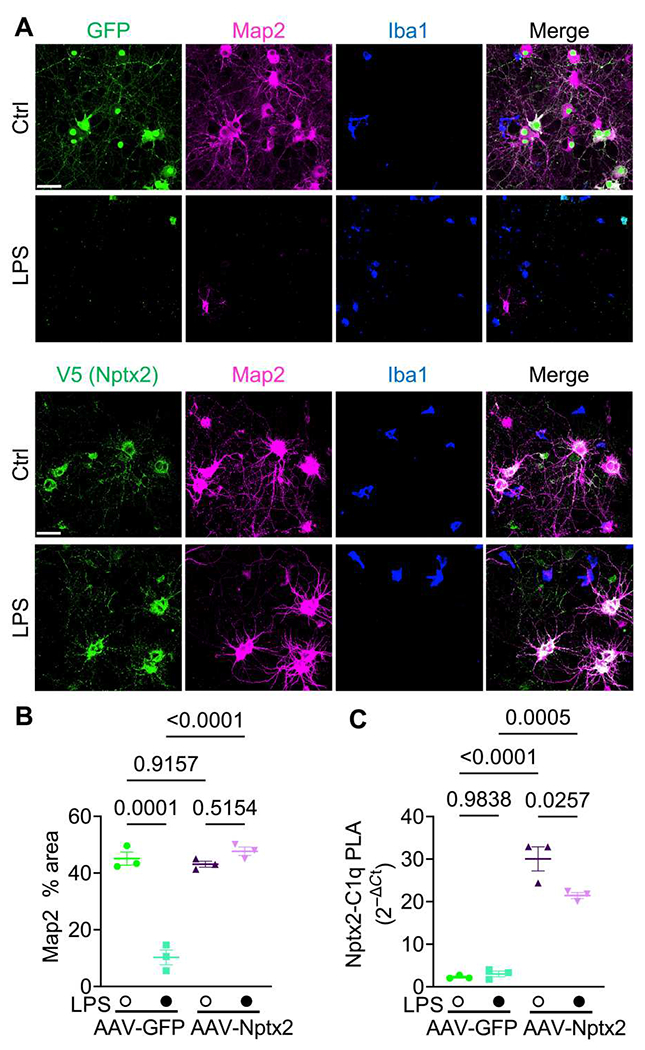
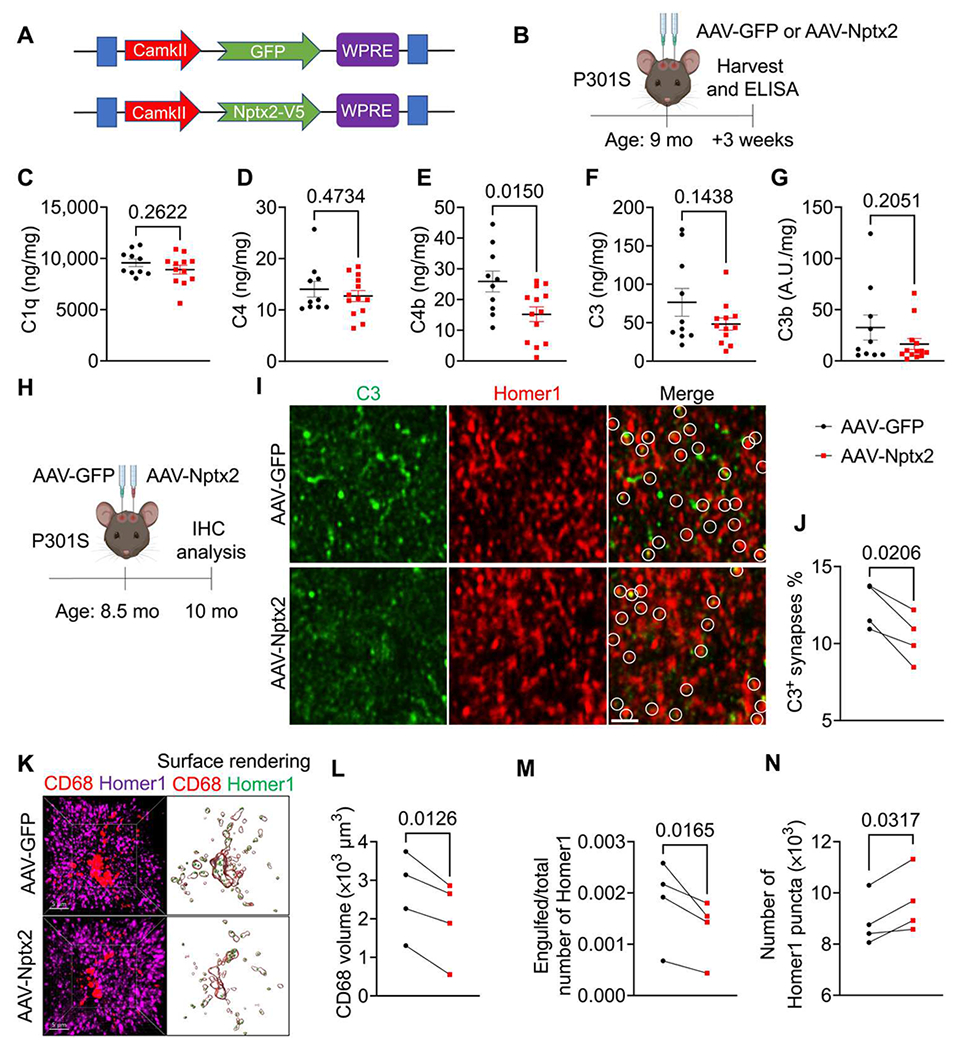
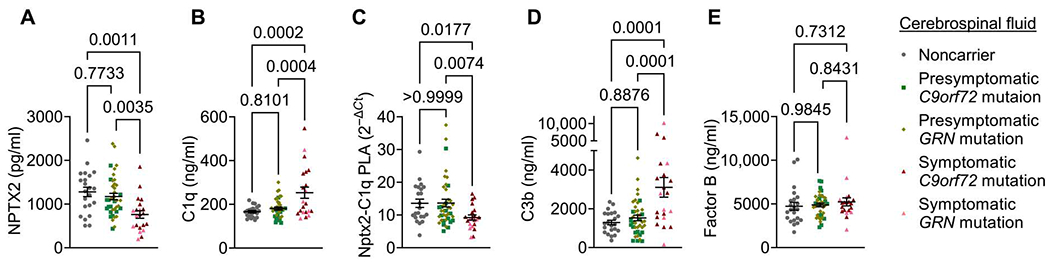
Complement overactivation mediates microglial synapse elimination in neurological diseases such as Alzheimer's disease (AD) and frontotemporal dementia (FTD), but how complement activity is regulated in the brain remains largely unknown. We identified that the secreted neuronal pentraxin Nptx2 binds complement C1q and thereby regulates its activity in the brain. Nptx2-deficient mice show increased complement activity, C1q-dependent microglial synapse engulfment, and loss of excitatory synapses. In a neuroinflammation culture model and in aged TauP301S mice, adeno-associated virus (AAV)-mediated neuronal overexpression of Nptx2 was sufficient to restrain complement activity and ameliorate microglia-mediated synapse loss. Analysis of human cerebrospinal fluid (CSF) samples from a genetic FTD cohort revealed reduced concentrations of Nptx2 and Nptx2-C1q protein complexes in symptomatic patients, which correlated with elevated C1q and activated C3. Together, these results show that Nptx2 regulates complement activity and microglial synapse elimination in the brain and that diminished Nptx2 concentrations might exacerbate complement-mediated neurodegeneration in patients with FTD.


Conflict of interest statement

Competing interests: M.S. is a scientific cofounder and senior advisory board member of Neumora Therapeutics and a senior advisory board member of Biogen, Vanqua Bio, ArcLight Therapeutics, and Cerevel Therapeutics. P.F.W. and M.-F.X. are cofounders of CogNext. J.E.H. is employed by Genentech. The other authors declare that they have no competing interests.

Figures

Fig. 1.
Fig. 1.. NPTXs bind C1q and inhibit CCP activity in vitro.
(A) Microtiter wells were coated with BSA, IgM, or NPTXs (Nptx1, Nptx2, and Nptxr) as indicated and incubated with C1q. Binding of C1q to the wells was detected using an anti-C1q antibody. P values were determined by one-way ANOVA followed by Šidák post hoc test. (B) Microtiter wells were coated with BSA or complement proteins (C1q, C2, C3, and C4) as indicated. Binding of His-tagged NPTXs was monitored using an anti-His antibody. P values were determined by two-way ANOVA followed by Šidák post hoc test. (C) Shown are representative images of negative staining electron microscopy of purified C1q, Nptx2, and C1q-Nptx2 complexes. Scale bars, 10 nm. (D) C1q cell surface binding assays were conducted with a stable tetracycline-inducible CHO cell line that coexpressed Nptxr and Nptx2. C1q proteins were added to the fresh culture medium, and bound C1q was visualized by immunofluorescence labeling (red). Expression of Nptxr was detected with a Nptxr-specific antibody (green). Images are shown of cells treated with (+DOX) or without (−DOX) doxycycline. Scale bar, 50 μm. (E) Cell surface binding of C1q to Nptxr- and Nptx2-expressing CHO cells was quantified. Stable-inducible CHO cells expressing Nptxr and Nptx2 were incubated with C1q at indicated concentrations. Bound C1q was detected with an anti-C1q antibody. The signal shown was subtracted from the background in CHO cells without induced Nptxr expression (ΔOD450). (F) The ability of NPTX to inhibit hemolysis of sheep erythrocytes was tested. Purified Nptx1, Nptx2, Nptxr, or ApoE3 was incubated in NHS, which was activated using CCP-specific GVB++ buffer, and lysis of sheep erythrocytes was analyzed by measuring released hemoglobin at 415 nm. P values were determined by two-way ANOVA followed by Šidák post hoc test. (G) The ability of Nptxr to inhibit CCP and activated C3 deposition was measured. NHS (1%) supplemented with recombinant Nptxr was added to IgM-coated microtiter plates, and activated C3 deposition was measured using specific antibodies. Heat-inactivated (Inact.) NHS and C1q-depleted (dpl) human serum were used as negative controls. P values were determined by one-way ANOVA followed by Šidák post hoc test. Data are presented as means ± SEM. Each dot represents data from individual samples. OD450, optical density at 450 nm.
Fig. 2.
Fig. 2.. Nptx2 regulates complement activity in vivo.
(A) Shown on the left are representative images of C1q immunostaining in WT and Nptx2KO mice brains. Scale bar, 1000 μm. The right shows quantification of C1q immunofluorescence in WT and Nptx2KO brains. P values were determined by unpaired t test. n = 9 for WT; n = 6 for Nptx2KO. Norm., normalized. (B to D) C1q (B), C4 (C), and C4b (D) concentration in WT and Nptx2KO cortices was measured by ELISA. P values were determined by unpaired t test. n = 8 for WT; n = 9 for Nptx2KO. (E) Shown are representative confocal images of CD68 (green) and Iba1 (magenta) immunostaining in WT and Nptx2KO cortical layers II to V. Scale bars, 30 μm and 2 μm (inset). (F) CD68 volume was quantified in WT and Nptx2KO cortical layers II to V. P values were determined by unpaired t test. n = 5 for WT; n = 7 for Nptx2KO. (G) Representative Western blots and quantification show CD68 abundance in hippocampi from WT and Nptx2KO cortices. P values were determined by unpaired t test. n = 12 for WT; n = 12 for Nptx2KO. (H) The number of Iba1+ microglia in WT and Nptx2KO whole brains was quantified. P values were determined by unpaired t test. n = 3 for WT; n = 3 for Nptx2KO. (I to K) Shown are representative confocal images and three-dimensional (3D) surface rendering of immunostained CD68 (green), Vglut1 (magenta), and Homer1 (blue) in WT and Nptx2KO cortical layers II to V (I). Scale bars, 5 μm and 1 μm (inset). Homer1 (J) and Vglut1 (K) puncta inside CD68+ lysosomes were quantified. P values were determined by unpaired t test. n = 4 for WT; n = 5 for Nptx2KO. (L) Representative confocal images of PSD95-GFP and immunostained parvalbumin are shown in samples from PSD95-GFPf/f:PV-Cre WT cortical layers II to V. Scale bars, 10 μm and 4 μm (inset). (M) Shown are representative confocal images of immunostained C1q (magenta) and PSD95-GFP (green) in PSD95-GFPf/f:PV-Cre:WT and Nptx2KO hippocampus CA1 strata radiata. White circles and white arrowheads indicate C1q colocalized with PSD95-GFP. Scale bars, 2 μm and 0.5 μm (inset). (N) The percentage of C1q + PSD95-GFP puncta in WT and Nptx2KO hippocampi was quantified. P values were determined by unpaired t test. n = 5 for WT; n = 6 for Nptx2KO. (O) PSD95-GFP puncta density was quantified in PSD95-GFPf/f:PV-Cre:WT and Nptx2KO hippocampi. P values were determined by unpaired t test. n = 3 for WT; n = 3 for Nptx2KO. (P) Shown on the left are representative confocal images and mask of immunostained PV (gray), Homer1 (blue), and Vglut1 (magenta) in WT and Nptx2KO cortical layers II to V. The bar graph on the right shows excitatory synapse density around somas of PV+ cells. P values were determined by unpaired t test. n = 4 for WT; n = 5 for Nptx2KO. Scale bars, 5 μm. (Q) Shown on the left are representative confocal images and mask of immunostained NeuN (gray), Homer1 (blue), and Vglut1 (magenta) in WT and Nptx2KO cortical layers II to V. Scale bars, 5 μm. The bar graph on the right shows normalized number of excitatory synapses around NeuN+ soma. P values were determined by unpaired t test. n = 4 for WT; n = 5 for Nptx2KO. Scale bars, 5 μm. Data are presented as means ± SEM. Each dot represents data from one mouse.
Fig. 3.
Fig. 3.. Complement inhibition rescues synapse loss in Nptx2KO brains.
(A) Shown are representative confocal images and 3D surface reconstructions of Homer1 (blue), Vglut1 (magenta), and CD68 (green) in mouse cortical layers II to IV. Scale bars, 5 μm. (B and C) The relative amount of Homer1 (B) and Vglut1 (C) puncta within CD68+ microglial lysosomes was quantified. P values were determined by one-way ANOVA followed by Šidák post hoc test. n = 5 for WT; n = 7 for Nptx2KO; n = 7 for C1qKO; n = 6 for Nptx2KO;C1qKO. (D and E) Shown are representative confocal images (D) and quantification (E) of excitatory synapse density around somas of PV+ cells in the cortical layers II to V. White arrows indicate synapses, which were identified by colocalization of Homer1 and Vglut1 puncta. P values were determined by one-way ANOVA followed by Šidák post hoc test. n = 5 for WT; n = 7 for Nptx2KO; n = 7 for C1qKO; n = 6 for Nptx2KO;C1qKO. Scale bars, 5 μm and 2 μm (inset). (F and G) Shown are representative confocal images (F) and quantification (G) of excitatory synapse density around somas of NeuN+ cells in cortical layers II to V. White arrows indicate synapses, which were identified by colocalization of Homer1 and Vglut1 puncta. P values were determined by one-way ANOVA followed by Šidák post hoc test. n = 5 for WT; n = 7 for Nptx2KO; n = 7 for C1qKO; n = 6 for Nptx2KO;C1qKO. Scale bars, 5 μm and 2 μm (inset). (H) Shown are representative confocal images and 3D surface reconstructions of CD68 (green), Vglut1 (magenta), and Homer1 (blue) in control IgG and C1q-blocking antibody-injected Nptx2KO cortices. Scale bars, 5 μm and 1 μm (inset). (I) Volume of CD68+ microglial lysosomes in the cortices of Nptx2KO mice injected with control IgG and C1q-blocking antibody was quantified. P value was determined by paired t test. n = 7. (J and K) The relative amount of Homer1 (J) and Vglut1 (K) puncta within CD68+ microglial lysosomes was quantified in the cortices of Nptx2KO mice injected with isotype IgG antibody or C1q-blocking antibody. P values were determined by paired t test. n = 7. (L) Shown are representative confocal images of immunostained NeuN (gray), Homer1 (blue), and Vglut1 (magenta) in the cortical layers II-V of Nptx2KO mice injected with control IgG or C1q-blocking antibody. White arrows indicate synapses, which were identified by colocalization of Homer1 and Vglut1. P value was determined by paired t test. n = 7; Scale bars, 5 μm and 2 μm (inset). (M) Shown are representative confocal images of immunostained PV (gray), Homer1 (blue), and Vglut1 (magenta) in the cortical layers II to V of Nptx2KO mice injected with control IgG or C1q-blocking antibody. White arrows indicate synapses, which were identified by colocalized Homer1 and Vglut1 puncta. Scale bars, 5 μm and 2 μm (inset). (N) Excitatory synapse density around somas of NeuN+ cells was quantified. P value was determined by paired t test. n = 7. (O) Excitatory synapse density around somas of PV+ cells was quantified. P value was determined by paired t test. n = 7. Data are presented as means ± SEM. Each dot represents data from one mouse.
Fig. 4.
Fig. 4.. Neuronal Nptx2 overexpression limits complement-mediated neurotoxicity in a neuroinflammation neuron-microglia coculture model.
(A) Shown are representative images of immunostained Map2, Iba1, and Nptx2-V5 or GFP fluorescence in neuron-microglia cocultures treated with LPS or vehicle (Ctrl) for 24 hours. Neurons were infected with AAV-GFP or AAV-Nptx2-V5. Scale bars, 50 μm. (B) The percentage of Map2+ area in indicated cultures was quantified. Three independent neuron-microglia cocultures were used per condition. P values were determined by two-way ANOVA followed by Tukey post hoc test. (C) Nptx2-C1q complex abundance in culture medium was analyzed by proximity ligation assay (PLA). Media from three independent neuron-microglia cocultures were used. P values were determined by two-way ANOVA followed by Tukey post hoc test.
Fig. 5.
Fig. 5.. AAV-induced Nptx2 overexpression ameliorates synapse loss in P301S mice.
(A) Shown is a schematic representation of AAV-CamKII-GFP and AAV-CamKII-Nptx2-V5 constructs used for in vivo studies. (B) Shown is a schematic illustration of the workflow and data analysis. AAVs were injected bilaterally into hippocampi of 9-month-old male and female P301S mice and analyzed by ELISA 3 weeks later. (C to G) Concentrations of C1q (C), C4 (D), C4b (E), C3 (F), and C3b (G) were measured in hippocampus lysates from AAV-GFP– and AAV-NPTX2–injected P301S mice. Protein concentrations were measured by ELISA and are expressed as ng or A.U. (arbitrary unit)/mg of total protein. P values were determined by unpaired t test. AAV-GFP, n = 10; AAV-Nptx2, n = 13 (n = 12 for C1q and C3 ELISA because of low protein yield in one sample). (H) Shown is a schematic illustration of AAV injection into hippocampi of 8.5-month-old P301S mice and IHC analysis 6 weeks later. (I) Shown are representative confocal images of immunostained C3 (green) and Homer1 (red) in AAV-GFP– and AAV-Nptx2–injected hippocampal regions of P301S mice. White circles indicate C3 colocalized with Homer1. Scale bar, 2 μm. (J) The percentage of C3-labeled Homer1 puncta in AAV-GFP– and AAV-Nptx2–injected hippocampi from P301S mice was quantified. P value was determined by paired t test. n = 4. (K) Shown are representative confocal images and 3D surface renderings of Homer1 and CD68+ microglial lysosomes in AAV-GFP– and AAV-Nptx2–injected hippocampi of P301S mice. (L) The volume of CD68+ structures in AAV-GFP– and AAV-Nptx2–injected hippocampi of P301S mice was quantified. P value was determined by paired t test. n = 4. (M) The fraction of Homer1 puncta within CD68+ lysosomes in AAV-GFP– and AAV-NPTX2–injected hippocampi of P301S mice was quantified. P value was determined by paired t test. n = 4. (N) The relative spot number of Homer1 in AAV-GFP– and AAV-NPTX2–injected hippocampi of P301S mice was quantified. P value was determined by paired t test. n = 4. Data are presented as means ± SEM. Each dot represents data from individual samples.
Fig. 6.
Fig. 6.. Nptx2, C1q, and Nptx2-C1q complex concentrations are altered in genetic FTD.
(A and B) Concentrations of Nptx2 (A) and C1q (B) were quantified in cerebrospinal fluid (CSF) from noncarriers as well as presymptomatic and symptomatic carriers of C9orf72 or GRN mutations. Protein concentrations were measured by ELISA. Nptx2 concentrations were measured and reported previously (28). P values were determined by one-way ANOVA test followed by Šidák post hoc test. (C) NPTX2-C1q complex abundance in CSF samples was analyzed by PLA. Quantitative qPCR data are represented using 2−ΔCt. P values were determined by one-way ANOVA test followed by Šidák post hoc test. (D and E) Concentrations of C3b (D) and factor B (E) were quantified in CSF from noncarriers as well as presymptomatic and symptomatic carriers of C9orf72 or GRN mutations. Protein concentrations were measured by ELISA. P values were determined by one-way ANOVA test followed by Šidák post hoc test. All data are presented as means ± SEM. Each dot represents data from one individual. Noncarriers, n = 22; presymptomatic GRN mutation, n = 25; presymptomatic C9orf72, n = 15; symptomatic GRN mutation, n = 7; symptomatic C9orf72, n = 14 (n = 13 for factor B ELISA).

References

    1. Volk L, Chiu S-L, Sharma K, Huganir RL, Glutamate synapses in human cognitive disorders. Annu. Rev. Neurosci 38, 127–149 (2015). - PubMed
    1. Wilton DK, Dissing-Olesen L, Stevens B, Neuron-glia signaling in synapse elimination. Annu. Rev. Neurosci 42, 107–127 (2019). - PubMed
    1. Neniskyte U, Gross CT, Errant gardeners: Glial-cell-dependent synaptic pruning and neurodevelopmental disorders. Nat. Rev. Neurosci 18, 658–670 (2017). - PubMed
    1. Stevens B, Allen NJ, Vazquez LE, Howell GR, Christopherson KS, Nouri N, Micheva KD, Mehalow AK, Huberman AD, Stafford B, Sher A, Litke AM, Lambris JD, Smith SJ, John SWM, Barres BA, The classical complement cascade mediates CNS synapse elimination. Cell 131, 1164–1178 (2007). - PubMed
    1. Schafer DP, Lehrman EK, Kautzman AG, Koyama R, Mardinly AR, Yamasaki R, Ransohoff RM, Greenberg ME, Barres BA, Stevens B, Microglia sculpt postnatal neural circuits in an activity and complement-dependent manner. Neuron 74, 691–705 (2012). - PMC - PubMed

Publication types