. 2023 Mar 29;15(689):eabq8513.
doi: 10.1126/scitranslmed.abq8513. Epub 2023 Mar 29.

Phosphorylation stabilized TET1 acts as an oncoprotein and therapeutic target in B cell acute lymphoblastic leukemia

Affiliations

Phosphorylation stabilized TET1 acts as an oncoprotein and therapeutic target in B cell acute lymphoblastic leukemia

Zhenhua Chen et al. Sci Transl Med. .

Abstract

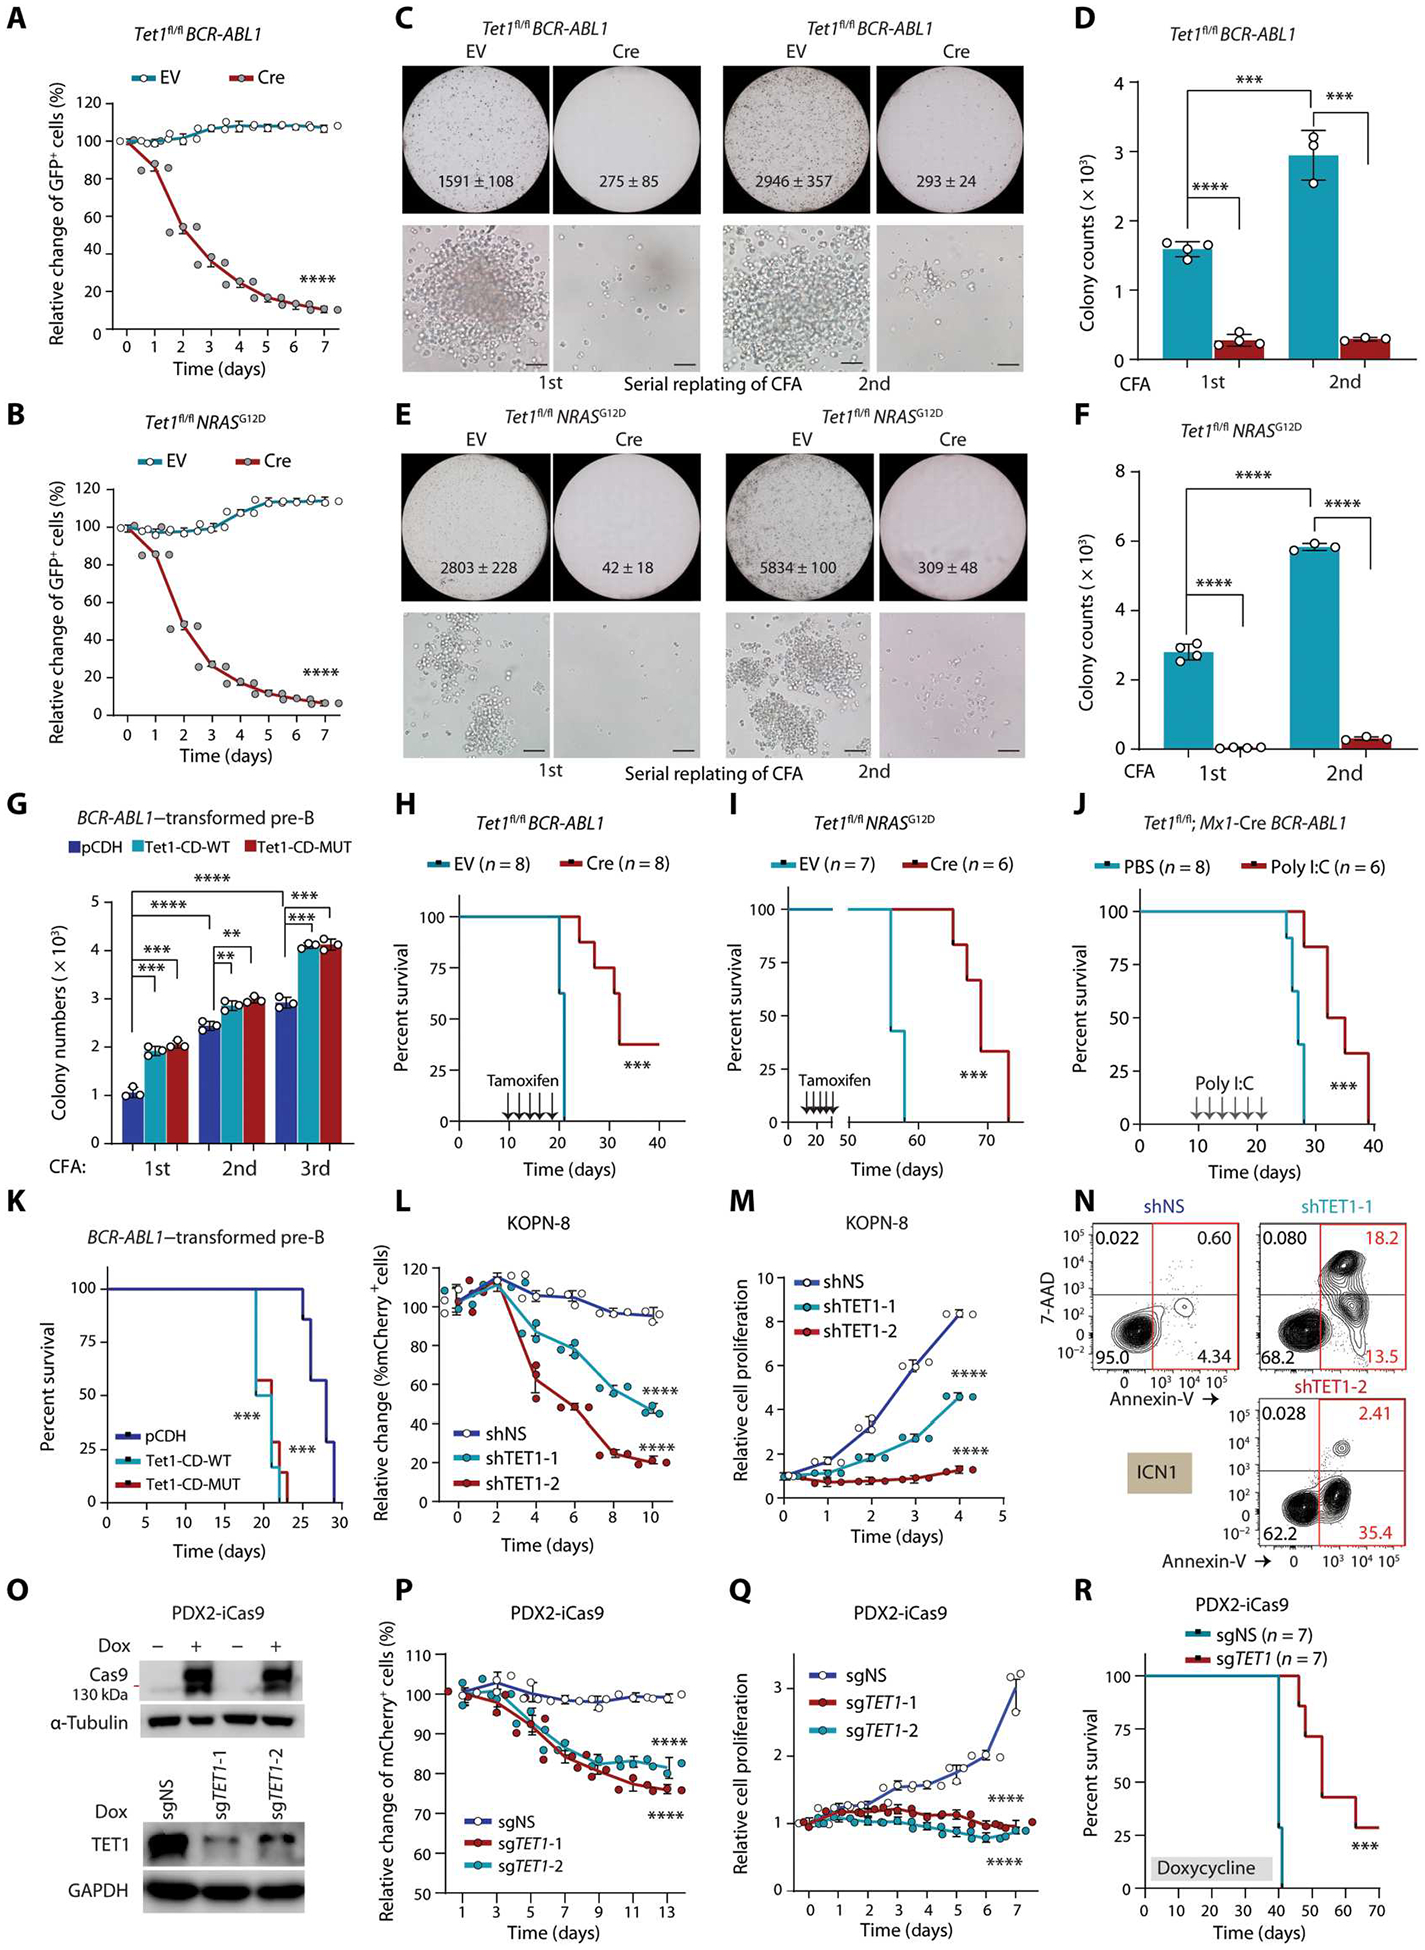
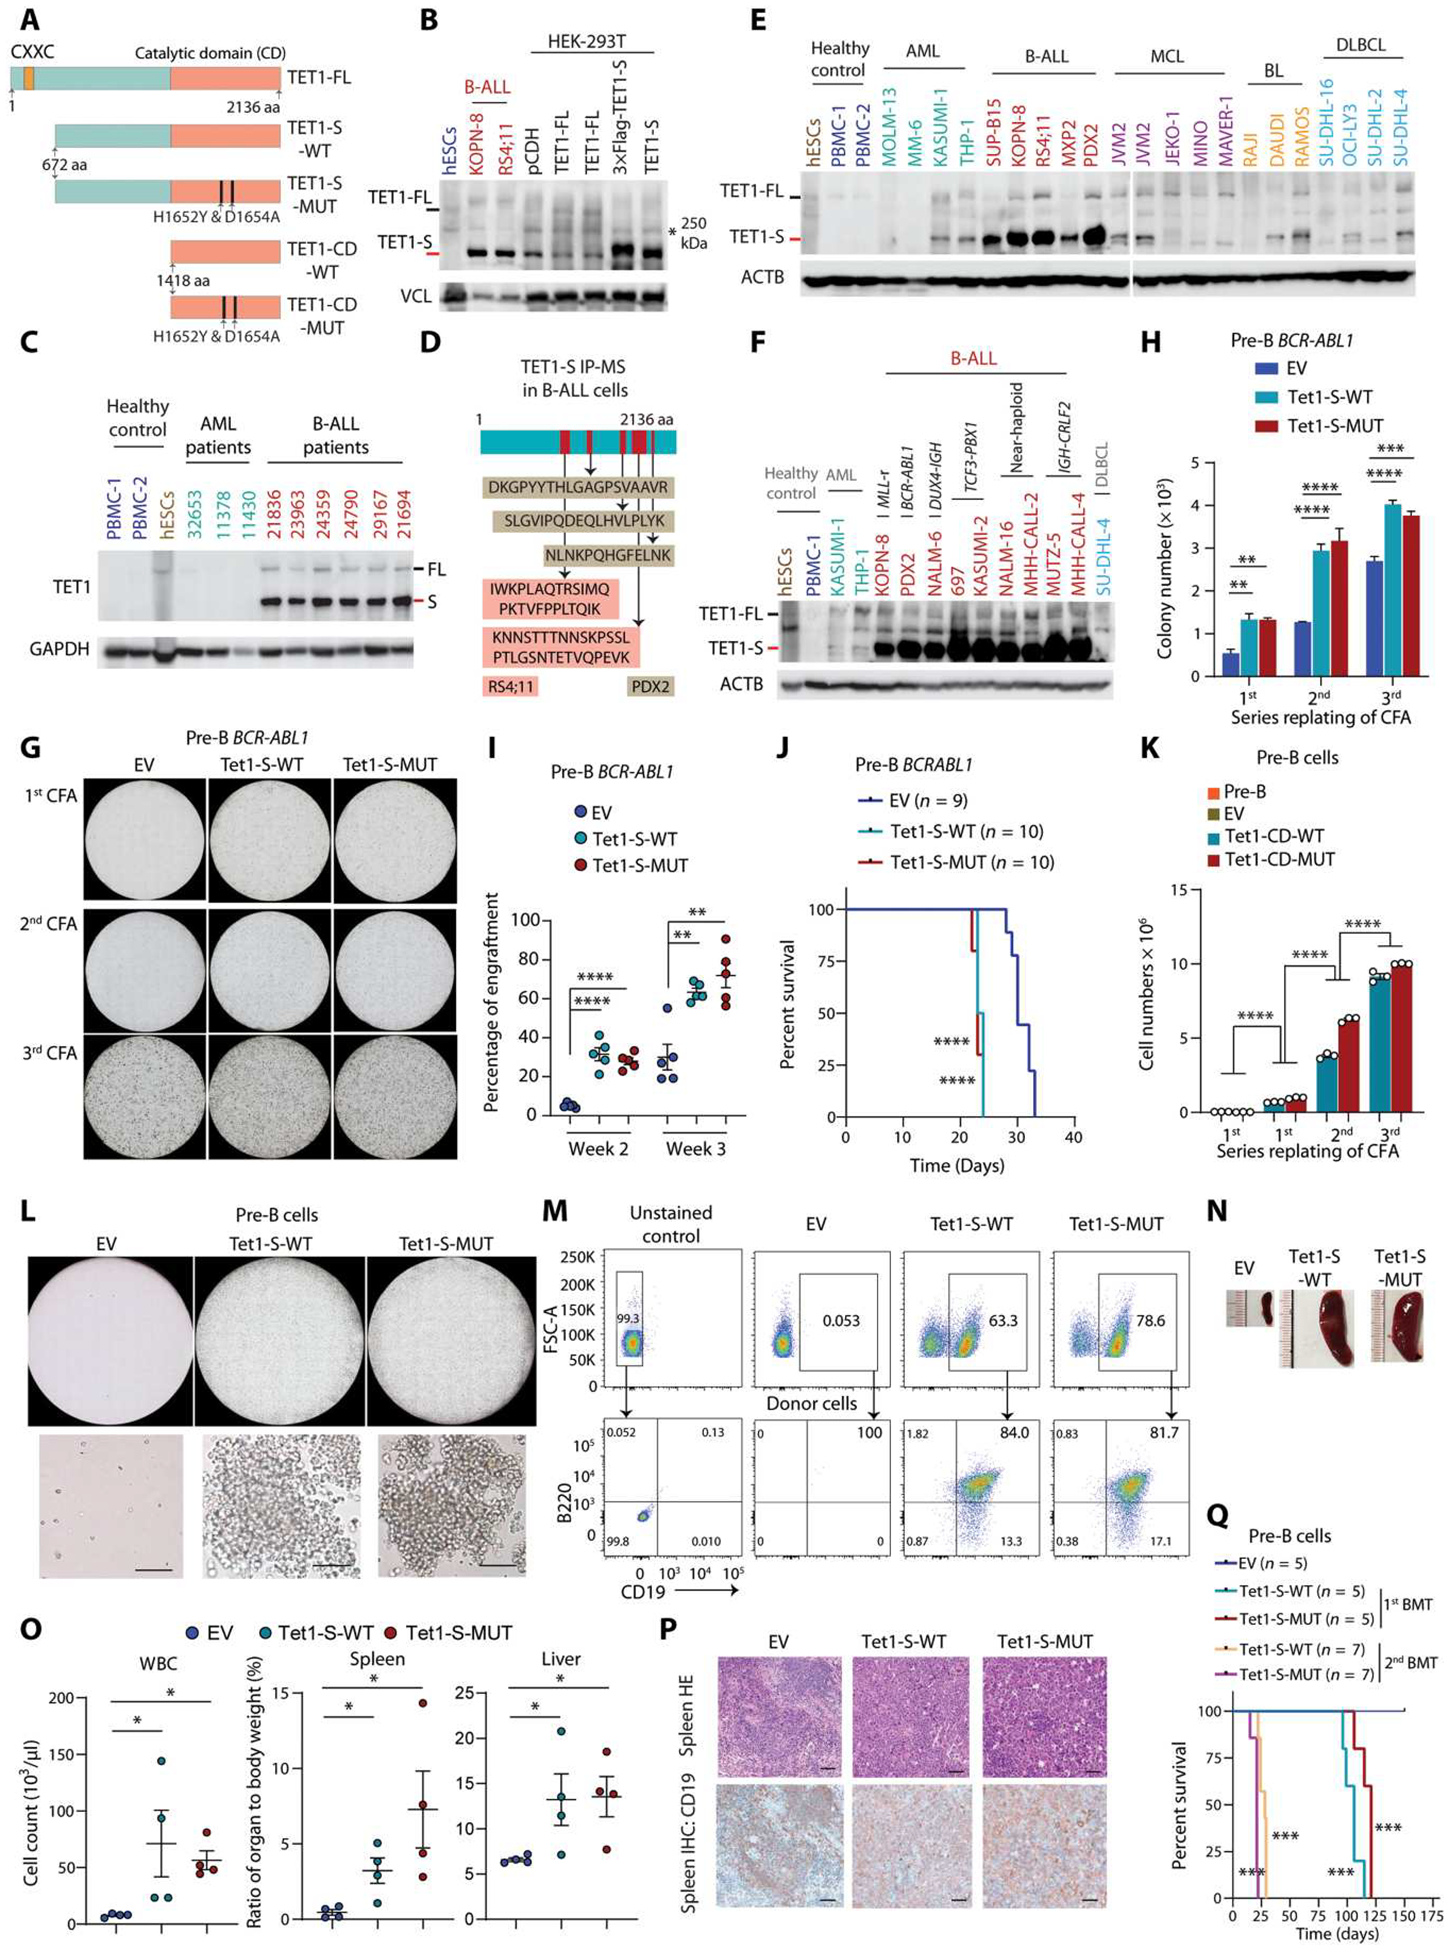
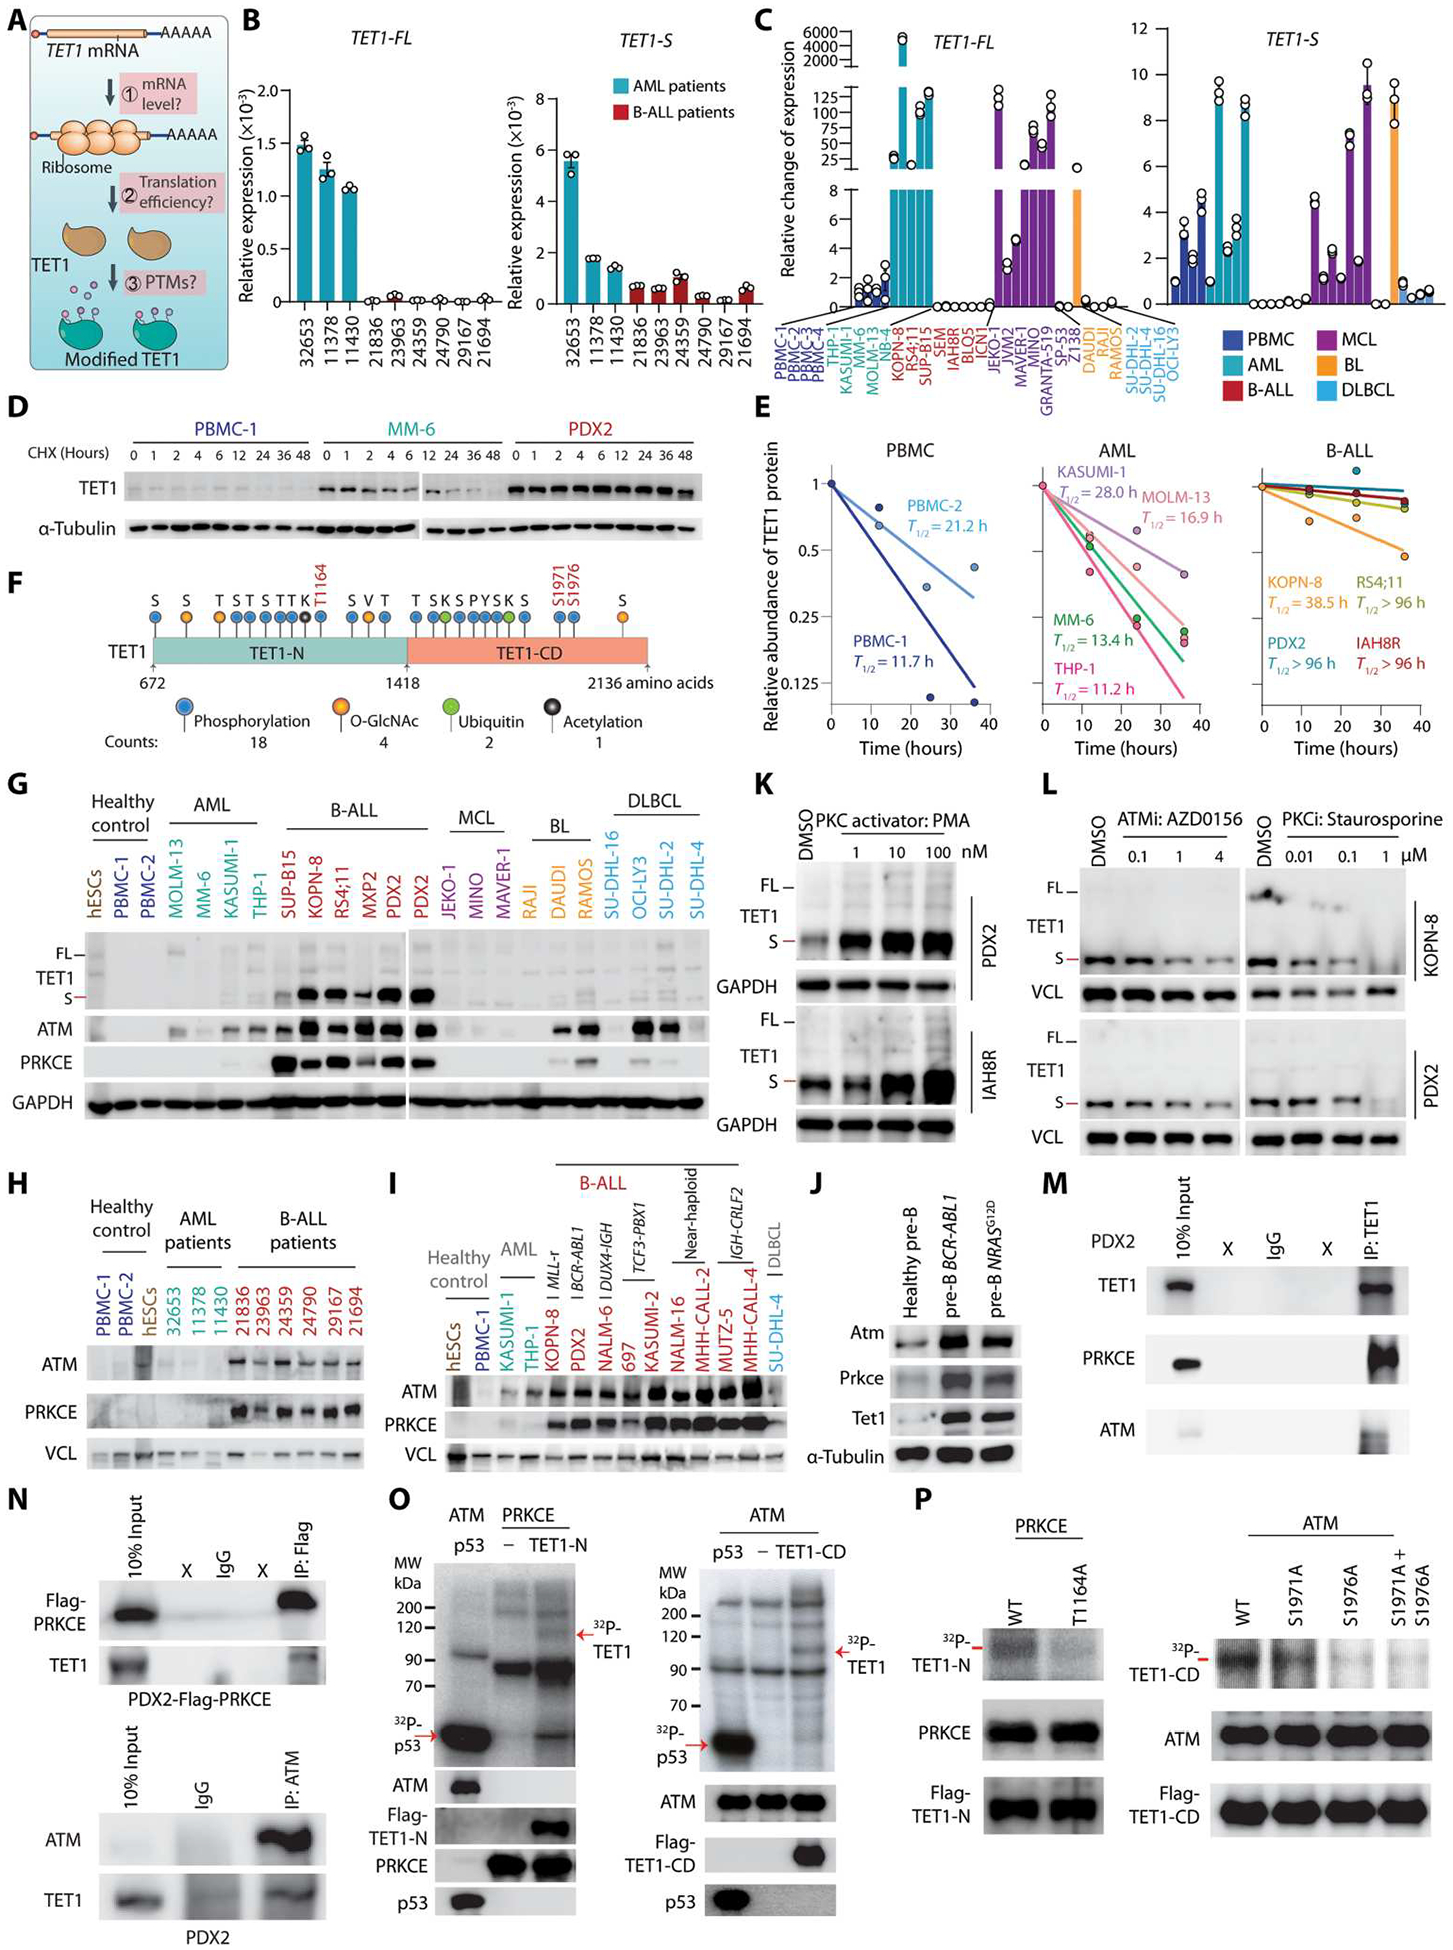
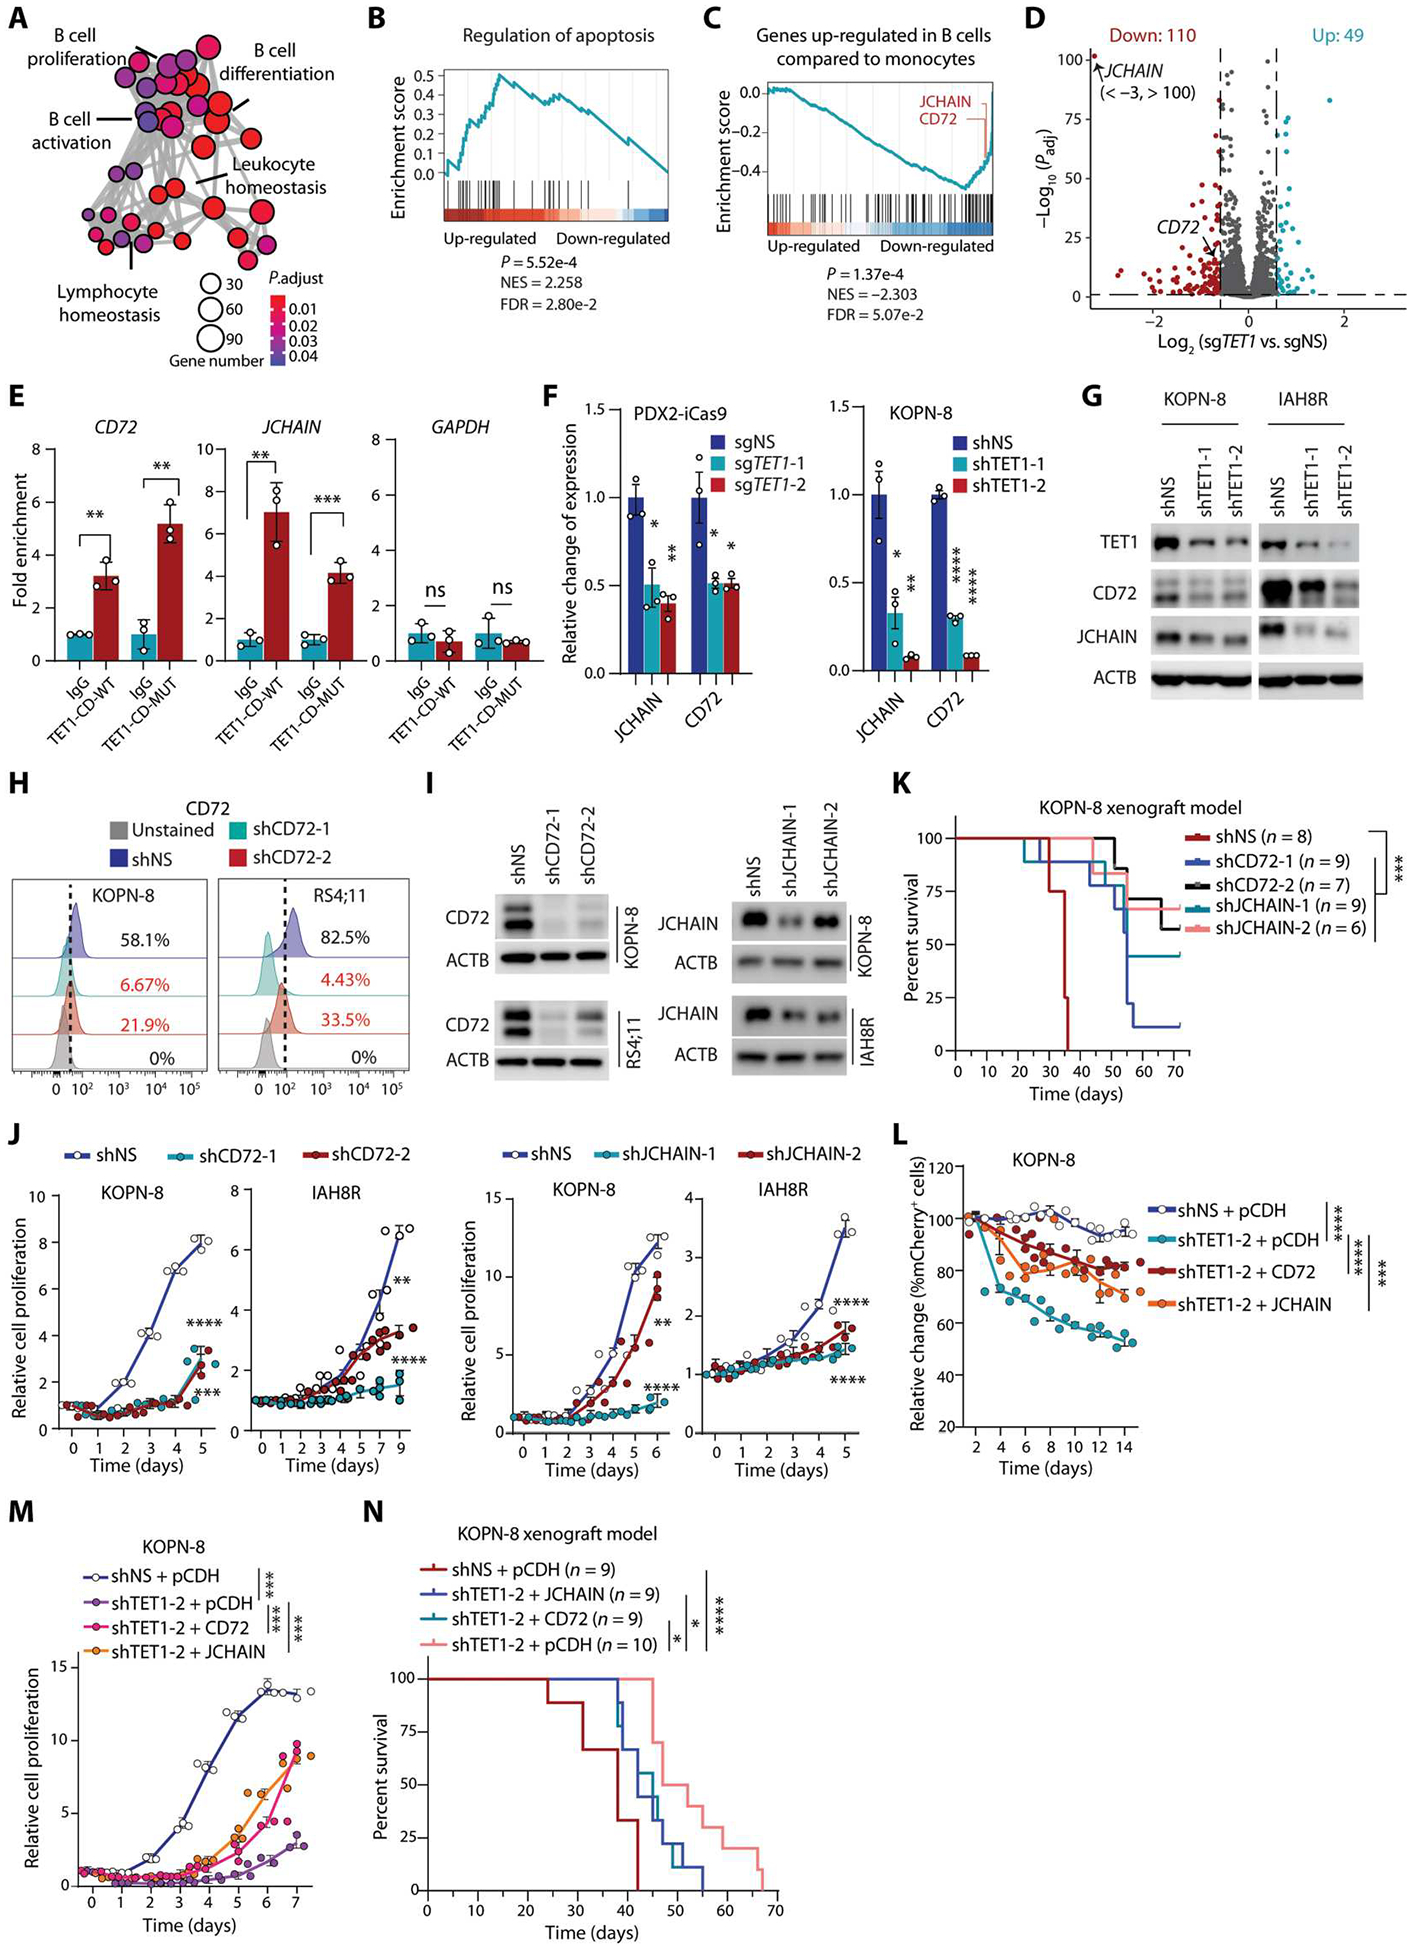
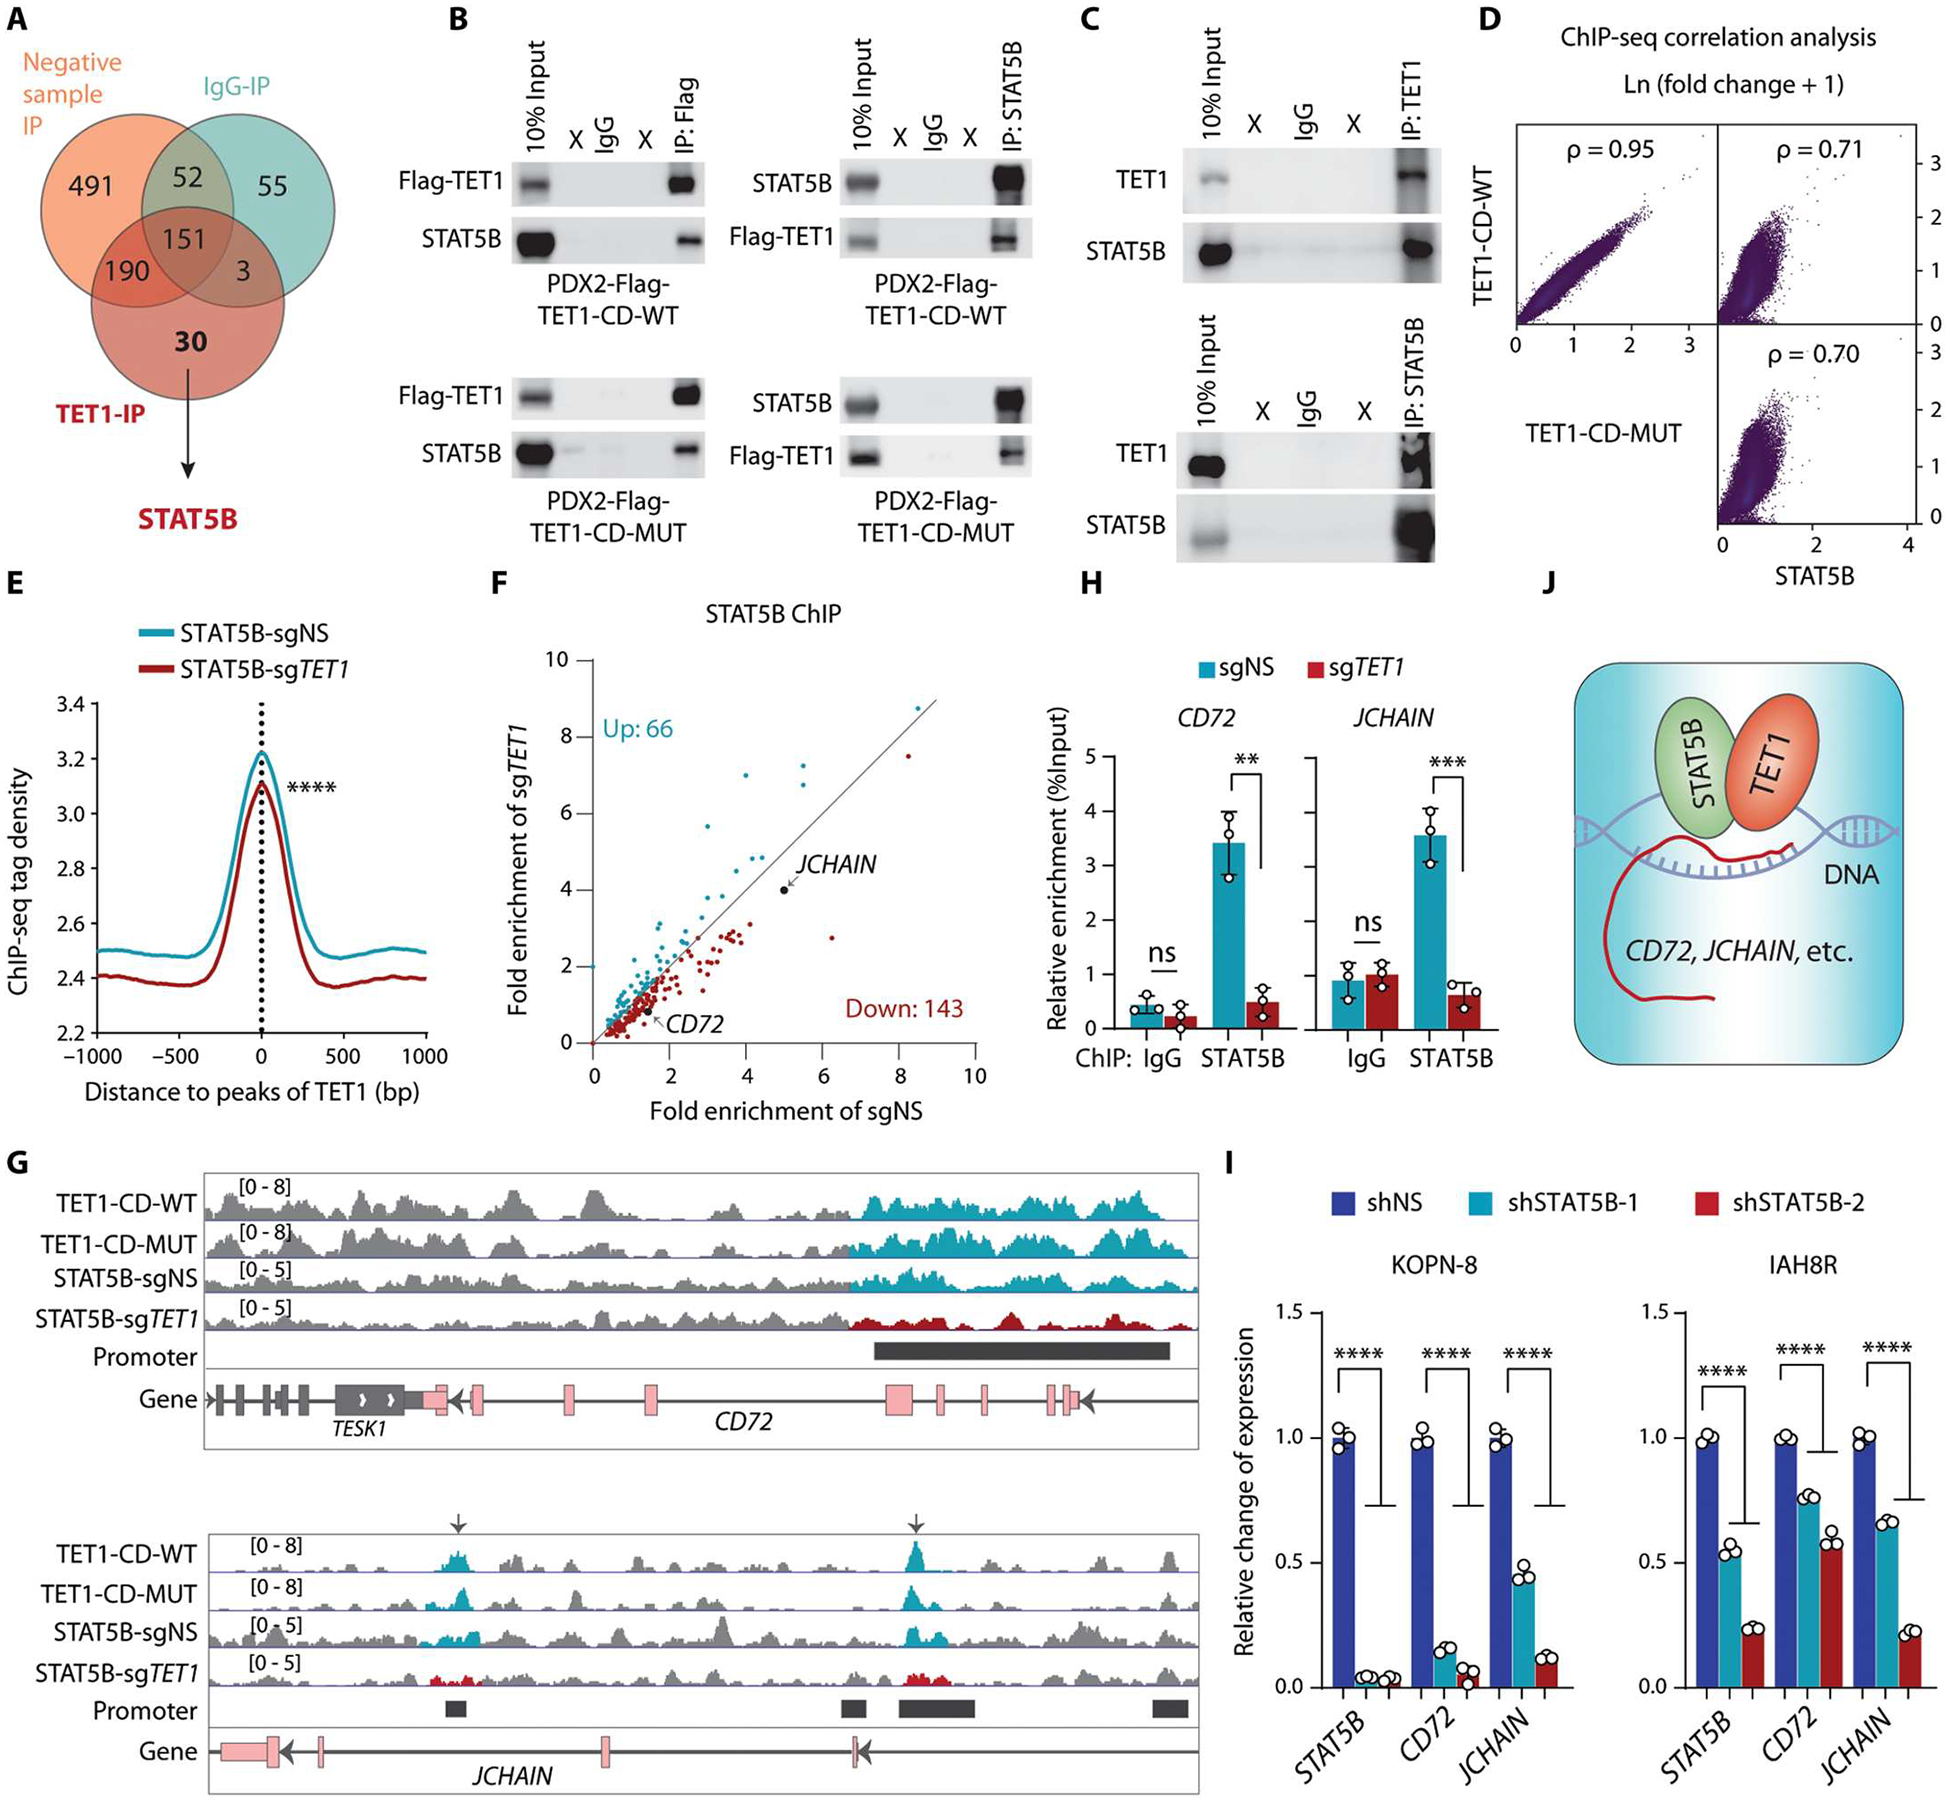
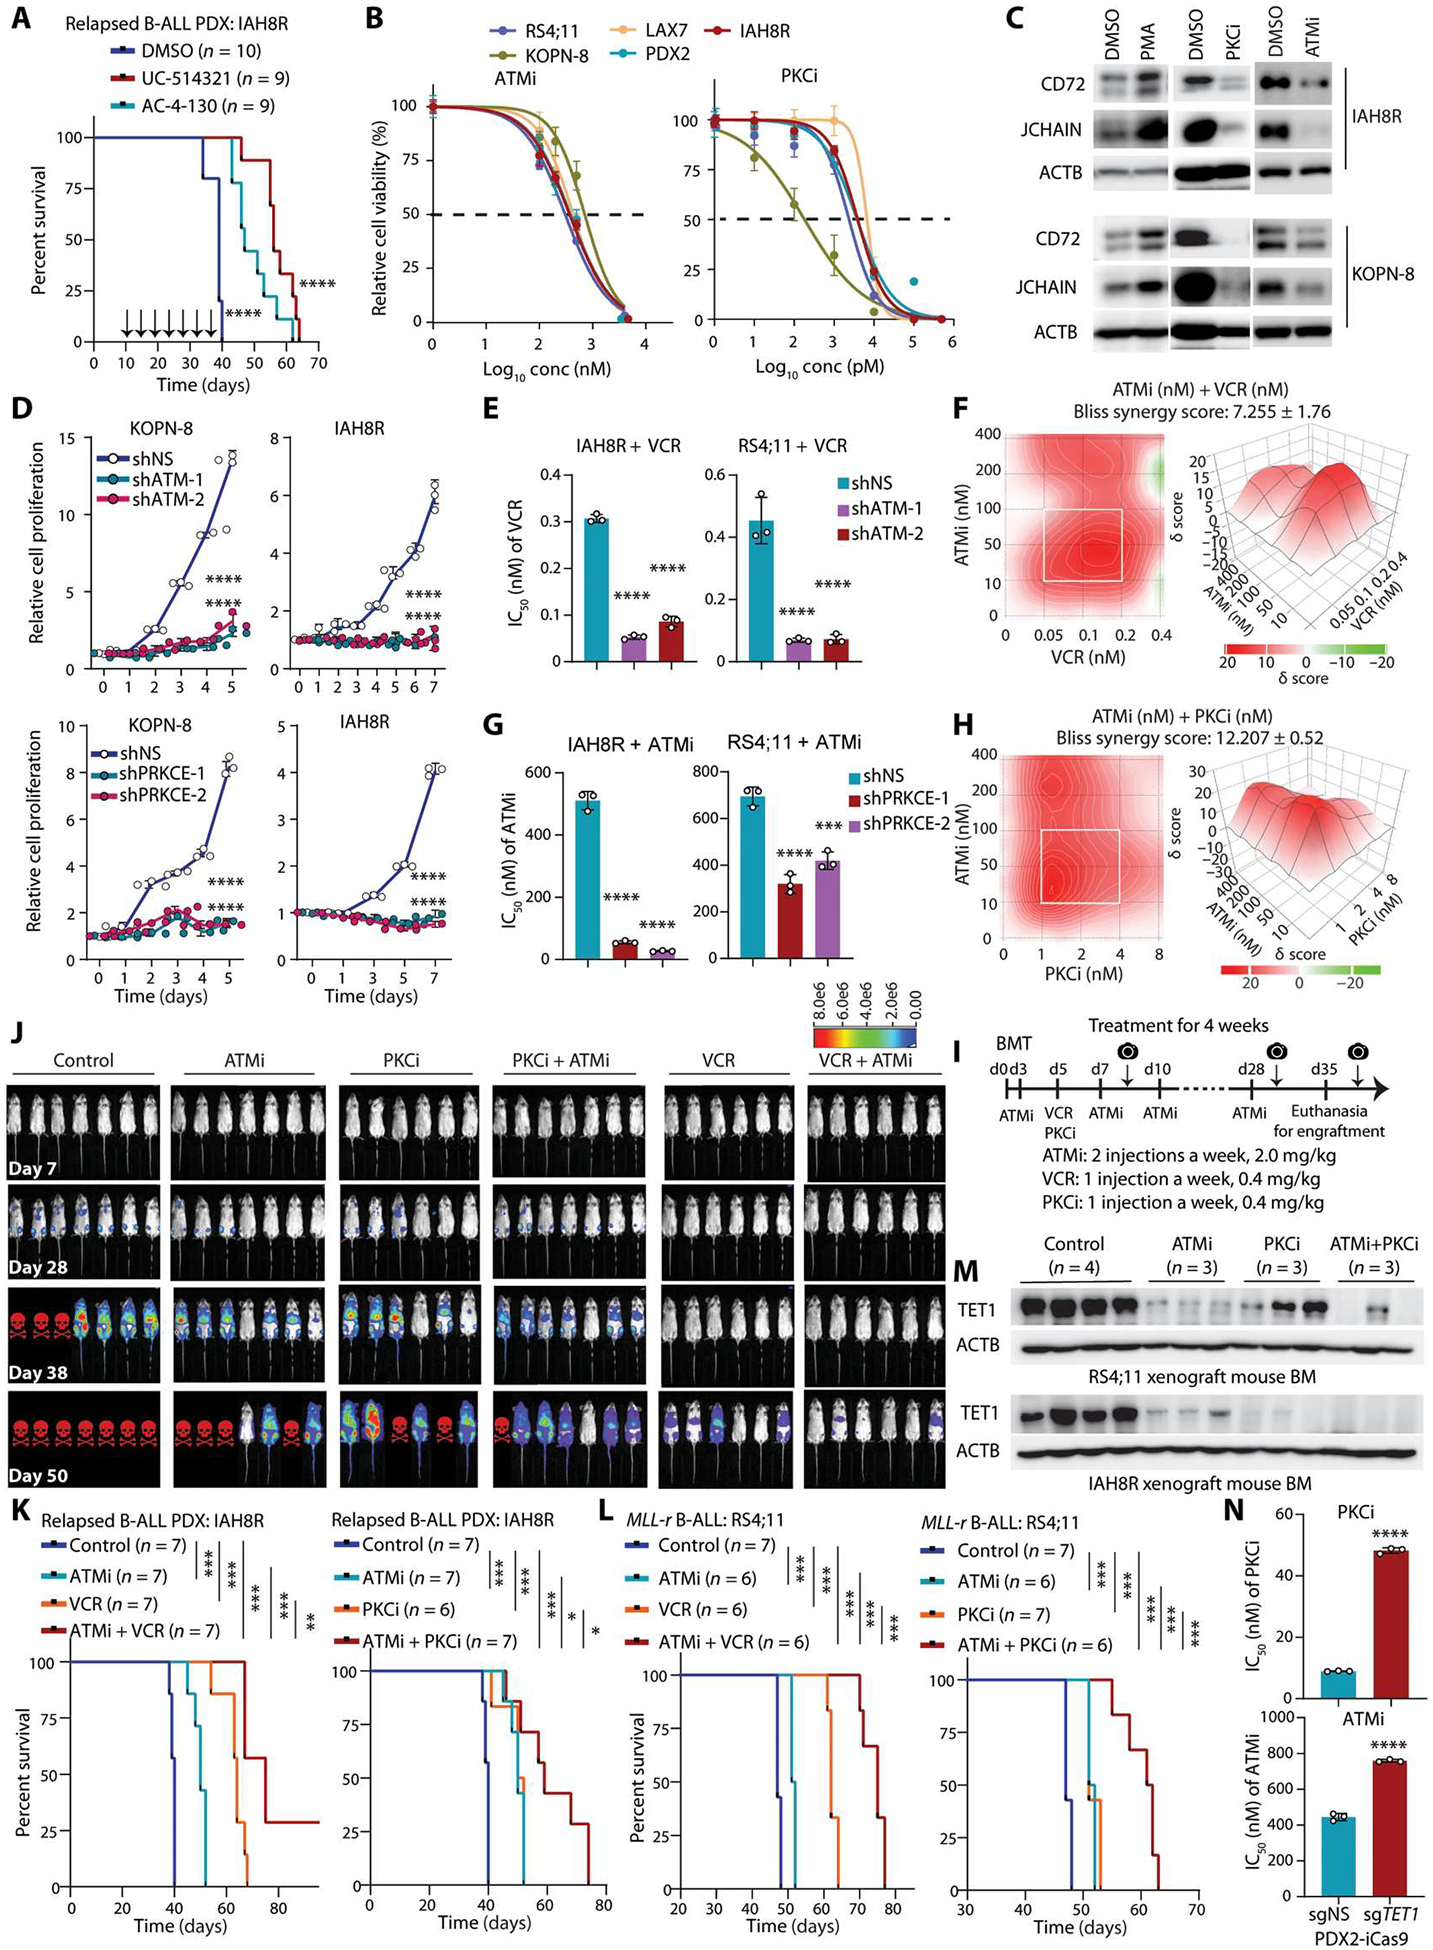
Although the overall survival rate of B cell acute lymphoblastic leukemia (B-ALL) in childhood is more than 80%, it is merely 30% in refractory/relapsed and adult patients with B-ALL. This demonstrates a need for improved therapy targeting this subgroup of B-ALL. Here, we show that the ten-eleven translocation 1 (TET1) protein, a dioxygenase involved in DNA demethylation, is overexpressed and plays a crucial oncogenic role independent of its catalytic activity in B-ALL. Consistent with its oncogenic role in B-ALL, overexpression of TET1 alone in normal precursor B cells is sufficient to transform the cells and cause B-ALL in mice within 3 to 4 months. We found that TET1 protein is stabilized and overexpressed because of its phosphorylation mediated by protein kinase C epsilon (PRKCE) and ATM serine/threonine kinase (ATM), which are also overexpressed in B-ALL. Mechanistically, TET1 recruits STAT5B to the promoters of CD72 and JCHAIN and promotes their transcription, which in turn promotes B-ALL development. Destabilization of TET1 protein by treatment with PKC or ATM inhibitors (staurosporine or AZD0156; both tested in clinical trials), or by pharmacological targeting of STAT5B, greatly decreases B-ALL cell viability and inhibits B-ALL progression in vitro and in vivo. The combination of AZD0156 with staurosporine or vincristine exhibits a synergistic effect on inhibition of refractory/relapsed B-ALL cell survival and leukemia progression in PDX models. Collectively, our study reveals an oncogenic role of the phosphorylated TET1 protein in B-ALL independent of its catalytic activity and highlights the therapeutic potential of targeting TET1 signaling for the treatment of refractory/relapsed B-ALL.


Conflict of interest statement

Competing interests: J. Chen is a scientific advisory board member of Race Oncology. The other authors declare that they have no competing interests.

Figures

Fig. 1.
Fig. 1.. TET1 promotes pre-B ALL development independent of its catalytic activity.
(A and B) Growth competition assays. BCR-ABL1–transduced (A) or NRASG12D-transduced (B) Tet1fl/fl pre-B cells were further transduced with Cre-ERT2-IRES-GFP vectors (Cre) or ERT2-IRES-GFP (EV). Percentages of GFP+ cells were measured by flow cytometry after 4-hydroxytamoxifen (4-OHT) treatment. (C to F) Colony-forming and replating assays (CFAs) and colony number quantification of BCR-ABL1–transduced (C and D) or NRASG12D-transduced (E and F) Tet1fl/fl pre-B cells (further transduced by EV or Cre) upon 4-OHT treatment. Colony count (mean ± SD) of the whole plate and representative images (scale bar, 50 μm) are shown. (G) Colony number quantification of serial CFAs of BCR-ABL1–transduced pre-B cells co-transduced with pCDH (empty vector), wild-type, or catalytically dead mutant murine Tet1-CD (Tet1-CD-WT or Tet1-CD-MUT). (H and I) Kaplan-Meier curves of immunocompromised NSG mice transplanted with BCR-ABL1–transformed (H) or NRASG12D-transformed (I) Tet1fl/fl pre-B cells transduced with either EV or Cre. Tamoxifen was intraperitoneally injected every other day for 5 days starting 10 days after transplantation. (J) Survival curves of immunocompetent C57BL/6 mice transplanted with BCR-ABL1–trans duced Tet1fl/fl Mx1-Cre pre-B cells coupled with poly I:C or PBS injection (intraperitoneally once every other day for five injections) 10 days after transplantation. (K) Survival curves of immunocompetent C57BL/6 mice transplanted with BCR-ABL1–transduced wild-type pre-B cells with or without overexpression of Tet1-CD-WT or Tet1-CD-MUT. (L) mCherry+ cell populations measured by flow cytometry at indicated time points after transduction with lentiviral shRNA vectors expressing mCherry (psi-LVRU6MH) in KOPN-8 cells (carrying MLL-ENL). shNS, non-silencing control. mCherry+ cell populations were measured every 2 days without any selection. (M and N) Cell growth/proliferation (M) and apoptosis (N) assays in B-ALL cells [KOPN-8 or ICN1 (PDX cells carrying BCR-ABL1)] after TET1 KD by shRNAs. (O) Western blotting showing the inducible effects of CRISPR-Cas9 protein in PDX2 (carrying BCR-ABL1)–inducible Cas9-ZsGreen (iCas9) cells after 3 days of induction with doxycycline (1 μg/m1; Dox, top). Validation of induced TET1 KO in PDX2-iCas9 cells after transfection of lentiviral sgRNAs targeting TET1 (bottom). (P) Growth competition assays of human PDX2 B-ALL cells with or without TET1 knockout (KO). ZsGreen+ PDX2-iCas9 cells were transduced with mCherry+ sgRNAs, and percentages of mCherry+ ZsGreen+ double-positive cells in ZsGreen+ cells were analyzed by flow cytometry. (Q) Cell growth/proliferation assays of control and TET1 KO PDX2 cells. (R) Kaplan-Meier curves of PDX2-iCas9 cell xenograft model. Except for survival analyses, other experimental data are representative of at least three independent experiments. Data are shown as means ± SD and assessed by two-tailed Student’s t test (D, F, and G) or two-way ANOVA (A, B, L, M, P, and Q). Log-rank tests were used for survival analyses (H to K and R). **P < 0.01, ***P < 0.001, and ****P < 0.0001. GAPDH, glyceraldehyde-3-phosphate dehydrogenase.
Fig. 2.
Fig. 2.. The TET1-S is highly expressed in B-ALL, and its overexpression is sufficient to transform pre-B cells.
(A) Schematic of full-length (TET1-FL), short isoform (TET1-S), and catalytic domain of TET1 (TET1-CD). (B) Western blots of the TET1-FL (black dash on the left) and TET1-S (red dash on the left) of TET1 in human embryonic stem cells (hESCs), B-ALL cells, and HEK-293T cells with overexpression of empty vector (pCDH), TET1-FL, or TET1-S. Nonspecific bands at 250 kDa are labeled with black stars. Vinculin (VCL) was used as a reference control. (C) Western blotting showing expression of TET1-FL and TET1-S in primary B-ALL patient samples, along with hESCs, peripheral blood mononuclear cells (PBMCs), and AML patient samples as controls. (D) IP with TET1 antibody in B-ALL cell lysate (RS4;11 and PDX2) followed by LC-MS/MS detection and analysis. In-gel protein sample used for LC-MS/MS was collected from the specific band (TET1-S) observed in SDS–polyacrylamide gel electrophoresis gel as shown in (B). (E and F) Western blots showing expression of full-length (black dash) and short isoform (red dash) of TET1 protein in healthy control, different subtypes of B-ALL, and other malignant blood cells [AML, mantle cell lymphoma (MCL), Burkitt lymphoma (BL), and diffuse large B cell lymphoma (DLBCL)]. (G) Representative photomicrographs of serial CFAs. BCR-ABL1–transformed pre-B cells were further transduced with empty vector (EV), Tet-S-WT, or Tet1-S-MUT. (H) Clonal cell number statistics of serial passages of CFAs of BCR-ABL1–transformed pre-B cells further transduced with pCDH, Tet1-S-WT, or Tet1-S-MUT. (I) Engraftment detection by flow cytometry for peripheral blood (PB) samples from C57BL/6 mice transplanted with BCR-ABL1–transformed pre-B cells with or without overexpression of Tet1-S-WT or Tet1-S-MUT at indicated time points. (J) Survival curves of immunocompetent C57BL/6 mice transplanted with BCR-ABL1–transduced wild-type pre-B cells with or without overexpression of Tet1-S-WT or Tet1-S-MUT. (K) Clonal cell number quantification of serial passages of CFAs of pre-B cells transduced with pCDH, Tet1-CD-WT, or Tet1-CD-MUT. (L) Representative photomicrographs of CFAs. Healthy pre-B cells were transduced with EV, Tet-S-WT, or Tet1-S-MUT. Scale bar, 50 μm. (M) Validation of B-ALL by flow cytometry with antibodies of CD45.2 (donor) and murine CD19 and B220. (N) Representative images of spleens from NSG mice transplanted with pre-B cells overexpressing EV, Tet1-S-WT, or Tet1-S-MUT. (O) Cell counts for white blood cells (WBC) and organ weight as a percentage of whole-body weight from leukemic mice at the end time point or from the control group of mice. (P) Representative photomicrographs of splenic tissues stained by hematoxylin and eosin (HE) and immunohistochemistry (IHC) staining for CD19 in mice transplanted by pre-B cells with overexpression of EV, Tet1-S-WT, or Tet1-S-MUT. Scale bar, 50 μm. (Q) Kaplan-Meier curves of NSG mice transplanted with pre-B cells transduced with EV, Tet1-S-WT, or Tet1-S-MUT for two generations of BMT. All experimental data are representative of at least three independent experiments. Data are shown as mean ± SD and assessed by two-tailed Student’s t test (H, I, K, and O). Log-rank test for (J) and (Q). *P < 0.05, **P < 0.01, ***P < 0.001, and ****P < 0.0001.
Fig. 3.
Fig. 3.. TET1 protein is phosphorylated and stabilized by ATM and PRKCE.
(A) Schematic diagram depicting the potential mechanisms regulating TET1 protein abundance. (B and C) RT-qPCR showing the relative mRNA expression of TET1-FL and TET1-S in B-ALL and AML patient samples (B) or PBMCs, AML, B-ALL, MCL, BL, and DLBCL cell lines (C). RT-qPCR primers were designed to amplify the specific region of TET1 isoforms. Values of 2−ΔCt normalized to ACTB are shown (B). mRNA expression in cell lines was normalized to PBMC-1. (D) TET1 protein stability after CHX treatment at indicated time points in healthy control cells (PBMCs), AML cells (MM-6), and B-ALL cells (PDX2). (E) Quantification of TET1-S protein half-life (T1/2) normalized to reference protein in healthy control cells, AML cells, and B-ALL cells. (F) Predicted and reported PTM sites on TET1 protein (672 to 2136 amino acids). (G to I) Western blots comparing abundance of indicated proteins between healthy controls and B-ALL cell lines or other types of malignant blood cells (G), patient samples (H), and diverse B-ALL subtypes (I). TET1-FL and TET1-S bands were annotated with black and red dashes, respectively (G). (J) Western blots showing expression of Atm, Prkce, and Tet1 in BCR-ABL1– or NRASG12D-transformed pre-B cells compared with healthy pre-B cells. (K and L) TET1 protein abundance [TET1-FL (black dash) and TET1-S (red dash)] after treatment with PKC activator (K) and inhibition of PKC or ATM (L) at gradient doses in B-ALL cells for 24 hours. (M and N) Reciprocal co-immunoprecipitation (co-IP) assays with antibody against ATM and flag-tagged PRKCE. IgG was loaded as negative control; X indicates lanes without loading samples. (O) Kinase assays by 32P-autoradiograph. Active PRKCE or ATM protein was incubated with purified wild-type TET1-N or TET1-CD, respectively. Recombinant p53 was loaded as a positive control. Western blots in parallel as the loading controls. (P) Determination of TET1 phosphorylation at T1164, S1971, and S1976 by 32P-autoradiograph. Western blots in parallel as the loading controls. All experimental data are representative of at least three independent experiments. Data are shown as mean ± SD (B and C). *P < 0.05, **P < 0.01, ***P < 0.001, and ****P < 0.0001. For (F), the detailed information of predicted posttranslational modifications of TET1 is listed in table S1.
Fig. 4.
Fig. 4.. TET1 drives B-ALL cell growth/survival by promoting transcription of B cell–specific oncogenic targets, such as CD72 and JCHAIN.
(A) Gene Ontology (GO) analysis of down-regulated genes upon TET1 KO in PDX2 cells, which are enriched in B cell pathways. Size of circle indicates gene number; color shows the adjusted P value. (B and C) Gene Set Enrichment Analysis (GSEA) plots of apoptosis (B) and genes up-regulated in B cells compared with monocytes (GSE29618) (C) using a preranked TET1-CD-WT/MUT–bound gene list weighted by expression fold change in TET1-depleted PDX2 compared with control PDX2 cells. (D) Volcano plot showing expression changes in TET1-CD WT/MUT–bound genes upon TET1 KO in PDX2 cells. Dots in red (down-regulation) and blue (up-regulation) represent significantly differentially expressed genes. (E) ChIP-qPCR showing the binding of both TET1-CD-WT and TET1-CD-MUT on CD72 and JCHAIN genomic loci in PDX2 cells. ChIP-qPCR of GAPDH as a negative control for TET1 ChIP. (F and G) Changes in CD72 and JCHAIN mRNA expression (F) or protein (G) abundance upon TET1 KO or knockdown (KD) in B-ALL cells (PDX2, KOPN-8, and IAH8R). (H) CD72 cell surface expression tested by flow cytometry after CD72 KD in B-ALL cells. (I) Protein abundance changes in CD72 or JCHAIN after shRNA KD. (J) Cell growth/proliferation assays after KD of CD72 or JCHAIN in B-ALL cells. (K) Kaplan-Meier analysis (log-rank test) of NSG mice xenotransplanted with human KOPN-8 B-ALL cells with or without KD of CD72 or JCHAIN. (L) Cell population analysis of mCherry+ versus GFP+ in TET1 KD (shRNA vectors carrying mCherry) KOPN-8 cells after overexpression of CD72-GFP, JCHAIN-GFP, or pCDH-GFP in vitro. (M) Cell growth/proliferation assays of control and TET1 KD KOPN-8 cells with or without overexpression of CD72 or JCHAIN. (N) Kaplan-Meier curves (log-rank test) of KOPN-8–xenotransplanted NSG mice showing the effects of CD72 or JCHAIN overexpression on rescuing TET1 KD–induced inhibition on B-ALL progression. All experimental data are representative of at least three independent experiments. Data are shown as mean ± SD and assessed by two-tailed Student’s t test (E and F) or two-way ANOVA (J, L, and M). *P < 0.05, **P < 0.01, ***P < 0.001, ****P < 0.0001, and ns, not significant.
Fig. 5.
Fig. 5.. TET1 regulates transcription of downstream target genes by recruiting STAT5B in B-ALL cells.
(A) Venn diagram showing candidate proteins that likely interact with TET1, as detected by IP-MS, in PDX2 cells. Negative control IP was conducted with anti-flag antibody in cells without flag-tagged TET1-CD or with control IgG antibody in cells with flag-tagged TET1-CD. (B) Reciprocal co-IP assays examining interaction between TET1-CD (WT and MUT) and STAT5B. (C) Western blotting showing co-IP of TET1 and STAT5B. Reciprocal co-IP assays were conducted using antibodies that recognize the endogenous proteins in PDX2 cells. (D) Genome-wide Spearman’s correlation analysis of the fold change in ChIP-seq signals (IP versus input) between TET1-CD-WT, TET1-CD-MUT, and STAT5B. The P values represent Spearman’s rank correlation coefficients. (E) Distribution and density of the STAT5B ChIP-seq tags around the TET1-bound peaks in PDX2 cells. (F) Scatterplot showing the fold enrichment of STAT5B on the promoter regions of the responsive target genes involved in B cell pathways (see Fig. 4C and extended data fig. 6G) in control and TET1 KO PDX2 cells. The fold enrichment was calculated as IP/input of ChIP-seq counts. (G) Distribution of the fold change in ChIP-seq signals (IP versus input) of TET1 and STAT5B around the promoter regions of CD72 and JCHAIN in PDX2 cells. (H) ChIP-qPCR of STAT5B binding at the promoter region of CD72 and JCHAIN in PDX2 (sgNS and sgTET1) cells. (I) RT-qPCR showing the relative expression of STAT5B, CD72, and JCHAIN upon KD of STAT5B by lentiviral shRNAs in B-ALL cells. (J) Working model of TET1 and STAT5B in the regulation of target gene transcription. All experimental data are representative of at least three independent experiments. Data are shown as mean ± SD and assessed by two-tailed Student’s t test (H and I) or two-sample Kolmogorov-Smirnov test (E). **P < 0.01, ***P < 0.001, ****P < 0.0001, and ns, not significant. For (A), the complete list of proteins identified is shown in table S2.
Fig. 6.
Fig. 6.. Therapeutic potential of targeting TET1 signaling to treat B-ALL.
(A) Kaplan-Meier analysis of relapsed B-ALL PDX xenotransplanted NSG mice treated with dimethyl sulfoxide (DMSO), AC-4-130, or UC-514321. Injections were three times a week starting 10 days after transplantation. (B) IC50 of ATM inhibitor (ATMi, AZD0156) or PRKCE inhibitor (PKCi, staurosporine) on inhibition of B-ALL cell survival/growth 72 hours after treatment. (C) Western blots showing the relative changes of abundance of CD72 and JCHAIN after treatment with PMA, ATMi, or PKCi in B-ALL cells. (D) Cell growth/proliferation assays after KD of ATM or PRKCE in B-ALL cells. (E) Changes in IC50 of VCR B-ALL cell line and PDX cells upon ATM KD. (F) Synergistic effects of ATMi + VCR on inhibition of the survival/growth of relapsed B-ALL PDX cells (IAH8R), as determined by the Bliss independence model. Drug combinations with the strongest synergistic effects are outlined with white squares. δ scores represent the percentage of response beyond expectation due to drug interactions. (G) Changes in IC50 of ATMi in B-ALL cell line and PDX cells upon PRKCE KD. (H) Synergistic effects of ATMi + PKCi on inhibition of the survival/growth of relapsed B-ALL PDX cells (IAH8R), as determined by the Bliss independence model. (I) Drug treatment strategy for relapsed PDX and refractory B-ALL models. Camera symbols represent bioluminescence imaging. (J) In vivo bioluminescence imaging of xenotransplanted NSG mice with B-ALL relapse PDX cells (IAH8R) treated with ATMi, PKCi, or VCR alone or in combination. Red skull symbols indicate that those mice were euthanized because of developing B-ALL. (K and L) Kaplan-Meier analysis of relapsed B-ALL PDX (K) or refractory MLL-r B-ALL (L) xenotransplanted NSG mouse models treated intraperitoneally with different drug combinations. The same control and ATMi groups were used in the left and right panels. (M) Western blots showing relative abundance of TET1 in BM samples from the mice carrying IAH8R or RS4;11-induced ALL with or without treatment with the indicated inhibitors. (N) Changes in IC50 values from ATMi or PKCi treatment of PDX2-iCas9 cells upon KO of TET1. Log-rank test was used for the survival curve analyses (A, K, and L). Data are shown as mean ± SD and were assessed by two-tailed Student’s t test (E, G, and N) or two-way ANOVA (D). *P < 0.05, **P < 0.01, ***P < 0.001, and ****P < 0.0001. Images are representative of three independent experiments (B to H and N).

References

    1. Siegel R, Naishadham D, Jemal A, Cancer statistics, 2013. CA Cancer J. Clin 63, 11–30 (2013). - PubMed
    1. Terwilliger T, Abdul-Hay M, Acute lymphoblastic leukemia: A comprehensive review and 2017 update. Blood Cancer J. 7, e577 (2017). - PMC - PubMed
    1. Pui CH, Robison LL, Look AT, Acute lymphoblastic leukaemia. Lancet 371, 1030–1043 (2008). - PubMed
    1. Cooper SL, Brown PA, Treatment of pediatric acute lymphoblastic leukemia. Pediatr. Clin. North Am 62, 61–73 (2015). - PMC - PubMed
    1. Kuhlen M, Klusmann JH, Hoell JI, Molecular approaches to treating pediatric leukemias. Front. Pediatr 7, 368 (2019). - PMC - PubMed

Publication types