. 2023 Jun:62:102677.
doi: 10.1016/j.redox.2023.102677. Epub 2023 Mar 17.

Tubastatin A potently inhibits GPX4 activity to potentiate cancer radiotherapy through boosting ferroptosis

Affiliations

Tubastatin A potently inhibits GPX4 activity to potentiate cancer radiotherapy through boosting ferroptosis

Shan Liu et al. Redox Biol. 2023 Jun.

Abstract

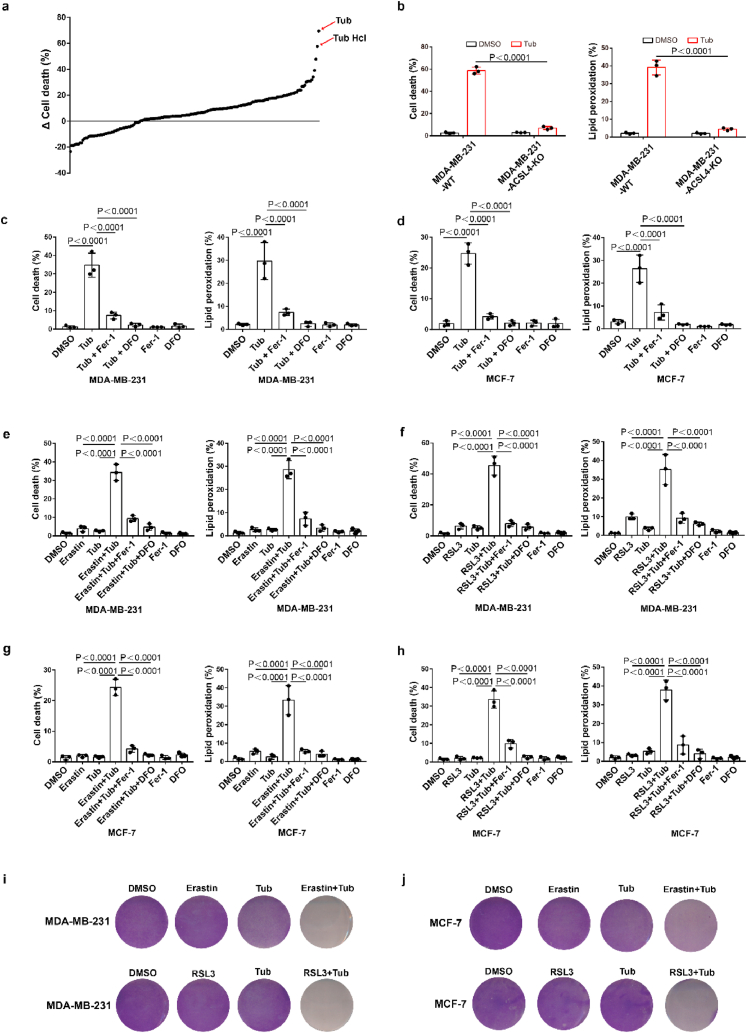
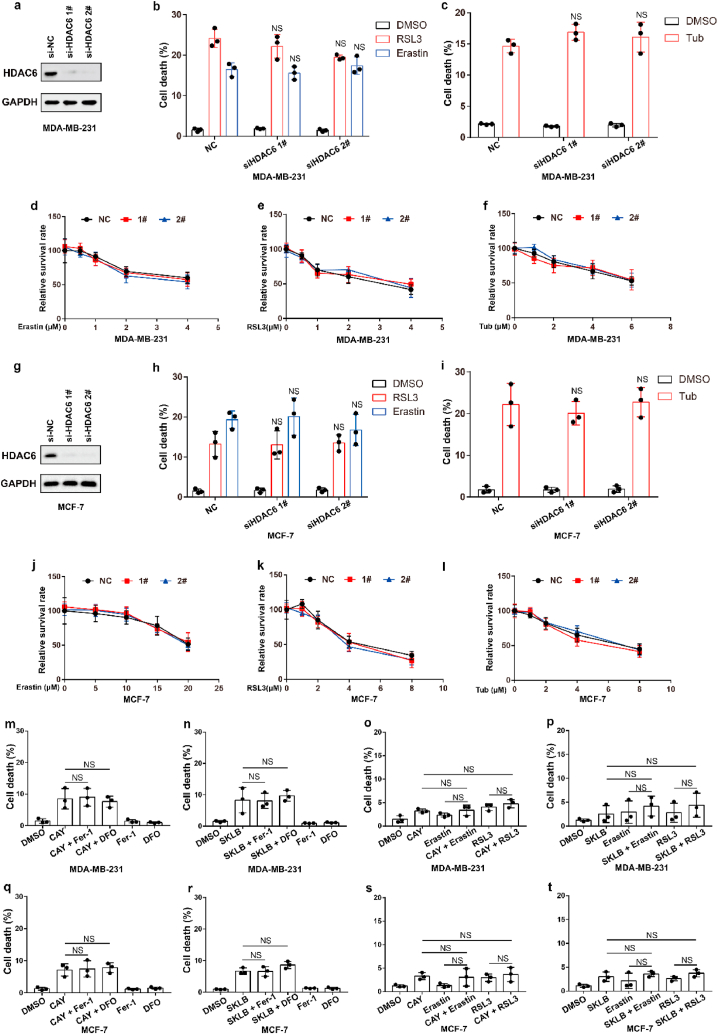
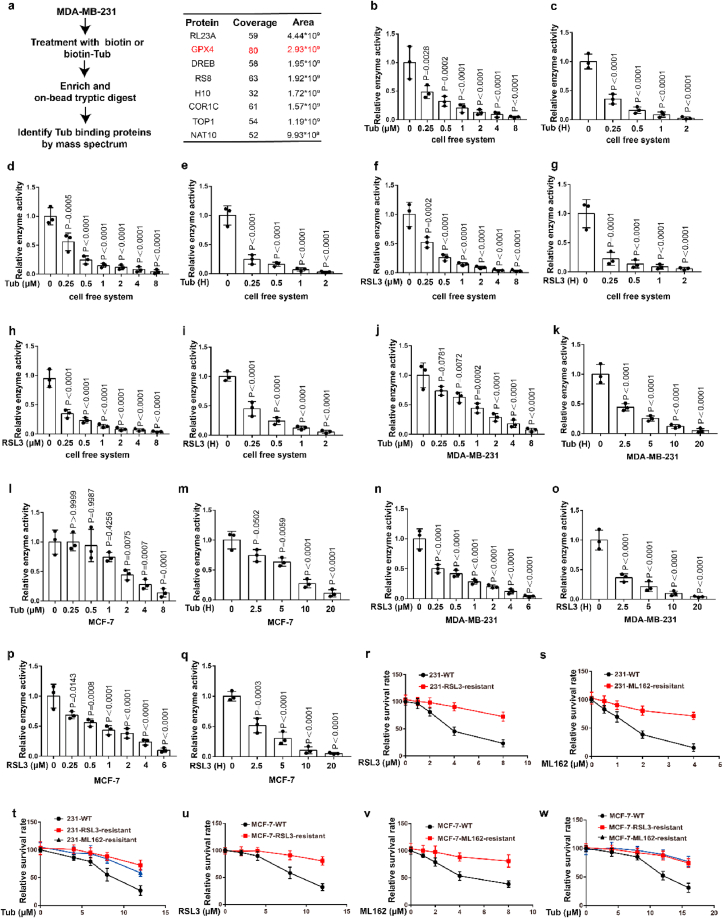
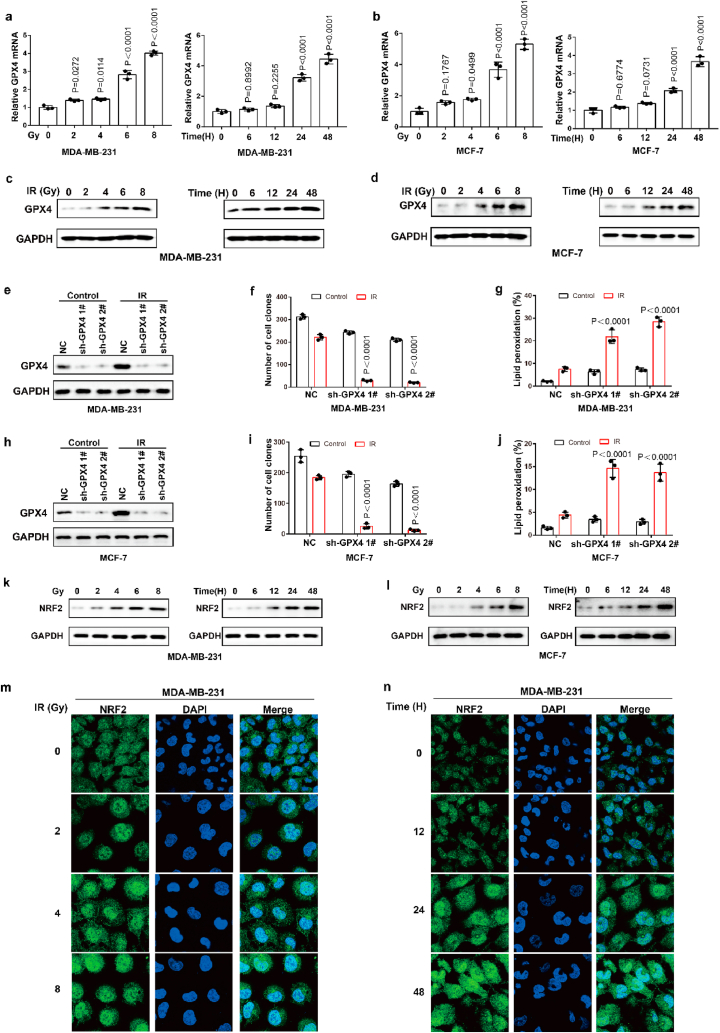
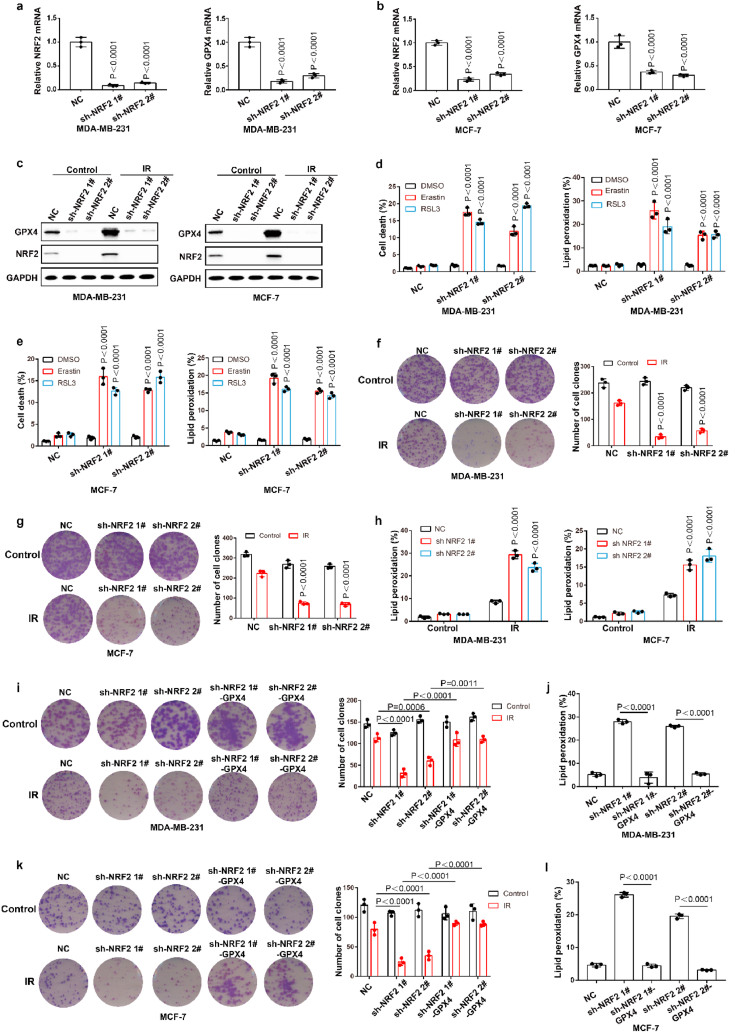
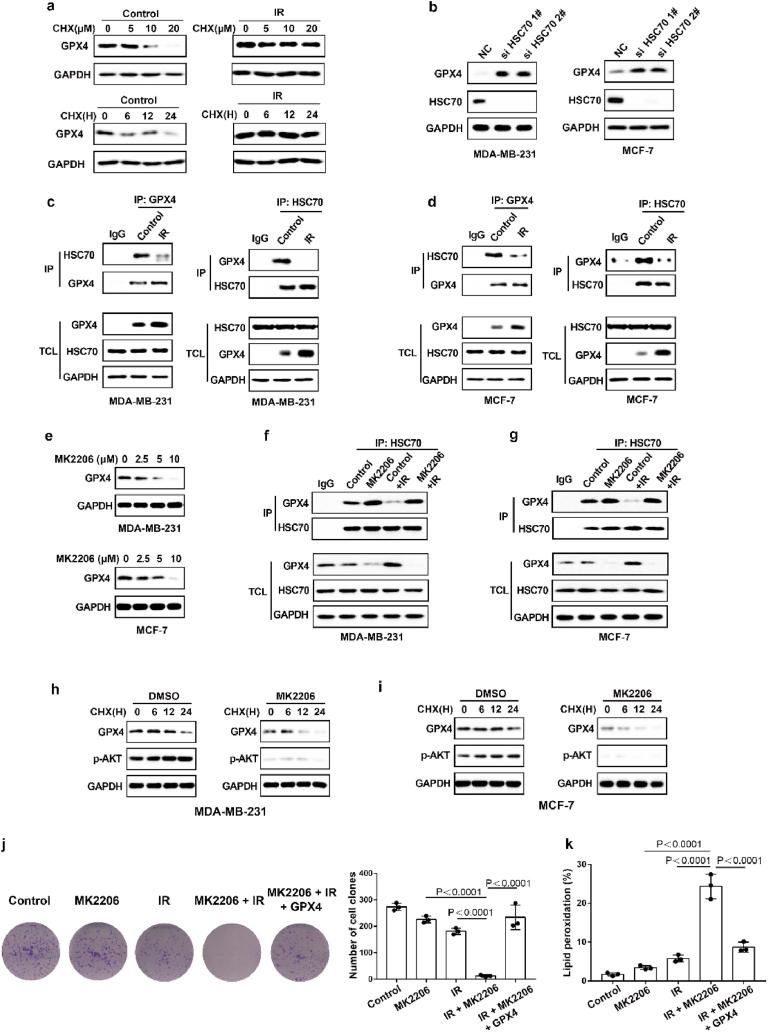
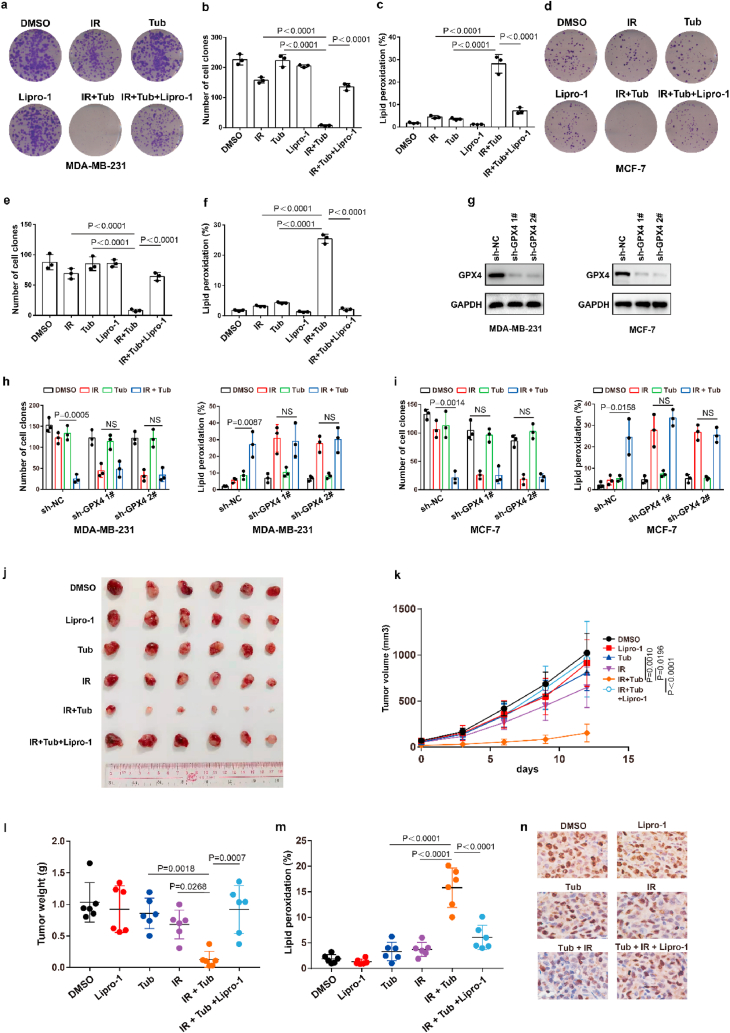
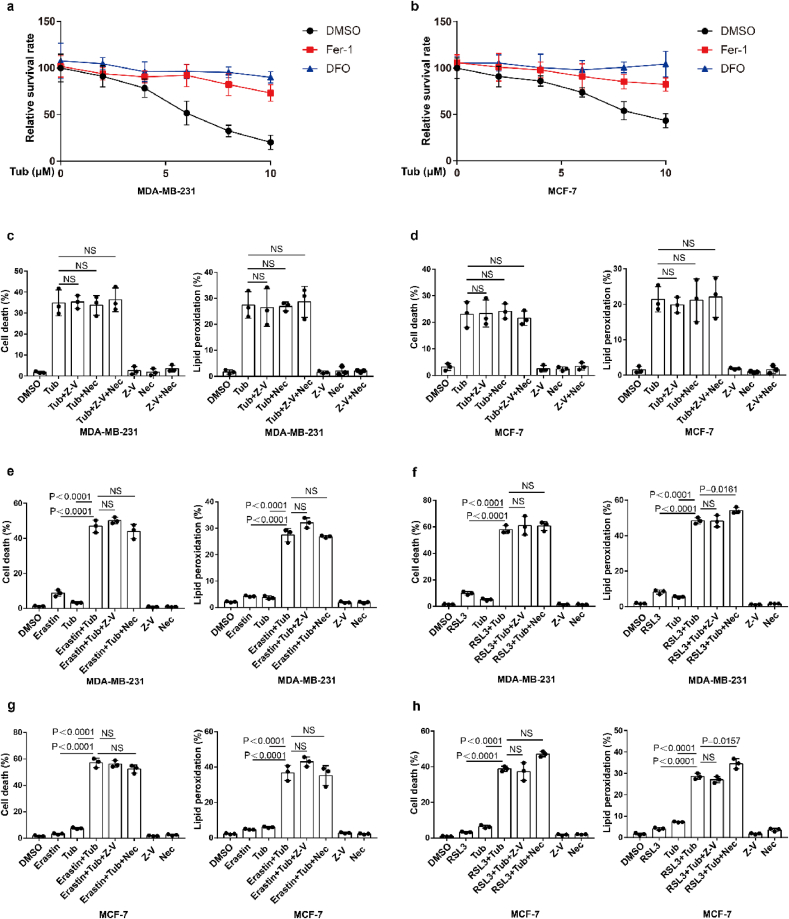
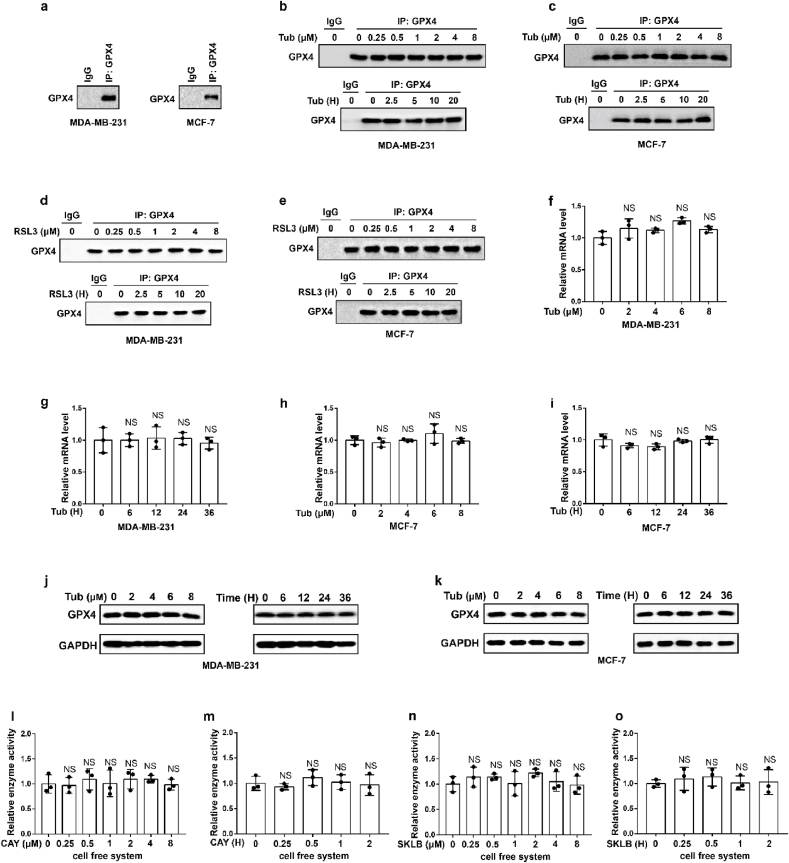
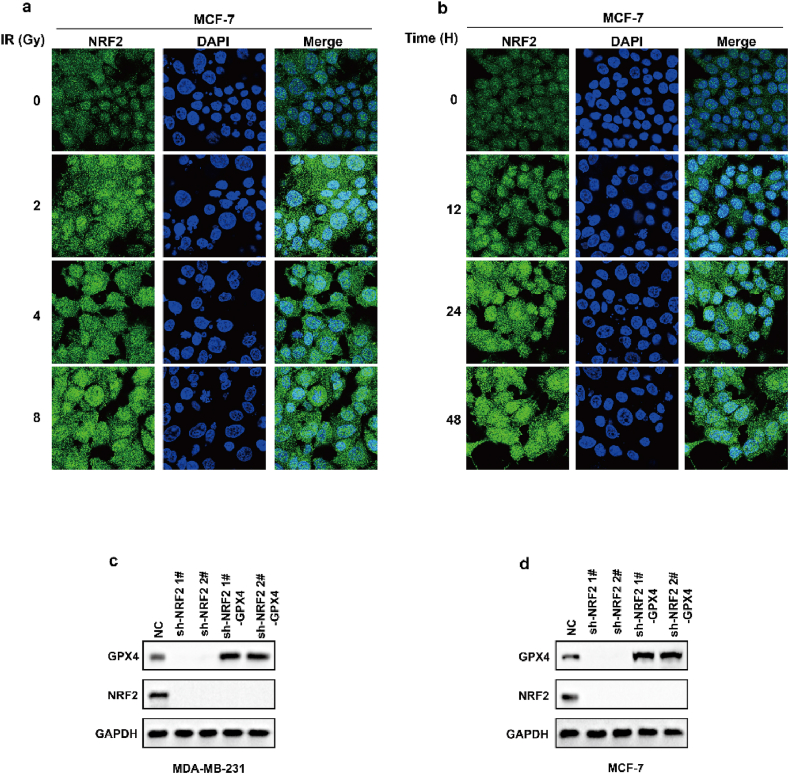
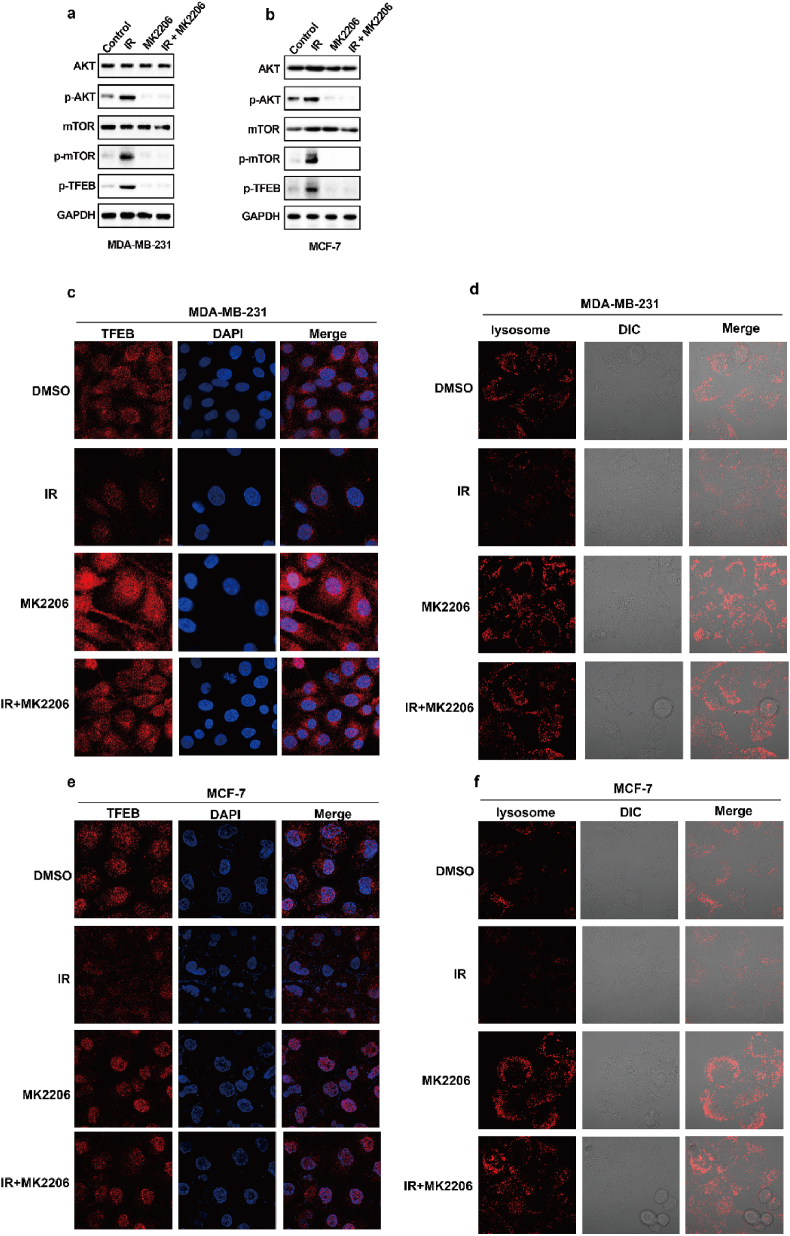
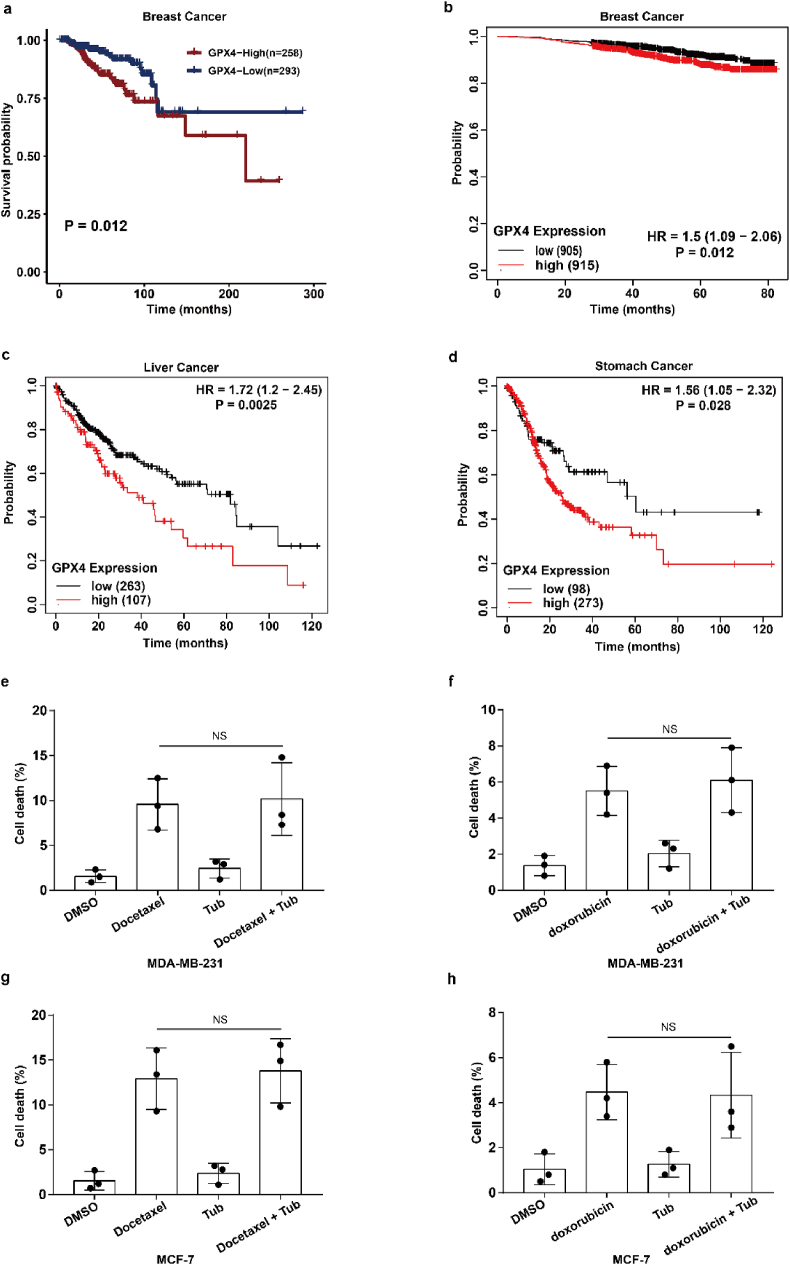
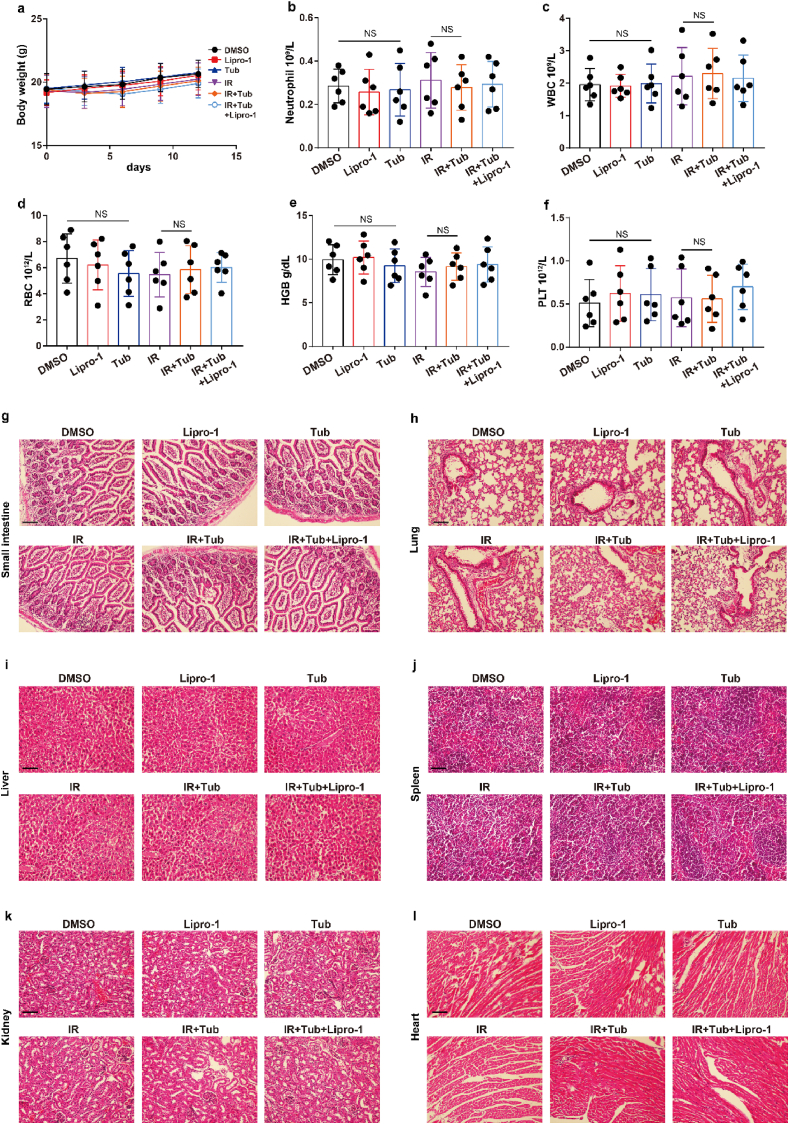
Ferroptosis, an iron-dependent lipid peroxidation-driven programmed cell death, is closely related to cancer therapy. The development of druggable ferroptosis inducers and their rational application in cancer therapy are critical. Here, we identified Tubastatin A, an HDAC6 inhibitor as a novel druggable ferroptosis inducer through large-scale drug screening. Tubastatin A directly bonded to GPX4 and inhibited GPX4 enzymatic activity through biotin-linked Tubastatin A putdown and LC/MS analysis, which is independent of its inhibition of HDAC6. In addition, our results showed that radiotherapy not only activated Nrf2-mediated GPX4 transcription but also inhibited lysosome-mediated GPX4 degradation, subsequently inducing ferroptosis tolerance and radioresistance in cancer cells. Tubastatin A overcame ferroptosis resistance and radioresistance of cancer cells by inhibiting GPX4 enzymatic activity. More importantly, Tubastatin A has excellent bioavailability, as demonstrated by its ability to significantly promote radiotherapy-induced lipid peroxidation and tumour suppression in a mouse xenograft model. Our findings identify a novel druggable ferroptosis inducer, Tubastatin A, which enhances radiotherapy-mediated antitumor effects. This work provides a compelling rationale for the clinical evaluation of Tubastatin A, especially in combination with radiotherapy.


Conflict of interest statement

Declaration of competing interest The authors declare that they have no known competing financial interests or personal relationships that could have appeared to influence the work reported in this paper.

Figures

Fig. 1
Fig. 1
Tubastatin A is a novel ferroptosis inducer. (a) MDA-MB-231-ACSL4-WT and MDA-MB-231-ACSL4-KO cells were seeded in 96-well plates overnight. Following treatment with different inhibitor, cell death was detected by MTT assay. Δ Cell death means the death rate of MDA-MB-231-ACSL4-WT cells minus the death rate of MDA-MB-231-ACSL4-KO cells. (b) Cell death and lipid peroxidation measurement in the indicated cells treated with DMSO or Tubastatin A (Tub) for 20 h. Tub, 8 μM Tubastatin. (cd) Cell death and lipid peroxidation measurement in the indicated cells treated with the indicated compounds for 20 h (c) or 28 h (d). MDA-MB-231, Tub, 8 μM; DFO, the ferroptosis inhibitor Deferoxamine mesylate, 10 μM; Fer-1, the ferroptosis inhibitor Ferrostatin-1, 10 μM. MCF-7, Tub, 10 μM; DFO, 10 μM; Fer-1, 10 μM. (e, f) Cell death and lipid peroxidation measurement in MDA-MB-231 cells treated with the indicated compounds for 20 h. Tub, 4 μM; Erastin, 2.5 μM; RLS3, 2.5 μM; DFO, 10 μM; Fer-1, 10 μM. (g, h) Cell death and lipid peroxidation measurement in MCF-7 cells treated with the indicated compounds for 28 h. Tub, 5 μM; Erastin, 5 μM; RLS3, 2.5 μM; DFO, 10 μM; Fer-1, 10 μM. (i, j) Cell viability measurement in MDA-MB-231 or MCF-7 cells treated with the indicated compounds for 24 h or 32 h, respectively. For MDA-MB-231, Tub, 4 μM; Erastin, 2.5 μM; RLS3, 2.5 μM. For MCF-7, Tub, 5 μM; Erastin, 5 μM; RLS3, 2.5 μM. b-h, Data are the mean ± s.d.; n = 3 biologically independent experiments. Statistical analysis was performed using an unpaired two-tailed Student's t-test.
Fig. 2
Fig. 2
Tubastatin A induces ferroptosis independent of HDAC6. (a, g) An immunoblot showing the expression of HDAC6 in MDA-MB-231 (a) and MCF-7 (g) cells subjected to the indicated treatments. Data are representative of n = 3 biologically independent experiments. (b) Cell death measurement in the indicated MDA-MB-231 cells treated with DMSO or 6 μM Erastin or 5 μM RSL3 for 20 h. (c) Cell death measurement in the indicated MDA-MB-231 cells treated with DMSO or 8 μM Tub for 20 h. (df) Cell viability measurements in MDA-MB-231-NC or HDAC6 knocked-down MDA-MB-231 cells subjected to the indicated treatments for 36 h. (h) Cell death measurement in the indicated MCF-7 cells treated with DMSO or 25 μM Erastin or 8 μM RSL3 for 20 h. (i) Cell death measurement in the indicated MCF-7 cells treated with DMSO or 10 μM Tub for 20 h. (jl) Cell viability measurements in MCF-7-NC or HDAC6 knocked-down MCF-7 cells subjected to the indicated treatments for 36 h. (m, n) Cell death measurement in MDA-MB-231 cells treated with the indicated compounds for 20 h. CAY, 8 μM CAY10603; SKLB, 8 μM SKLB-23bb. (o, p) Cell death measurement in MDA-MB-231 cells treated with the indicated compounds for 24 h. CAY, 4 μM CAY10603; Erastin, 2.5 μM; RLS3, 2.5 μM; SKLB, 4 μM SKLB-23bb. (q, r) Cell death measurement in MCF-7 cells treated with the indicated compounds for 28 h. CAY, 10 μM CAY10603; SKLB, 10 μM SKLB-23bb. (s, t) Cell death measurement in MCF-7 cells treated with the indicated compounds for 32 h. CAY, 5 μM CAY10603; Erastin, 5 μM; RLS3, 2.5 μM; SKLB, 5 μM SKLB-23bb. b, c, h, i, m-t, Data are the mean ± s.d.; n = 3 biologically independent experiments. Statistical analysis was performed using an unpaired two-tailed Student's t-test. d-f, j-l, Error bars are mean ± s.d., n = 3 independent repeats. Statistical analysis was performed using a two-way ANOVA analysis.
Fig. 3
Fig. 3
Tubastatin A induces ferroptosis by directly inhibiting the enzymatic activity of GPX4. (a) (left) Schematic of biotin-streptavidin pulldown method: MDA-MB-231 cells were treated with biotin or biotin-linked Tub, and Tub-binding proteins were enriched on streptavidin beads, subjected to an on-bead trypsin digestion and subsequent LC/LC–MS/MS analysis. (right) Enrichment of proteins based on coverage and area. GPX4 was a top target candidate. (bi) Relative GPX4 enzyme activity measurement in the indicated test tube treated with Tub or RSL3 for the indicated concentration and time in cell free system. b, c, f, g, we used co-immunoprecipitation to isolate endogenous GPX4 from MDA-MB-231 cells. d, e, h, i, we used co-immunoprecipitation to isolate endogenous GPX4 from MCF-7 cells. b, time: 2 h c, concentration: 8 μM. d, time: 2 h e, concentration: 8 μM. f, time: 2 h g, concentration: 8 μM. h, time: 2 h i, concentration: 8 μM. (jq) Relative GPX4 enzyme activity measurement in the indicated cell treated with Tub or RSL3 for the indicated concentration and time. j, time: 20 h k, concentration: 8 μM. l, time: 20 h m, concentration: 8 μM. n, time: 20 h o, concentration: 6 μM. p, time: 20 h q, concentration: 6 μM. (rw) Cell viability measurements in the indicated cells subjected to the indicated treatments for 28 h (rt) or 36 h (uw). b-q, Data are the mean ± s.d.; n = 3 biologically independent experiments. Statistical analysis was performed using an unpaired two-tailed Student's t-test. r-w, Error bars are mean ± s.d., n = 3 independent repeats. Statistical analysis was performed using a two-way ANOVA analysis.
Fig. 4
Fig. 4
IR enhances GPX4 expression by increasing the transcription of GPX4. (a–b) The relative GPX4 mRNA measurement in MDA-MB-231 cells (a) or MCF-7 (b) treated with IR at the indicated intensities and times. Data are the mean ± s.d.; n = 3 biologically independent experiments. Statistical analysis was performed using an unpaired two-tailed Student's t-test. (cd) An immunoblot showing the expression of GPX4 in MDA-MB-231 cells (c) or MCF-7 (d) treated with IR at the indicated intensities and times. Data are representative of n = 3 biologically independent experiments. (e, h) An immunoblot showing the expression of GPX4 in MDA-MB-231 (e) and MCF-7 (h) cells subjected to the indicated treatments. Data are representative of n = 3 biologically independent experiments. (f, g) Cell clone measurement (f) or lipid peroxidation measurement (g) in control or GPX4 knocked-down MDA-MB-231 cells subjected to the indicated treatments. For cell clone, 2 Gy IR; for lipid peroxidation measurement, 6 Gy IR. Data are the mean ± s.d.; n = 3 biologically independent experiments. Statistical analysis was performed using an unpaired two-tailed Student's t-test. (f, g) Cell clone measurement (f) or lipid peroxidation measurement (g) in control or GPX4 knocked-down MDA-MB-231 cells subjected to the indicated treatments. For cell clone, 2 Gy IR; for lipid peroxidation measurement, 6 Gy IR. Data are the mean ± s.d.; n = 3 biologically independent experiments. Statistical analysis was performed using an unpaired two-tailed Student's t-test. (i, j) Cell clone measurement (i) or lipid peroxidation measurement (j) in control or GPX4 knocked-down MCF-7 cells subjected to the indicated treatments. For cell clone, 2 Gy IR; for lipid peroxidation measurement, 6 Gy IR. Data are the mean ± s.d.; n = 3 biologically independent experiments. Statistical analysis was performed using an unpaired two-tailed Student's t-test. (k, l) An immunoblot showing the expression of NRF2 in MDA-MB-231 cells (k) or MCF-7 (l) treated with IR at the indicated intensities and times. Data are representative of n = 3 biologically independent experiments. (m, n) MDA-MB-231 cells treated with IR at the indicated intensities and times, then confocal microscopy of the cells was performed after staining with Nrf2 (green). (For interpretation of the references to colour in this figure legend, the reader is referred to the Web version of this article.)
Fig. 5
Fig. 5
Nrf2 contributed to enhanced GPX4 expression and subsequently ferroptosis resistance and radioresistance in cancer cells. (a–b) The relative Nrf2 and GPX4 mRNA measurement in MDA-MB-231 cells (a) or MCF-7 cells (b) stable transfected with negative control (NC) or Nrf2 shRNA. (c) An immunoblot showing the expression of GPX4 and Nrf2 in MDA-MB-231 cells (left) or MCF-7 (right) stable transfected with negative control (NC) or Nrf2 shRNA. Data are representative of n = 3 biologically independent experiments. (de) Cell death and lipid peroxidation measurement in the indicated MDA-MB-231 cells (d) or MCF-7 cells (e) treated with the indicated compounds for 16 h (d) or 24 h (e). (d) Erastin, 8 μM; RLS3, 5 μM. (e) Erastin, 10 μM; RLS3, 7.5 μM. (f, g) Cell clone measurement in the indicated MDA-MB-231 cells (f) or MCF-7 cells (g) treated with the 2 Gy IR. (h) Lipid peroxidation measurement in the indicated MDA-MB-231 cells (left) or MCF-7 cells (right) treated with the 6 Gy IR. (i, k) Cell clone measurement in the indicated MDA-MB-231 cells (i) or MCF-7 cells (k) treated with the 2 Gy IR. (j, l) Lipid peroxidation measurement in the indicated MDA-MB-231 cells (j) or MCF-7 cells (l) treated with the 6 Gy IR. a-b, d-l, Data are the mean ± s.d.; n = 3 biologically independent experiments. Statistical analysis was performed using an unpaired two-tailed Student's t-test.
Fig. 6
Fig. 6
IR enhances GPX4 expression by increasing the protein stability of GPX4. (a) An immunoblot showing the expression of GPX4 in MDA-MB-231 cells treatment with control or IR with or without CHX. Data are representative of n = 3 biologically independent experiments. (b) An immunoblot showing the expression of GPX4 and Hsc70 in MDA-MB-231 cells (left) or MCF-7 (right) transfected with negative control (NC) or Hsc70 siRNA. Data are representative of n = 3 biologically independent experiments. (c) Endogenous GPX4 (left) or Hsc70 (right) was immunoprecipitated from MDA-MB-231 cells subjected to the indicated treatments for 16 h, followed by immunoblotting using an antibody to GPX4 and Hsc70. IR, 4 Gy. Data are representative of n = 3 biologically independent experiments. (d) Endogenous GPX4 (left) or Hsc70 (right) was immunoprecipitated from MCF-7 cells subjected to the indicated treatments for 16 h, followed by immunoblotting using an antibody to GPX4 and Hsc70. IR, 6 Gy. Data are representative of n = 3 biologically independent experiments. (e) An immunoblot showing the expression of GPX4 in IR-treated MDA-MB-231 cells (top) or MCF-7 cells (bottom) treatment with MK2206 at the indicated concentration and time. Data are representative of n = 3 biologically independent experiments. (f, g) Endogenous Hsc70 was immunoprecipitated from MDA-MB-231 cells (f) or MCF-7 cells (g) subjected to the indicated treatments for 12 h, followed by immunoblotting using an antibody to GPX4 and Hsc70. (f) IR, 4 Gy; MK2206 2.5 μM. (g) IR, 6 Gy; MK2206 2.5 μM. Data are representative of n = 3 biologically independent experiments. (h, i) An immunoblot showing the expression of GPX4 in MDA-MB-231 cells (h) or MCF-7 cells (i) treatment with DMSO or MK2206 with or without CHX. Data are representative of n = 3 biologically independent experiments. (j) Cell clone measurement in the indicated MDA-MB-231 cells treated with the 2 Gy IR with or without 2.5 μM MK2206. (k) Lipid peroxidation measurement in the indicated MDA-MB-231 cells treated with the 6 Gy IR with or without 2.5 μM MK2206. j, k, Data are the mean ± s.d.; n = 3 biologically independent experiments. Statistical analysis was performed using an unpaired two-tailed Student's t-test.
Fig. 7
Fig. 7
Tubastatin A enhances radiosensitivity of cancer cells by boosting ferroptosis. (a–f) Cell clones and lipid peroxidation measurement in MDA-MB-231 cells (ac) or MCF-7 (df) treated with the indicated compounds or IR. (ac) Cell clones: IR, 2 Gy; lipro-1, 5 μM; Tub, 4 μM. Lipid peroxidation: IR, 6 Gy; lipro-1, 5 μM; Tub, 5 μM. (df) Cell clones: IR, 2 Gy; lipro-1, 5 μM; Tub, 5 μM. Lipid peroxidation: IR, 6 Gy; lipro-1, 5 μM; Tub, 7.5 μM. b, c, e, f, Data are the mean ± s.d.; n = 3 biologically independent experiments. Statistical analysis was performed using an unpaired two-tailed Student's t-test. (g) An immunoblot showing the expression of GPX4 in MDA-MB-231 (left) or MCF-7 (right) cells stable transfected with negative control (NC) or GPX4 shRNA. Data are representative of n = 3 biologically independent experiments. (h, i) The number of cell clones (h) and lipid peroxidation (i) in the indicated cancer cells were treated with the indicated compounds. MDA-MB-231, cell clones: IR, 2 Gy; Tub, 4 μM. Lipid peroxidation: IR, 6 Gy; Tub, 5 μM. MCF-7, cell clones: IR, 2 Gy; Tub, 5 μM. Lipid peroxidation: IR, 6 Gy; Tub, 7.5 μM. Data are the mean ± s.d.; n = 3 biologically independent experiments. Statistical analysis was performed using an unpaired two-tailed Student's t-test. (j, k) Tumour volumes of MDA-MB-231 xenograft tumours with the indicated treatments after exposure to 10 Gy of IR. Error bars are means ± SD, n = 6 independent repeats. P values were determined using two-way ANOVA. (l) Weights of MDA-MB-231 xenograft tumours with the indicated treatments at different time points (days) after exposure to 10 Gy of IR. Error bars are means ± SD, n = 6 independent repeats. P values were calculated using two-tailed unpaired Student’s t-test. (m) Relative lipid peroxidation in tumour cells isolated from the indicated tumours. Error bars are means ± SD, n = 6 independent repeats. P values were calculated using two-tailed unpaired Student’s t-test. (n) Representative immunohistochemical images of ki67 in tumours tissues in each group.
Extended Data Fig. 1
Tubastatin A promotes ferroptosis, rather than apoptosis or necrosis. (a, b) Cell viability measurements in MDA-MB-231 (a) or MCF-7 (b) cells subjected to the indicated treatments for 32 h or 36 h. Error bars are mean ± s.d., n = 3 independent repeats. Statistical analysis was performed using a two-way ANOVA analysis. (c–d) Cell death and lipid peroxidation measurement in the indicated cells treated with the indicated compounds for 20 h (c) or 28 h (d). MDA-MB-231, Tub, 8 μM; Z-V, 10 μM Z-VAD-FMK; and Nec, 2 μM necrostatin-1s. MCF-7, Tub, 10 μM; Z-V, 10 μM; and Nec, 2 μM. (eh) Cell-death and lipid-peroxidation measurements in MDA-MB-231 or MCF-7 subjected to the indicated treatments for 20 h or 28 h. MDA-MB-231; Tub, 4 μM; Erastin, 2.5 μM; RSL3, 2.5 μM; Z-V, 10 μM Z-VAD-FMK; and Nec, 2 μM necrostatin-1s. MCF-7; Tub, 5 μM; Erastin, 5 μM; RSL3, 2.5 μM; Z-V, 10 μM Z-VAD-FMK; and Nec, 2 μM necrostatin-1s. c-h, Data are the mean ± s.d.; n = 3 biologically independent experiments. Statistical analysis was performed using an unpaired two-tailed Student's t-test.
Extended Data Fig. 2
Tubastatin A did not affect the mRNA and protein level of GPX4. (ad) MDA-MB-231 or MCF-7 cells were treated with Tub or RSL3 at the indicated concentrations and times. The cells were collected and co-immunoprecipitation assays were used to isolate endogenous GPX4 from the cells. (e) Co-immunoprecipitation assays were used to isolate endogenous GPX4 from MDA-MB-231 or MCF-7 cells. (fi) The relative GPX4 mRNA measurement in MDA-MB-231 cells (f, g) or MCF-7 cells (h, i) treated with Tub at the indicated concentrations and times. (j, k) The relative GPX4 protein measurement in MDA-MB-231 cells (j) or MCF-7 cells (k) treated with Tub at the indicated concentrations and times. f-i, statistical analysis was performed using an unpaired two-tailed Student's t-test. (lo) Relative GPX4 enzyme activity measurement in the indicated test tube treated with CAY (CAY10603) or SKLB (SKLB-23bb) for the indicated concentration and time in cell free system. We used co-immunoprecipitation to isolate endogenous GPX4 from MDA-MB-231 cells. l, time: 2 h m, concentration: 8 μM. n, time: 2 h o, concentration: 8 μM. Data are the mean ± s.d.; n = 3 biologically independent experiments. Statistical analysis was performed using an unpaired two-tailed Student's t-test. a-e, j, k, Data are representative of n = 3 biologically independent experiments.
Extended Data Fig. 3
IR enhances GPX4 expression by increasing the transcription of GPX4. (a, b) MCF-7 cells treated with IR at the indicated intensities and times, then confocal microscopy of the cells were performed after staining with Nrf2 (green). (c, d) An immunoblot showing the expression of GPX4 and NRF2 in MDA-MB-231 (c) or MCF-7 (d) cells stable transfected with negative control (NC) or NRF2 shRNA with or without GPX4 overexpression. Data are representative of n = 3 biologically independent experiments. (For interpretation of the references to colour in this figure legend, the reader is referred to the Web version of this article.)
Extended Data Fig. 4
Radiotherapy-mediated decrease of autophagic degradation by the AKT-mTOR-TFEB-lysosomal synthesis pathway. (a–b) An immunoblot showing the expression of the indicated protein in MDA-MB-231 cells (a) or MCF-7 cells (b) subjected to the indicated treatments for 12 h. (a) IR, 4 Gy; MK2206 2.5 μM. (b) IR, 6 Gy; MK2206 2.5 μM. Data are representative of n = 3 biologically independent experiments. (c) MDA-MB-231 cells subjected to the indicated treatments for 12h, then confocal microscopy of the cells was performed after staining with TFEB (red). IR, 4 Gy; MK2206 2.5 μM. (d) MDA-MB-231 cells subjected to the indicated treatments for 12h, then confocal microscopy of the cells was performed after staining with lysotracker (red). IR, 4 Gy; MK2206 2.5 μM. (e) MCF-7 cells subjected to the indicated treatments for 12h, then confocal microscopy of the cells was performed after staining with TFEB (red). IR, 6 Gy; MK2206 2.5 μM. (f) MCF-7 cells subjected to the indicated treatments for 12h, then confocal microscopy of the cells was performed after staining with lysotracker (red). IR, 6 Gy; MK2206 2.5 μM. (For interpretation of the references to colour in this figure legend, the reader is referred to the Web version of this article.)
Extended Data Fig. 5
GPX4 works as a predictor of the response to cancer radiotherapy. (a) Kaplan–Meier analysis of overall survival for breast cancer patients who have undergone radiotherapy. (bd) Kaplan–Meier analysis of overall survival for breast cancer patients (b), liver cancer patients (c), stomach cancer patients (d). (eh) Cell-death measurements in MDA-MB-231 or MCF-7 subjected to the indicated treatments for 24 h or 28 h. MDA-MB-231; Tub, 4 μM; docetaxel, 1.25 μM; doxorubicin, 1.25 μM. MCF-7; Tub, 5 μM; docetaxel, 1.25 μM; doxorubicin, 1.25 μM. Data are the mean ± s.d.; n = 3 biologically independent experiments. Statistical analysis was performed using an unpaired two-tailed Student's t-test.
Extended Data Fig. 6
Tubastatin A has no significant toxicity of bone marrow, intestine, liver, kidney, spleen, lung, and heart. (a) Body weight of the mice in experiment Fig. 7J was measured. (b–f) Blood samples were drawn from the mice in experiment Fig. 7J, and blood cell counts were performed with the Sysemx XN-3000 Hematology System (Sysmex America, Inc.) Data represent mean ± SD. Significance determined by two tailed Student's t-test. WBC, white blood cell; RBC, red blood cell; HGB, hemoglobin; PLT, platelet. (gl) Small intestine, lung, liver, spleen, kidney, and heart samples were obtained from mice in experiment Fig. 6b. H&E staining was performed on processed, sliced samples. Scale bar: 200 μm. (For interpretation of the references to colour in this figure legend, the reader is referred to the Web version of this article.)

References

    1. Dixon S.J., Lemberg K.M., Lamprecht M.R., Skouta R., Zaitsev E.M., Gleason C.E., Patel D.N., Bauer A.J., Cantley A.M., Yang W.S., Morrison B., 3rd, Stockwell B.R. Ferroptosis: an iron-dependent form of nonapoptotic cell death. Cell. 2012;149:1060–1072. - PMC - PubMed
    1. Hassannia B., Vandenabeele P., Vanden Berghe T. Targeting ferroptosis to iron out cancer. Cancer Cell. 2019;35:830–849. - PubMed
    1. Zhang H.L., Hu B.X., Li Z.L., Du T., Shan J.L., Ye Z.P., Peng X.D., Li X., Huang Y., Zhu X.Y., Chen Y.H., Feng G.K., Yang D., Deng R., Zhu X.F. PKCbetaII phosphorylates ACSL4 to amplify lipid peroxidation to induce ferroptosis. Nat. Cell Biol. 2022;24:88–98. - PubMed
    1. Lei G., Zhuang L., Gan B. Targeting ferroptosis as a vulnerability in cancer. Nat. Rev. Cancer. 2022;22:381–396. - PMC - PubMed
    1. Yan B., Ai Y., Sun Q., Ma Y., Cao Y., Wang J., Zhang Z., Wang X. Membrane damage during ferroptosis is caused by oxidation of phospholipids catalyzed by the oxidoreductases POR and CYB5R1. Mol. Cell. 2021;81:355–369 e310. - PubMed

Publication types

Substances