. 2023 Jun:62:102687.
doi: 10.1016/j.redox.2023.102687. Epub 2023 Mar 21.

Pathologically high intraocular pressure induces mitochondrial dysfunction through Drp1 and leads to retinal ganglion cell PANoptosis in glaucoma

Affiliations

Pathologically high intraocular pressure induces mitochondrial dysfunction through Drp1 and leads to retinal ganglion cell PANoptosis in glaucoma

Zhou Zeng et al. Redox Biol. 2023 Jun.

Abstract

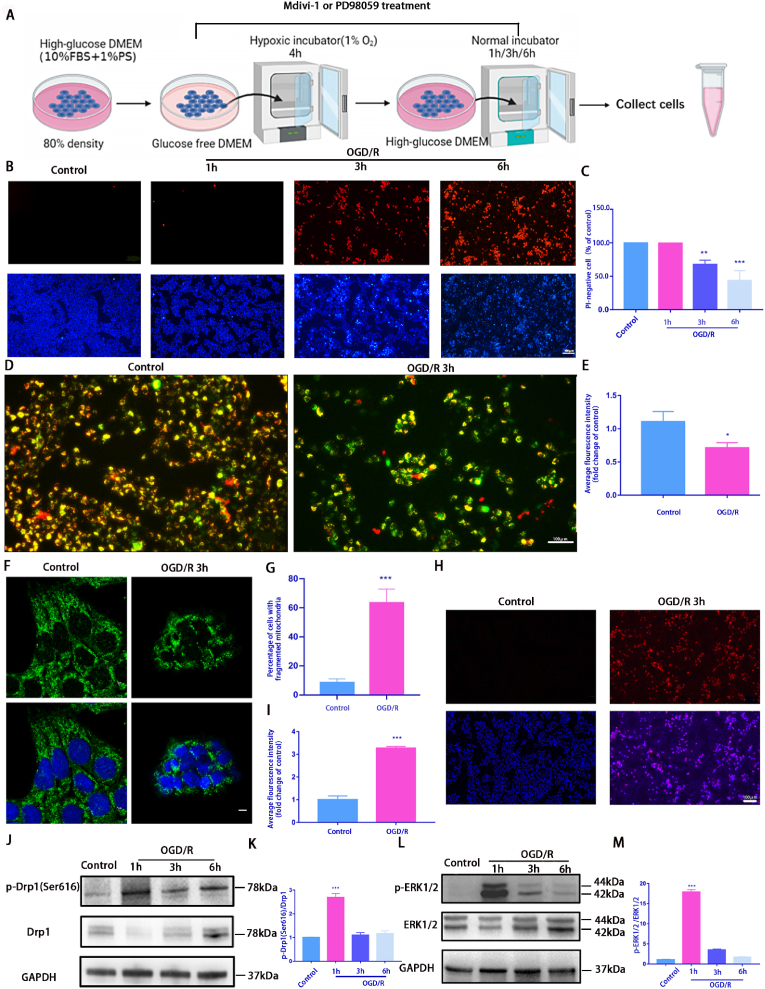
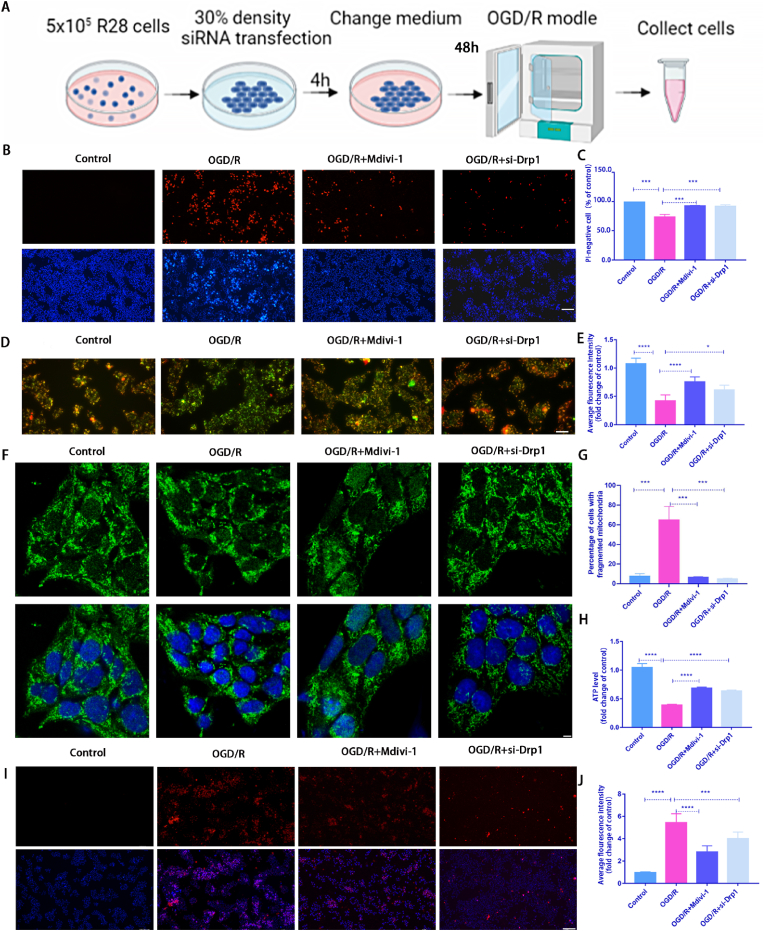
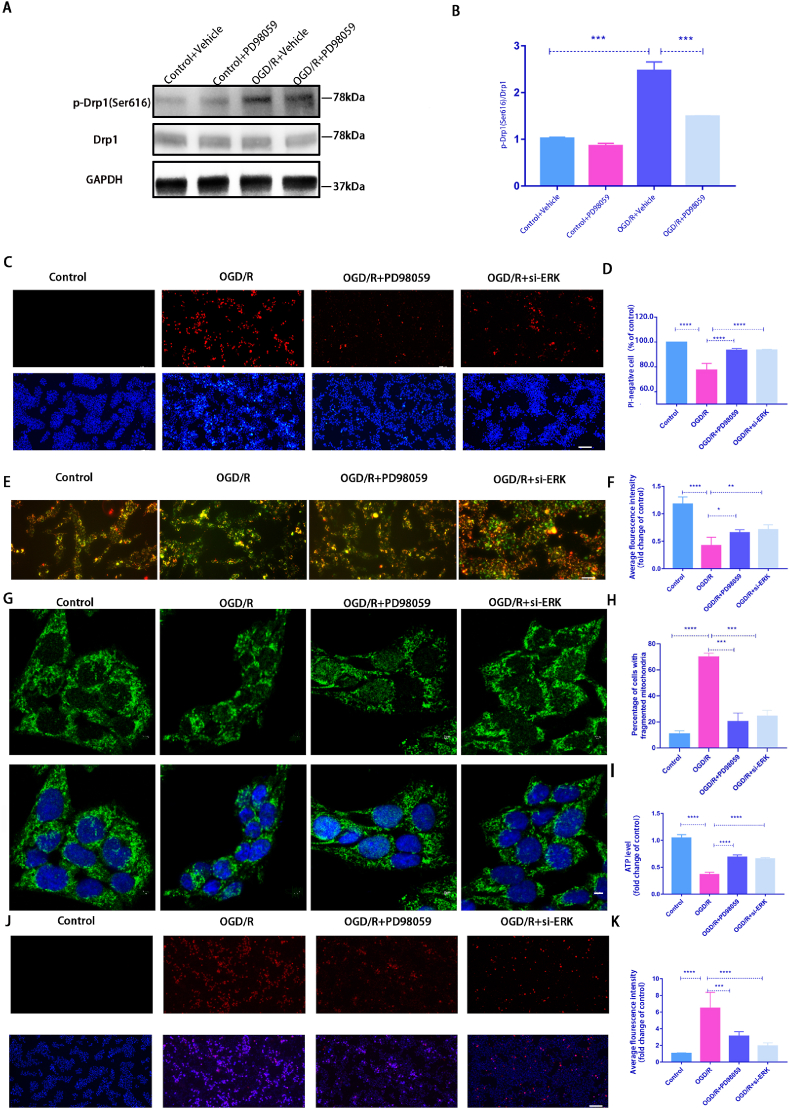
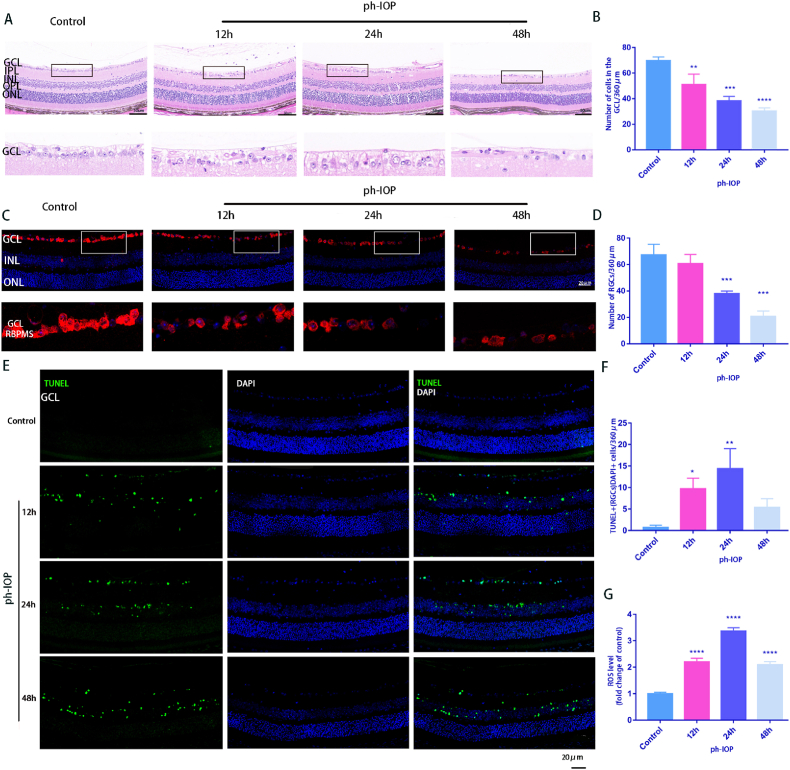
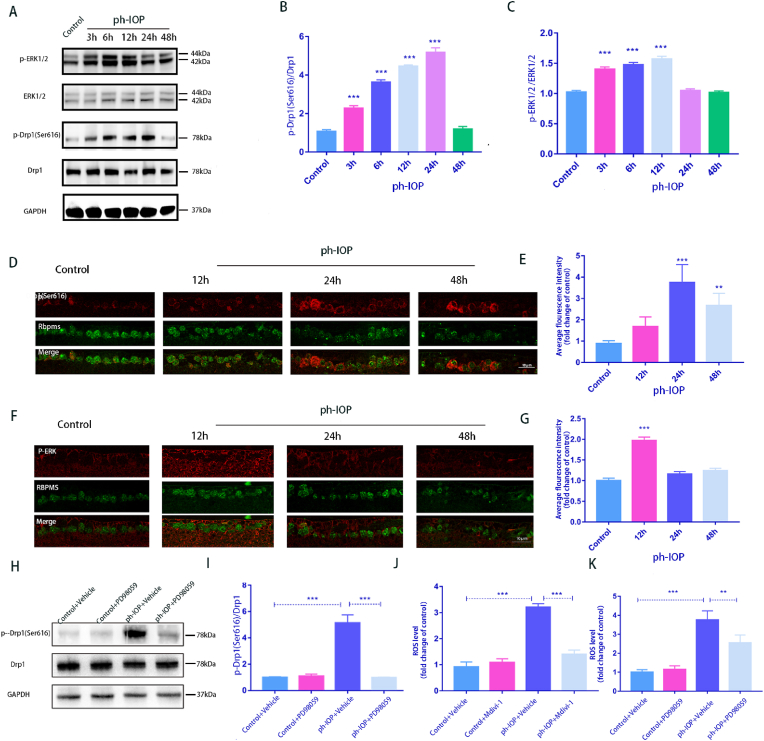
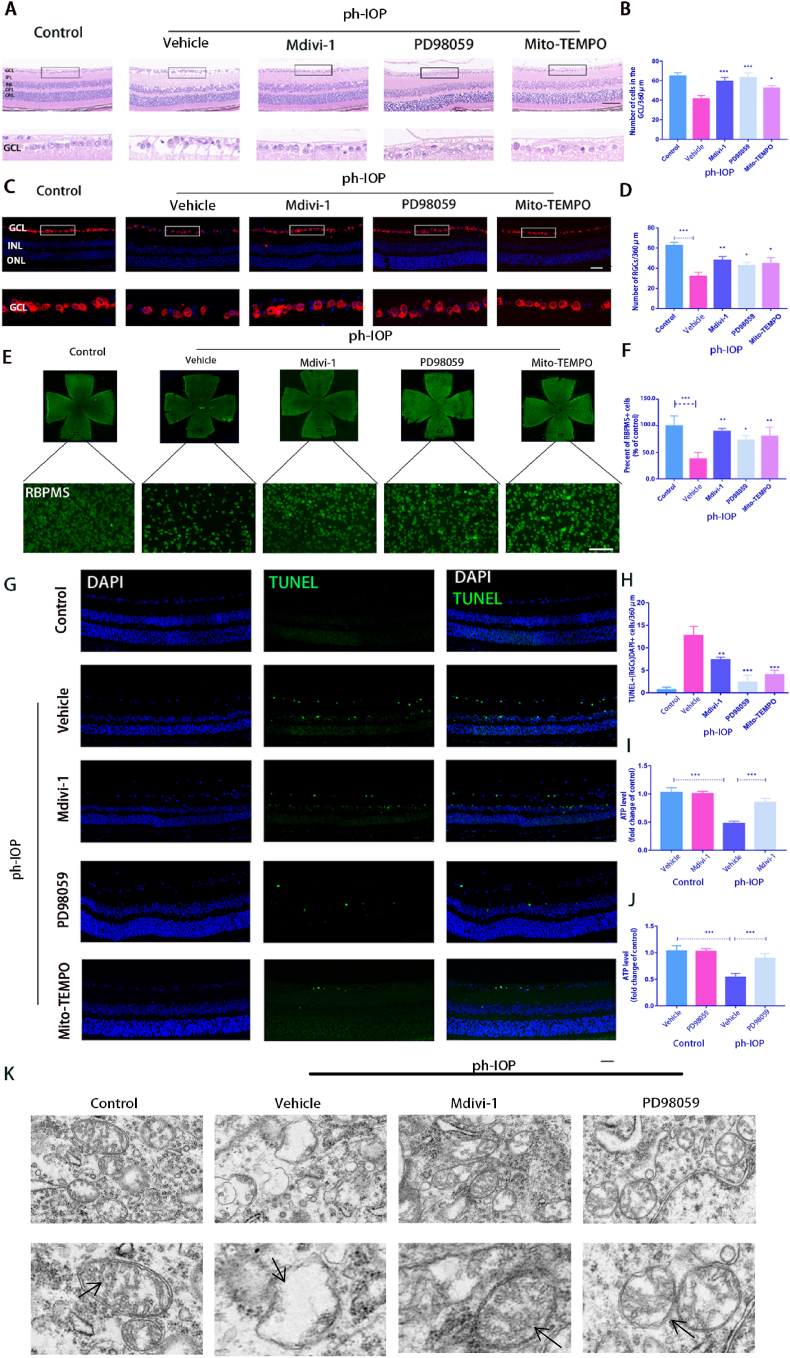
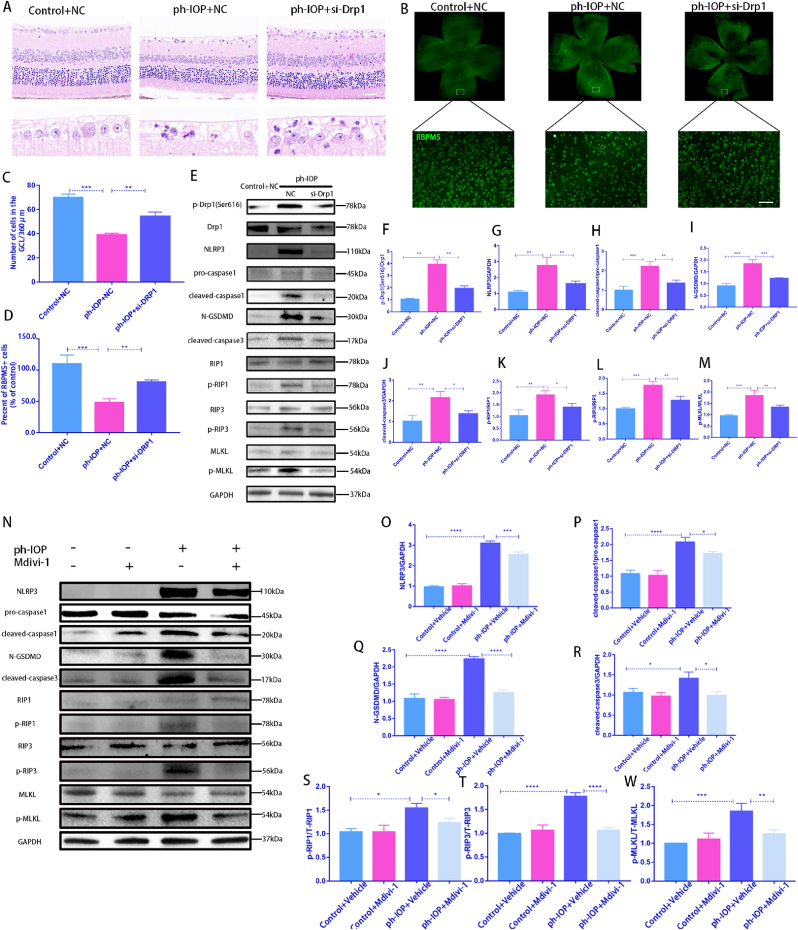
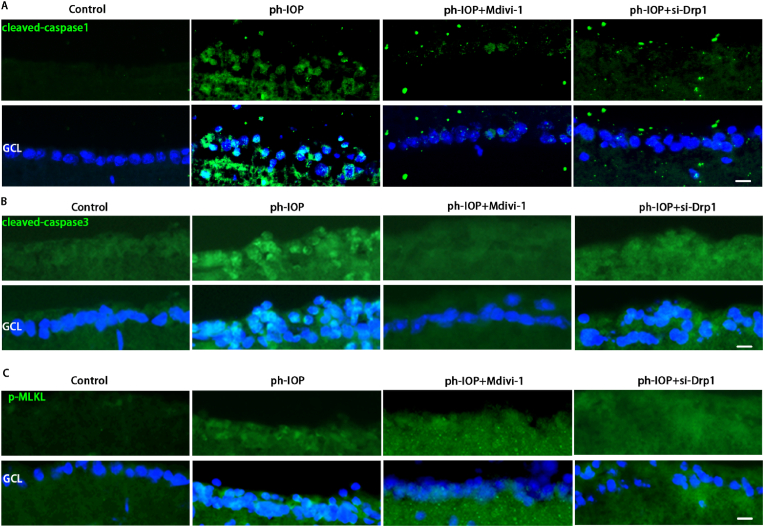
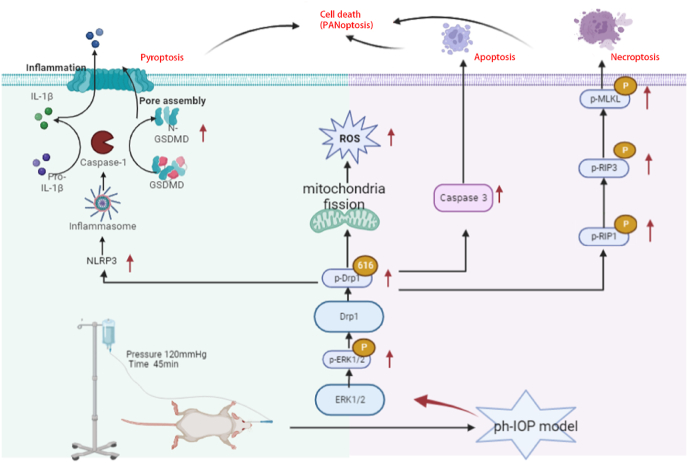
Glaucoma is a common neurodegenerative disease characterized by progressive retinal ganglion cell (RGC) loss and visual field defects. Pathologically high intraocular pressure (ph-IOP) is an important risk factor for glaucoma, and it triggers molecularly distinct cascades that control RGC death and axonal degeneration. Dynamin-related protein 1 (Drp1)-mediated abnormalities in mitochondrial dynamics are involved in glaucoma pathogenesis; however, little is known about the precise pathways that regulate RGC injury and death. Here, we aimed to investigate the role of the ERK1/2-Drp1-reactive oxygen species (ROS) axis in RGC death and the relationship between Drp1-mediated mitochondrial dynamics and PANoptosis in ph-IOP injury. Our results suggest that inhibiting the ERK1/2-Drp1-ROS pathway is a potential therapeutic strategy for treating ph-IOP-induced injuries. Furthermore, inhibiting Drp1 can regulate RGC PANoptosis by modulating caspase3-dependent, nucleotide-binding oligomerization domain-like receptor-containing pyrin domain 3(NLRP3)-dependent, and receptor-interacting protein (RIP)-dependent pathways in the ph-IOP model. Overall, our findings provide new insights into possible protective interventions that could regulate mitochondrial dynamics to improve RGC survival.

Keywords: Dynamin-related protein 1; Glaucoma; Mitochondrial dynamics; PANoptosis; Retinal ganglion cell.


Figures

Fig. 1
Fig. 1
OGD/R model induces mitochondrial damage and death in R28 cells A: A schematic diagram of OGD/R treatment. R28 cells cultured in glucose-free DMEM were incubated in a hypoxic chamber (1% O2) for 4 h followed by 1 h, 3 h, or 6 h reoxygenation in normal complete medium. Control cells were maintained in a complete medium under normoxic conditions. Cells from each time point were used for subsequent analysis; B: OGD/R-induced cell death was detected using Hoechst 33342 and PI dual staining. Scale bar = 100 μm; C: Quantifying the percentage of PI-positive cells(n = 9); D: The ΔψM was measured using JC-1 staining(2.0 μg/mL) after 3h OGD/R. Scale bar = 100 μm; E: The relative red/green ratio quantification(n = 9); F: Confocal microscopy was used to determine mitochondrial morphology using Tom20 antibodies via immunofluorescence after 3 h OGD/R. Scale = 2 μm; G: The average mitochondrial length was analyzed(n = 9); H: Mito-SOX(2 μM) staining was used to detect the ROS level of mitochondrial after 3h OGD/R. Red fluorescence represents mitochondrial ROS production, and Hoechst staining in the nuclei is shown in blue. Scale bar = 100 μm; I: Relative Mito-SOX red fluorescence quantification(n = 9); J and L: Western blotting was performed to detect p-Drp1(Ser616), Drp1, p-ERK1/2, and ERK1/2 expression at each time point after OGD/R treatment; K and M: Quantification of p-Drp1(Ser616), Drp1, p-ERK1/2, and ERK1/2 levels. Relative protein levels were calculated using ImageJ software(n = 9). Values are expressed as means ± standard deviations (SD). One-way analysis of variance (ANOVA) was followed by the Dunnett's test. *P < 0.05, **P < 0.01, ***P < 0.001and****P < 0.0001 vs Control.
Fig. 2
Fig. 2
Mdivi-1 treatment or silencing Drp1 expression using siRNA transfection alleviated R28 cell injury induced by OGD/R. A: A schematic diagram of siRNA application. R28 cells were plated and cultured to 30% confluence for transfection. After 4 h transfection, R28 cells were cultured for an additional 48 h and then subjected to OGD/R modeling; B: After Mdivi-1 treatment or silencing Drp1 expression, the cell death rate was detected using Hoechst 33342 and PI dual staining. Scale bar = 100 μm; C: Quantification of the percentage of PI-positive cells(n = 9); D: After Mdivi-1 treatment or silencing Drp1 expression, the ΔψM was measured by JC-1 staining(2.0 μg/ml). Scale bar = 100 μm; E: Quantification of the relative red/green ratio(n = 9); F: After Mdivi-1 treatment or silencing Drp1 expression, mitochondrial morphology was identified using Tom20 antibodies by immunofluorescence. Scale bar = 2 μm; G: Average mitochondrial lengths were analyzed (n = 9); H: After Mdivi-1 treatment or silencing Drp1 expression, ATP assay kit was used to detect ATP production(n = 9); I: After Mdivi-1 treatment or silencing Drp1 expression, Mito-SOX(2 μM) staining to detect the ROS level. Red fluorescent spots represent mitochondrial ROS production, and Hoechst staining in the nuclei is shown in blue. Scale bar = 100 μm; J: Quantification of the relative Mito-SOX red fluorescent intensity(n = 9). Values are expressed as the mean ± SD. One-way ANOVA was followed by the Dunnett's test. *P < 0.05, **P < 0.01, ***P < 0.001and****P < 0.0001 vs OGD/R.
Fig. 3
Fig. 3
PD98059 treatment or silencing ERK1/2 expression by siRNA alleviated OGDR-induced damage to R28 cells. A: Western blot was used to detect the expression level of p-Drp1 (Ser616) after PD98059 application; B: Quantification of the WB result(n = 9); C: After PD98059 treatment or silencing ERK1/2 expression, the cell death rate was detected by Hoechst 33342 and PI dual staining. Scale bar = 100 μm; D: Quantification of the percentage of PI-positive cells(n = 9); E: After PD98059 treatment or silencing ERK1/2 expression, the ΔψM was measured by JC-1 staining(2.0 μg/ml). Scale bar = 100 μm; F: Quantification of the relative red/green ratio(n = 9); G: After PD98059 treatment or silencing ERK1/2 expression, mitochondrial morphology was identified using Tom20 antibodies by immunofluorescence. Scale = 2 μm; H: Average mitochondrial lengths were analyzed(n = 9); I: After PD98059 treatment or silencing ERK1/2 expression, ATP assay kit was used to detect ATP production(n = 9); J: PD98059 treatment or silencing ERK1/2 expression, Mito-SOX(2 μM) staining to detect the ROS level. Red fluorescent spots represent mitochondrial ROS production, Hoechst staining in the nuclei is shown in blue. Scale = 100 μm; K: Quantification of the relative Mito-SOX red fluorescent intensity(n = 9). Values are expressed as the mean ± SD. One-way ANOVA was followed by Dunnett's test. *P < 0.05, **P < 0.01, ***P < 0.001 and ****P < 0.0001 vs OGD/R.
Fig. 4
Fig. 4
ph-IOP injury-induced mitochondrial damage and cell death in RGCs A: HE-stained retinal sections in control and ph-IOP group at 12 h, 24 h, and 48 h showed retinal structure changes after ph-IOP. Scale bar = 50 μm; The lower pictures are the enlarged representations of the boxed regions of the upper pictures. B: Quantification of the number of cells in the retinal GCL(n = 9); C: RGCs identified using RBPMS antibodies by immunofluorescence with retinal paraffin sections. The lower images are the enlarged representations of the boxed regions of the upper pictures. Scale bar = 20 μm; D: The average number of RGCs at different ph-IOP times (12 h, 24 h, and 48 h) were calculated(n = 9); E: Retinal paraffin sections were stained using TUNEL to observe cell apoptosis. Scale bar = 20 μm; F: TUNEL-positive RGCs were counted(n = 9); G: Retinal ROS generation was determined using DCFH-DA fluorescence intensity quantification after ph-IOP (12 h, 24 h, and 48 h) (n = 9). Values are expressed as the mean ± SD. One-way ANOVA was followed by Dunnett's test. *P < 0.05, **P < 0.01, ***P < 0.001and****P < 0.0001 vs Control.
Fig. 5
Fig. 5
ph-IOP model activates the ERK-Drp1-ROS signaling pathway A: Western blot detected the expression of p-ERK1/2 and p-Drp1 (Ser616); B–C: Western blot quantitative results of p-Drp1 (Ser616) and p-ERK1/2(n = 9); D: Co-staining of p-Drp1 (Ser616) and RBPMS. Scale bar = 10 μm; E: Average fluorescence intensity quantification of p-Drp1 (Ser616) (n = 9); F: Co-staining of p-ERK1/2 and RBPMS. Scale bar = 10 μm; G: Average fluorescence intensity quantification of p-ERK1/2(n = 9); H: After PD98059 treatment, Western blot detected the expression of p-Drp1 (Ser616); I: Quantification of p-Drp1 (Ser616) expression levels after using PD98059(n = 9); J: After Mdivi-1 treatment, retinal ROS generation was determined using DCFH-DA fluorescence intensity quantification (n = 9); K: After treatment with PD98059, retinal ROS generation was determined using DCFH-DA fluorescence intensity quantification(n = 9). Values are expressed as the mean ± SD. One-way ANOVA was followed by Dunnett's test. *P < 0.05, **P < 0.01, ***P < 0.001 and ****P < 0.0001 vs Control(A-G) or ph-IOP + Vehicle(H-K).
Fig. 6
Fig. 6
Inhibiting the ERK1/2-Drp1-ROS signaling pathway can reduce ph-IOP-induced RGC damage in mouse. A: After Mdivi-1, PD98059, or Mito-TEMPO treatment, HE was used to observe the retinal morphology and the number of cells in the RGC layer. Scale bar = 50 μm; B: Quantification of the number of cells in the retina GCL of each group(n = 9); C: RGCs identified using RBPMS antibodies by immunofluorescence with retinal paraffin sections. The lower images are the enlarged representations of the boxed regions of the upper pictures. Scale bar = 20 μm; D: The average number of RGCs at different groups were calculated(n = 9); E–F: After Mdivi-1, PD98059 or Mito-TEMPO treatment, RBPMS-positive cells in whole mounted retinas were assessed by observing flat-mounted retinas. Scale bar = 100 μm(n = 9); G: Retinal paraffin sections were stained using TUNEL to observe cell apoptosis. The lower pictures are the enlarged representations of the boxed regions of the upper pictures. Scale bar = 20 μm; H: TUNEL-positive RGCs were counted(n = 9); I–J: ATP kit was used to detect the total content of ATP in the retina(n = 9); K: TEM tracks mitochondrial damage in RGCs, Black arrows indicate the morphology of mitochondria in each group(n = 9). Values are expressed as the mean ± SD. One-way ANOVA was followed by the Dunnett's test. *P < 0.05, **P < 0.01, ***P < 0.001 and****P < 0.0001 vs ph-IOP + Vehicle.
Fig. 7
Fig. 7
Silencing Drp1 expression by siRNA or Mdivi-1 treatment rescues ph-IOP-induced RGC PANoptosis in vivo. A: After silencing Drp1 expression by siRNA, HE was used to observe the retinal morphology and the number of cells in the RGC layer. Scale bar = 50 μm; B: After silencing Drp1 expression by siRNA, RBPMS-positive cells in whole mounted retinas were assessed by observing flat-mounted retinas; Scale bar = 50 μm; C: Quantification of the number of cells in the GCL of each group(n = 9); D: Quantification of RGC cell density in each group(n = 9); E: After silencing Drp1 expression by siRNA, Western blot used to detected PANoptosis-related proteins; F–M: Western blot results were quantified(n = 9); N:After Mdivi-1 treatment, Western blot was used to detect PANoptosis-related proteins; O–W: Western blot results were quantified(n = 9). Values are expressed as the mean ± SD. One-way ANOVA was followed by Dunnett's test. *P < 0.05, **P < 0.01, ***P < 0.001and****P < 0.0001 vs ph-IOP.
Fig. 8
Fig. 8
Silencing Drp1 expression by siRNA or Mdivi-1 treatment rescues ph-IOP-induced RGC PANoptosis in vivo. A: After si-Drp1 or Mdivi-1 treatment, retinal immunofluorescence staining detected cleaved-caspase1 expression levels, Scale bar = 10 μm(n = 9); B: After si-Drp1or Mdivi-1 treatment, immunofluorescence used to detect cleaved-caspase3 expression levels, Scale bar = 10 μm(n = 9); C: After si-Drp1 or Mdivi-1 treatment, immunofluorescence used to detect p-MLKL expression levels, Scale bar = 10 μm (n = 9). NC: negative control. Values are expressed as the mean ± SD. One-way ANOVA was followed by Dunnett's test. *P < 0.05, **P < 0.01, ***P < 0.001and****P < 0.0001 vs ph-IOP.
Fig. 9
Fig. 9
ph-IOP -induces the death of RGCs through the ERK1/2-Drp1-ROS signaling pathway ph-IOP injury is an important pathological process in the development of glaucoma and can aggravate the damage of RGCs in glaucoma. In this study, ph-IOP injury induced the increased phosphorylation of ERK1/2, followed by the phosphorylation of Drp1 at serine 616. This led to mitochondrial fission and dysfunction (decreased mitochondrial membrane potential, decreased ATP, etc.), resulting in the production of large amounts of ROS, eventually leading to the PANoptosis of RGCs. Regulation of Drp1-mediated abnormalities in mitochondrial dynamics is a potential therapeutic target for ph-IOP-induced PANoptosis.

References

    1. Kang J.M., Tanna A.P. Glaucoma. Med. Clin. 2021;105:493–510. - PubMed
    1. Weinreb R.N., Aung T., Medeiros F.A. The pathophysiology and treatment of glaucoma: a review. JAMA. 2014;311:1901–1911. - PMC - PubMed
    1. Zukerman R., Harris A., Oddone F., Siesky B., Verticchio Vercellin A., Ciulla T.A. Glaucoma heritability: molecular mechanisms of disease. Genes. 2021;12 - PMC - PubMed
    1. Almasieh M., Wilson A.M., Morquette B., Cueva Vargas J.L., Di Polo A. The molecular basis of retinal ganglion cell death in glaucoma. Prog. Retin. Eye Res. 2012;31:152–181. - PubMed
    1. Sun M.H., Pang J.H., Chen S.L., Han W.H., Ho T.C., Chen K.J., Kao L.Y., Lin K.K., Tsao Y.P. Retinal protection from acute glaucoma-induced ischemia-reperfusion injury through pharmacologic induction of heme oxygenase-1. Invest. Ophthalmol. Vis. Sci. 2010;51:4798–4808. - PubMed

Publication types