. 2023 May 1:561:216149.
doi: 10.1016/j.canlet.2023.216149. Epub 2023 Mar 27.

scRNA-Seq and imaging mass cytometry analyses unveil iNKT cells-mediated anti-tumor immunity in pancreatic cancer liver metastasis

Affiliations

scRNA-Seq and imaging mass cytometry analyses unveil iNKT cells-mediated anti-tumor immunity in pancreatic cancer liver metastasis

Qijun Yi et al. Cancer Lett. .

Erratum in

Abstract

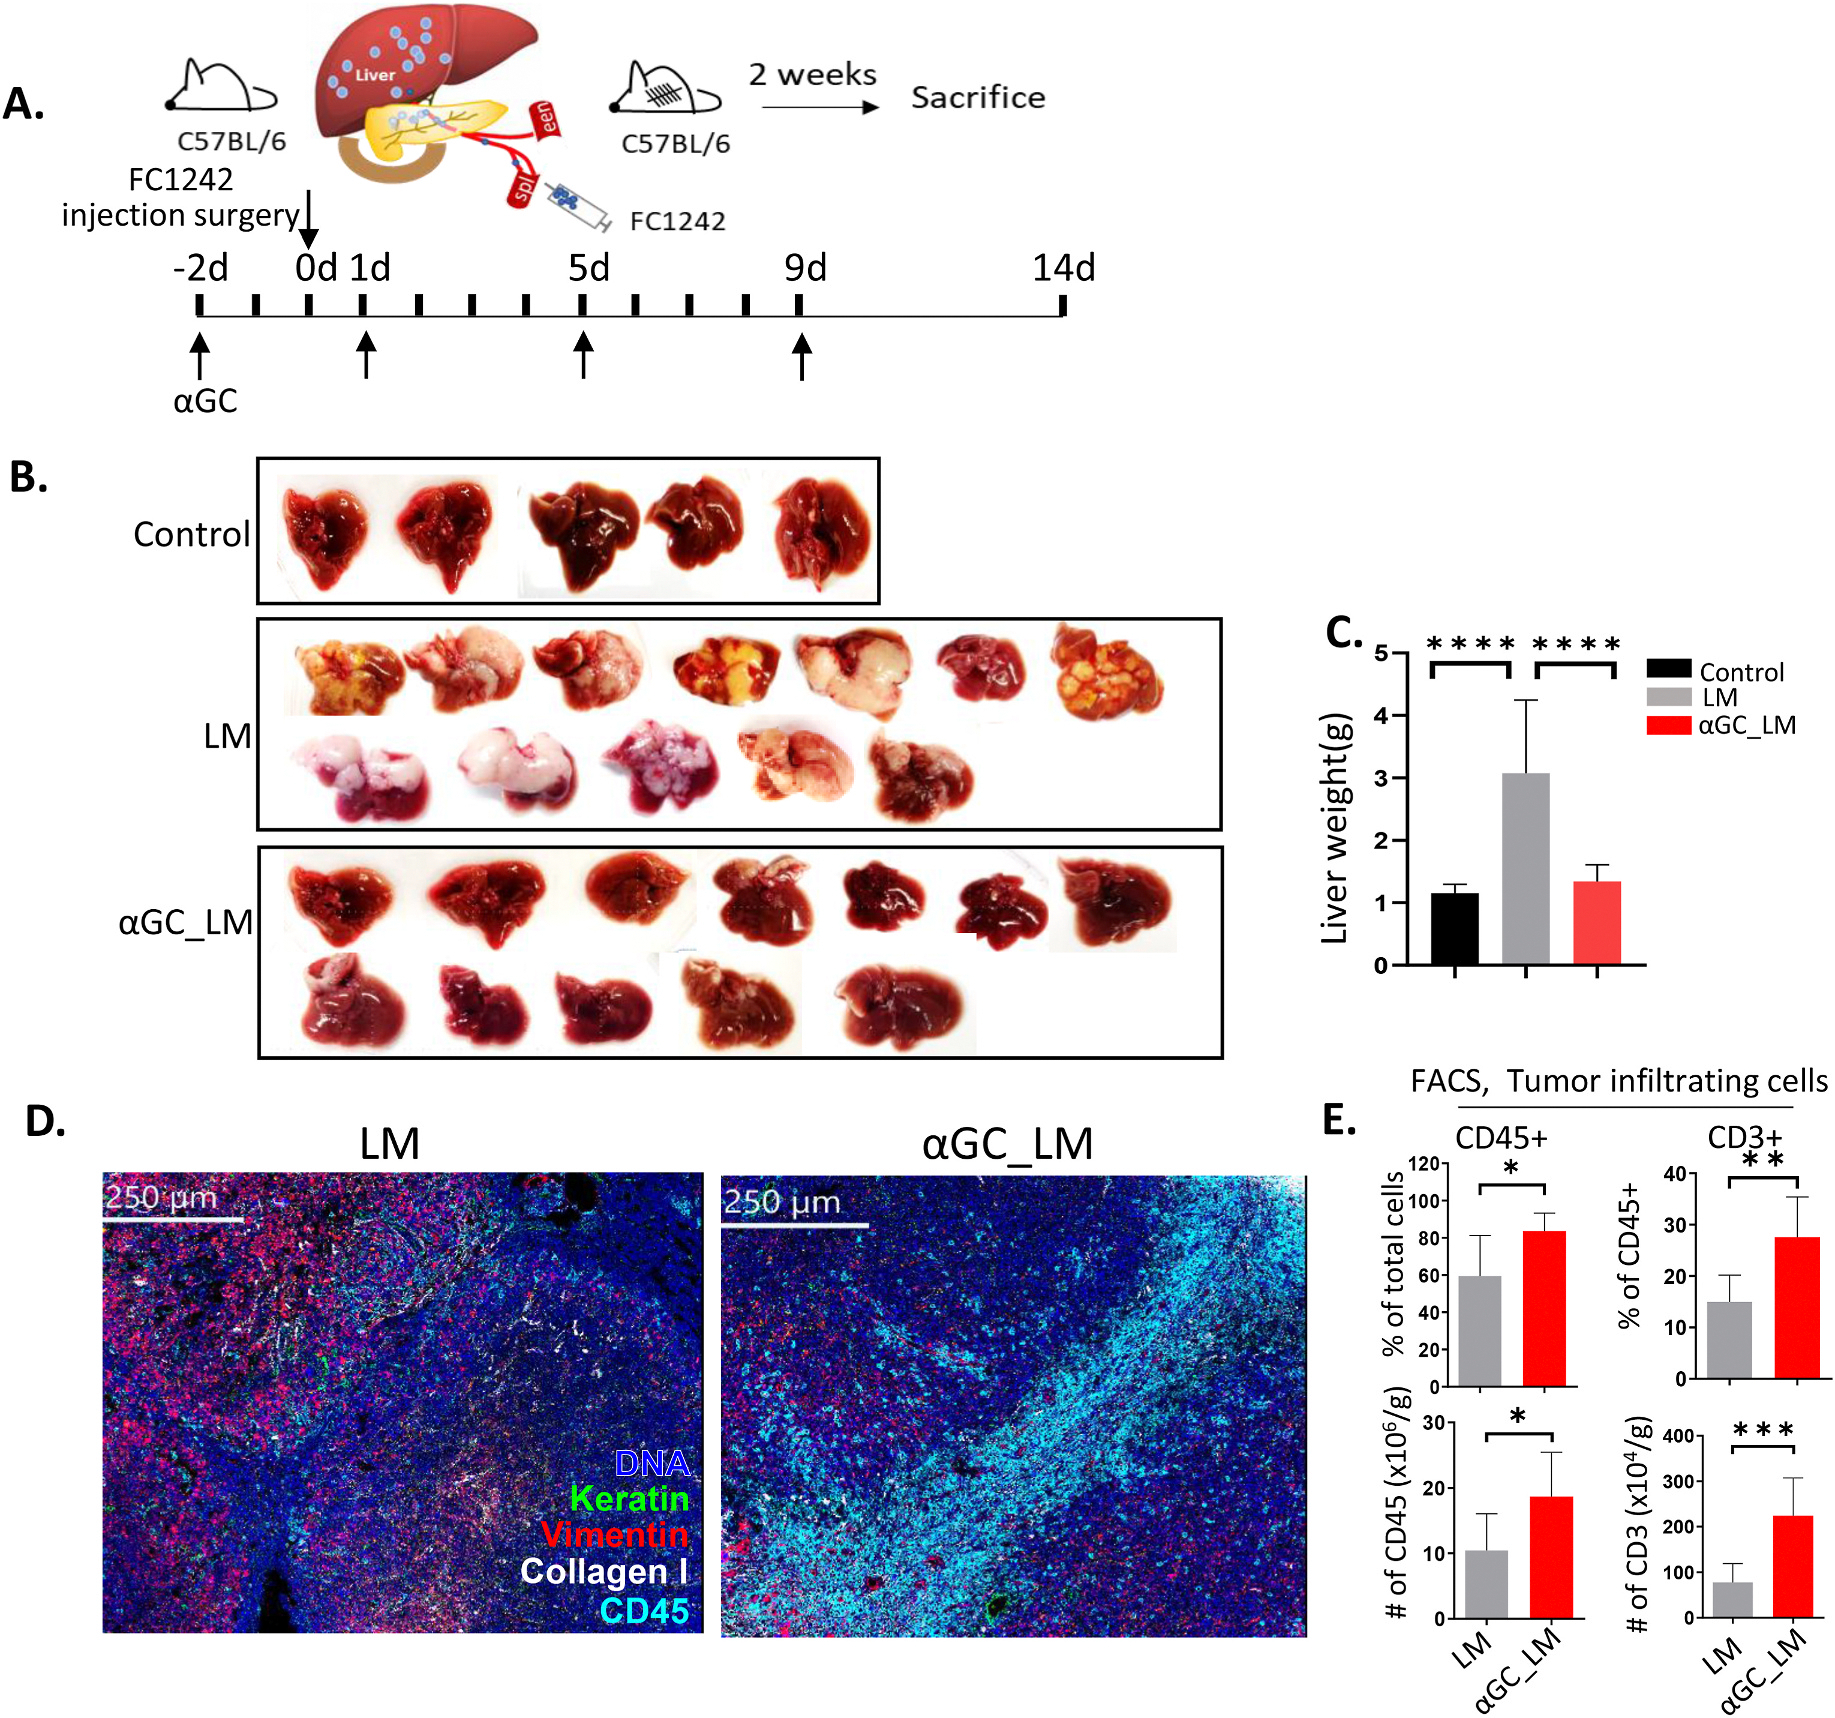
Invariant natural killer T (iNKT) cells are innate-like T cells that are abundant in liver sinusoids and play a critical role in tumor immunity. However, the role of iNKT cells in pancreatic cancer liver metastasis (PCLM) has not been fully explored. In this study, we employed a hemi-spleen pancreatic tumor cell injection mouse model of PCLM, a model that closely mimics clinical conditions in humans, to explore the role of iNKT cells in PCLM. Activation of iNKT cells with α-galactosylceramide (αGC) markedly increased immune cell infiltration and suppressed PCLM progression. Via single cell RNA sequencing (scRNA-seq) we profiled over 30,000 immune cells from normal liver and PCLM with or without αGC treatment and were able to characterize the global changes of the immune cells in the tumor microenvironment upon αGC treatment, identifying a total of 12 subpopulations. Upon treatment with αGC, scRNA-Seq and flow cytometry analyses revealed increased cytotoxic activity of iNKT/NK cells and skewing CD4 T cells towards a cytotoxic Th1 profile and CD8 T cells towards a cytotoxic profile, characterized by higher proliferation and reduced exhaustion marker PD1 expression. Moreover, αGC treatment excluded tumor associated macrophages. Lastly, imaging mass cytometry analysis uncovered the reduced epithelial to mesenchymal transition related markers and increased active CD4 and CD8 T cells in PCLM with αGC treatment. Overall, our findings uncover the protective function of activated iNKT cells in pancreatic cancer liver metastasis through increased NK and T cell immunity and decreased tumor associated macrophages.

Keywords: CD4 T; CD8 T cell; Invariant natural killer T(iNKT) cells; Pancreatic cancer liver metastasis; Tumor immunity; scRNA-seq; α-galactosylceramide (αGC).


Conflict of interest statement

Declaration of competing interest The authors declare that they have no known competing financial interests or personal relationships that could have appeared to influence the work reported in this paper.

Figures

Fig. 1.
Fig. 1.
αGC treatment suppressed liver metastasis from pancreatic tumor (A) Hemi-spleen pancreatic tumor liver metastasis model. (B) Representative photographic views of liver from control mice, live metastasis mice with vehicle treated (LM), and LM mice treated with αGC (αGC_LM). (C) Liver weight from each group. (D) Representative images of showing expression of keratin, vimentin, collagen type I, and CD45 in LM with vehicle control or αGC treatment by imaging mass cytometry (IMC). Cells presented by DNA positive staining. (E) Bar graphs showing frequency and absolute number of CD45+ cells (left) and CD3+ cells (right) in tumors from LM and αGC_LM. n = 20–30 mice/group, Student’s t-test, *p < 0.05, **p < 0.01, ***p < 0.001, and ****p < 0.0001.
Fig. 2.
Fig. 2.
CD45+ cells subtype analysis based on single cell gene expression (A) The UMAP plot of CD45+ cells from Control, LM, and αGC_LM mice, showing the formation of 12 main clusters shown in different colors. The functional description of each cluster is determined by the gene expression characteristics. (B) Dot plots of key markers used to define the identified cell populations. The color of each dot represents the average expression, while the size of the dot represents the percentage of expression. Gene expression of lineage markers have been merged for all 3 samples. (C) The fractions of 12 clusters defined in CD45+ cells in Control, LM, and αGC_LM.
Fig. 3.
Fig. 3.
Tumor infiltrating iNKT and NK cells display cytotoxic activity with αGC treatment (A) Bar graphs showing frequency and absolute number of tumor infiltrating iNKT cells from PCLM mice treated with vehicle (LM) or αGC (αGC_LM). (B) Violin plots showing the expression profiles of Gzma, Gzmb, Prf1, and Ifng identified in tumor infiltrating iNKT cells from control, LM, and αGC-treated LM mice. The expression is measured as the log2 (TPM+1). (C) Representative flow cytometry plots showing GZMA and GZMB expression in tumor-infiltrating iNKT cells from LM and αGC_LM mice. (D) Representative flow cytometry histogram showing Perforin expression on iNKT cells. (E) Tumor-infiltrating immune cells were stimulated in vitro with PMA/Iononomycin for 4 h. Flow cytometry shows IFN-γ+ iNKT cells. (F) Bar graphs showing frequency of tumor infiltrating NK cells from LM and αGC_LM mice. (G) Violin plots showing the expression profile of Gzma, Gzmb, Prf1, and Ifng identified in tumor-infiltrating NK cells from Control, LM, and αGC_LM mice. The expression is measured as the log2 (TPM+1). (H) Representative flow cytometry histogram showing Perforin and GZMB expression on tumor infiltrating NK cells from LM and αGC_LM mice. (I) Representative flow cytometry plot showing GZMA expression on tumor infiltrating NK cells from LM and αGC_LM mice. (J) Tumor-infiltrating immune cells were stimulated in vitro with PMA/Inonomycin for 4 h. Flow cytometry shows IFN-γ+ NK cells. n = 5–8 mice/group, Student’s t-test, *p < 0.05, **p < 0.01, ***p < 0.001, and ****p < 0.0001.
Fig. 4.
Fig. 4.
iNKT cells activation by αGC skews CD4 T cells toward cytotoxic Th1 profile (A) Bar graphs showing frequency and absolute number of tumors infiltrating CD4 T cells from LM and αGC_LM mice. (B) The UMAP plot of CD4 T cells from Control, LM, and αGC_LM mice, showing the formation of 5 main clusters shown in different colors. The functional description of each cluster is determined by the gene expression characteristics. (C) Dot plots of key markers used to define the identified cell populations. The color of each dot represents the average expression, while the size of the dot represents the percentage of expression. Gene expression of lineage markers have been merged from all 3 samples. (D) The fractions of 5 clusters defined in CD4 T cells in Control, LM, and αGC_LM mice. (E) Heatmap showing the −log(P-value) of indicated signaling pathways in CD4 T cells from IPA analysis for Control, LM, and αGC_LM mice. (F) Representative flow cytometry showing T-bet expression and IFN-γ and TNF-α production in tumor infiltrating CD4 T cells from LM and αGC_LM mice. (G) Representative IMC images showing expression of CD4 and GZMB in LM and αGC_LM. Arrows in the zoom-in regions indicating co-localization of CD4 and GZMB. n = 5–8 mice/group, Student’s t-test, *p < 0.05, **p < 0.01.
Fig. 5.
Fig. 5.
iNKT cells activated with αGC promote CD8 T cell cytotoxic activity and prevent CD8 T cells from exhaustion. (A) Bar graphs showing frequency and absolute number of tumor infiltrating CD8 T cells from LM and αGC_LM mice. (B) The UMAP plot of CD8 T cells from Control, LM, and αGC_LM mice, showing the formation of 5 main clusters shown in different colors. The functional description of each cluster is determined by the gene expression characteristics. (C) Dot plots of key markers used to define the identified cell populations. The color of each dot represents the average expression, while the size of the dot represents the percentage of expression. Gene expression of lineage markers have been merged for all 3 samples. (D) The fractions of 5 clusters defined in CD8 T cells in Control, LM, and αGC_LM mice. (E) Heatmap showing the −log(P-value) of indicated signaling pathways in macrophages from IPA analysis for Control, LM, and αGC_LM mice. (F) Histogram and bar graphs showing Perforin and GZMB expression; (G) Representative flow cytometry showing ICOS, CD69, CD44, and T-bet expression, and TNF-α production (H) Representative flow cytometry showing Lag3 and PD-1 expression in tumor infiltrating CD8 T cells LM and aGC_LM. (I) Representative IMC images showing expression of CD8 and PD-1 in LM treated with vehicle or aGC. Arrows in the zoom-in regions indicating co-localization of CD8 and PD-1. n = 5–7 mice/group, Student’s t-test, *p < 0.05, **p < 0.01, ***p < 0.001, and ****p < 0.0001.
Fig. 6.
Fig. 6.
iNKT cell activation with αGC excludes tumor-associated macrophages (A) Bar graphs showing frequency and absolute number of tumor infiltrating macrophages from LM and αGC_LM mice. (B) Volcano plot highlighting significant differences in gene expression between MΦ_a and MΦ_b cells. Red indicates expression upregulation in MΦ_a. (C) Heatmap showing the −log(P-value) of indicated signaling pathways from IPA analysis in macrophages from Control, LM, and αGC_LM mice. n = 4–8 mice/group, Student’s t-test, **p < 0.01, ***p < 0.001. (D) Proposed model of iNKT cell–mediated protection of PCLM.

References

    1. Siegel RL, Miller KD, Jemal A, Cancer statistics, 2020, CA Cancer J Clin 70 (1) (2020) 7–30, 10.3322/caac.21590. - DOI - PubMed
    1. Spadi R, Brusa F, Ponzetti A, Chiappino I, Birocco N, Ciuffreda L, et al., Current therapeutic strategies for advanced pancreatic cancer: a review for clinicians, World J. Clin. Oncol. 7 (1) (2016) 27–43, 10.5306/wjco.v7.i1.27. - DOI - PMC - PubMed
    1. Sivaram N, McLaughlin PA, Han HV, Petrenko O, Jiang YP, Ballou LM, et al., Tumor-intrinsic PIK3CA represses tumor immunogenecity in a model of pancreatic cancer, J. Clin. Invest. 129 (8) (2019) 3264–3276, 10.1172/JCI123540. - DOI - PMC - PubMed
    1. Hingorani SR, Wang L, Multani AS, Combs C, Deramaudt TB, Hruban RH, et al., Trp53R172H and KrasG12D cooperate to promote chromosomal instability and widely metastatic pancreatic ductal adenocarcinoma in mice, Cancer Cell 7 (5) (2005) 469–483, 10.1016/j.ccr.2005.04.023. - DOI - PubMed
    1. Hundeyin M, Kurz E, Mishra A, Rossi JAK, Liudahl SM, Leis KR, et al., Innate alphabeta T Cells mediate antitumor immunity by orchestrating immunogenic macrophage programming, Cancer Discov. 9 (9) (2019) 1288–1305, 10.1158/2159-8290.CD-19-0161. - DOI - PMC - PubMed

Publication types