. 2023 Apr 4;81(13):1263-1278.
doi: 10.1016/j.jacc.2023.01.036.

Hematopoietic Somatic Mosaicism Is Associated With an Increased Risk of Postoperative Atrial Fibrillation

Affiliations

Hematopoietic Somatic Mosaicism Is Associated With an Increased Risk of Postoperative Atrial Fibrillation

Sandro Ninni et al. J Am Coll Cardiol. .

Abstract

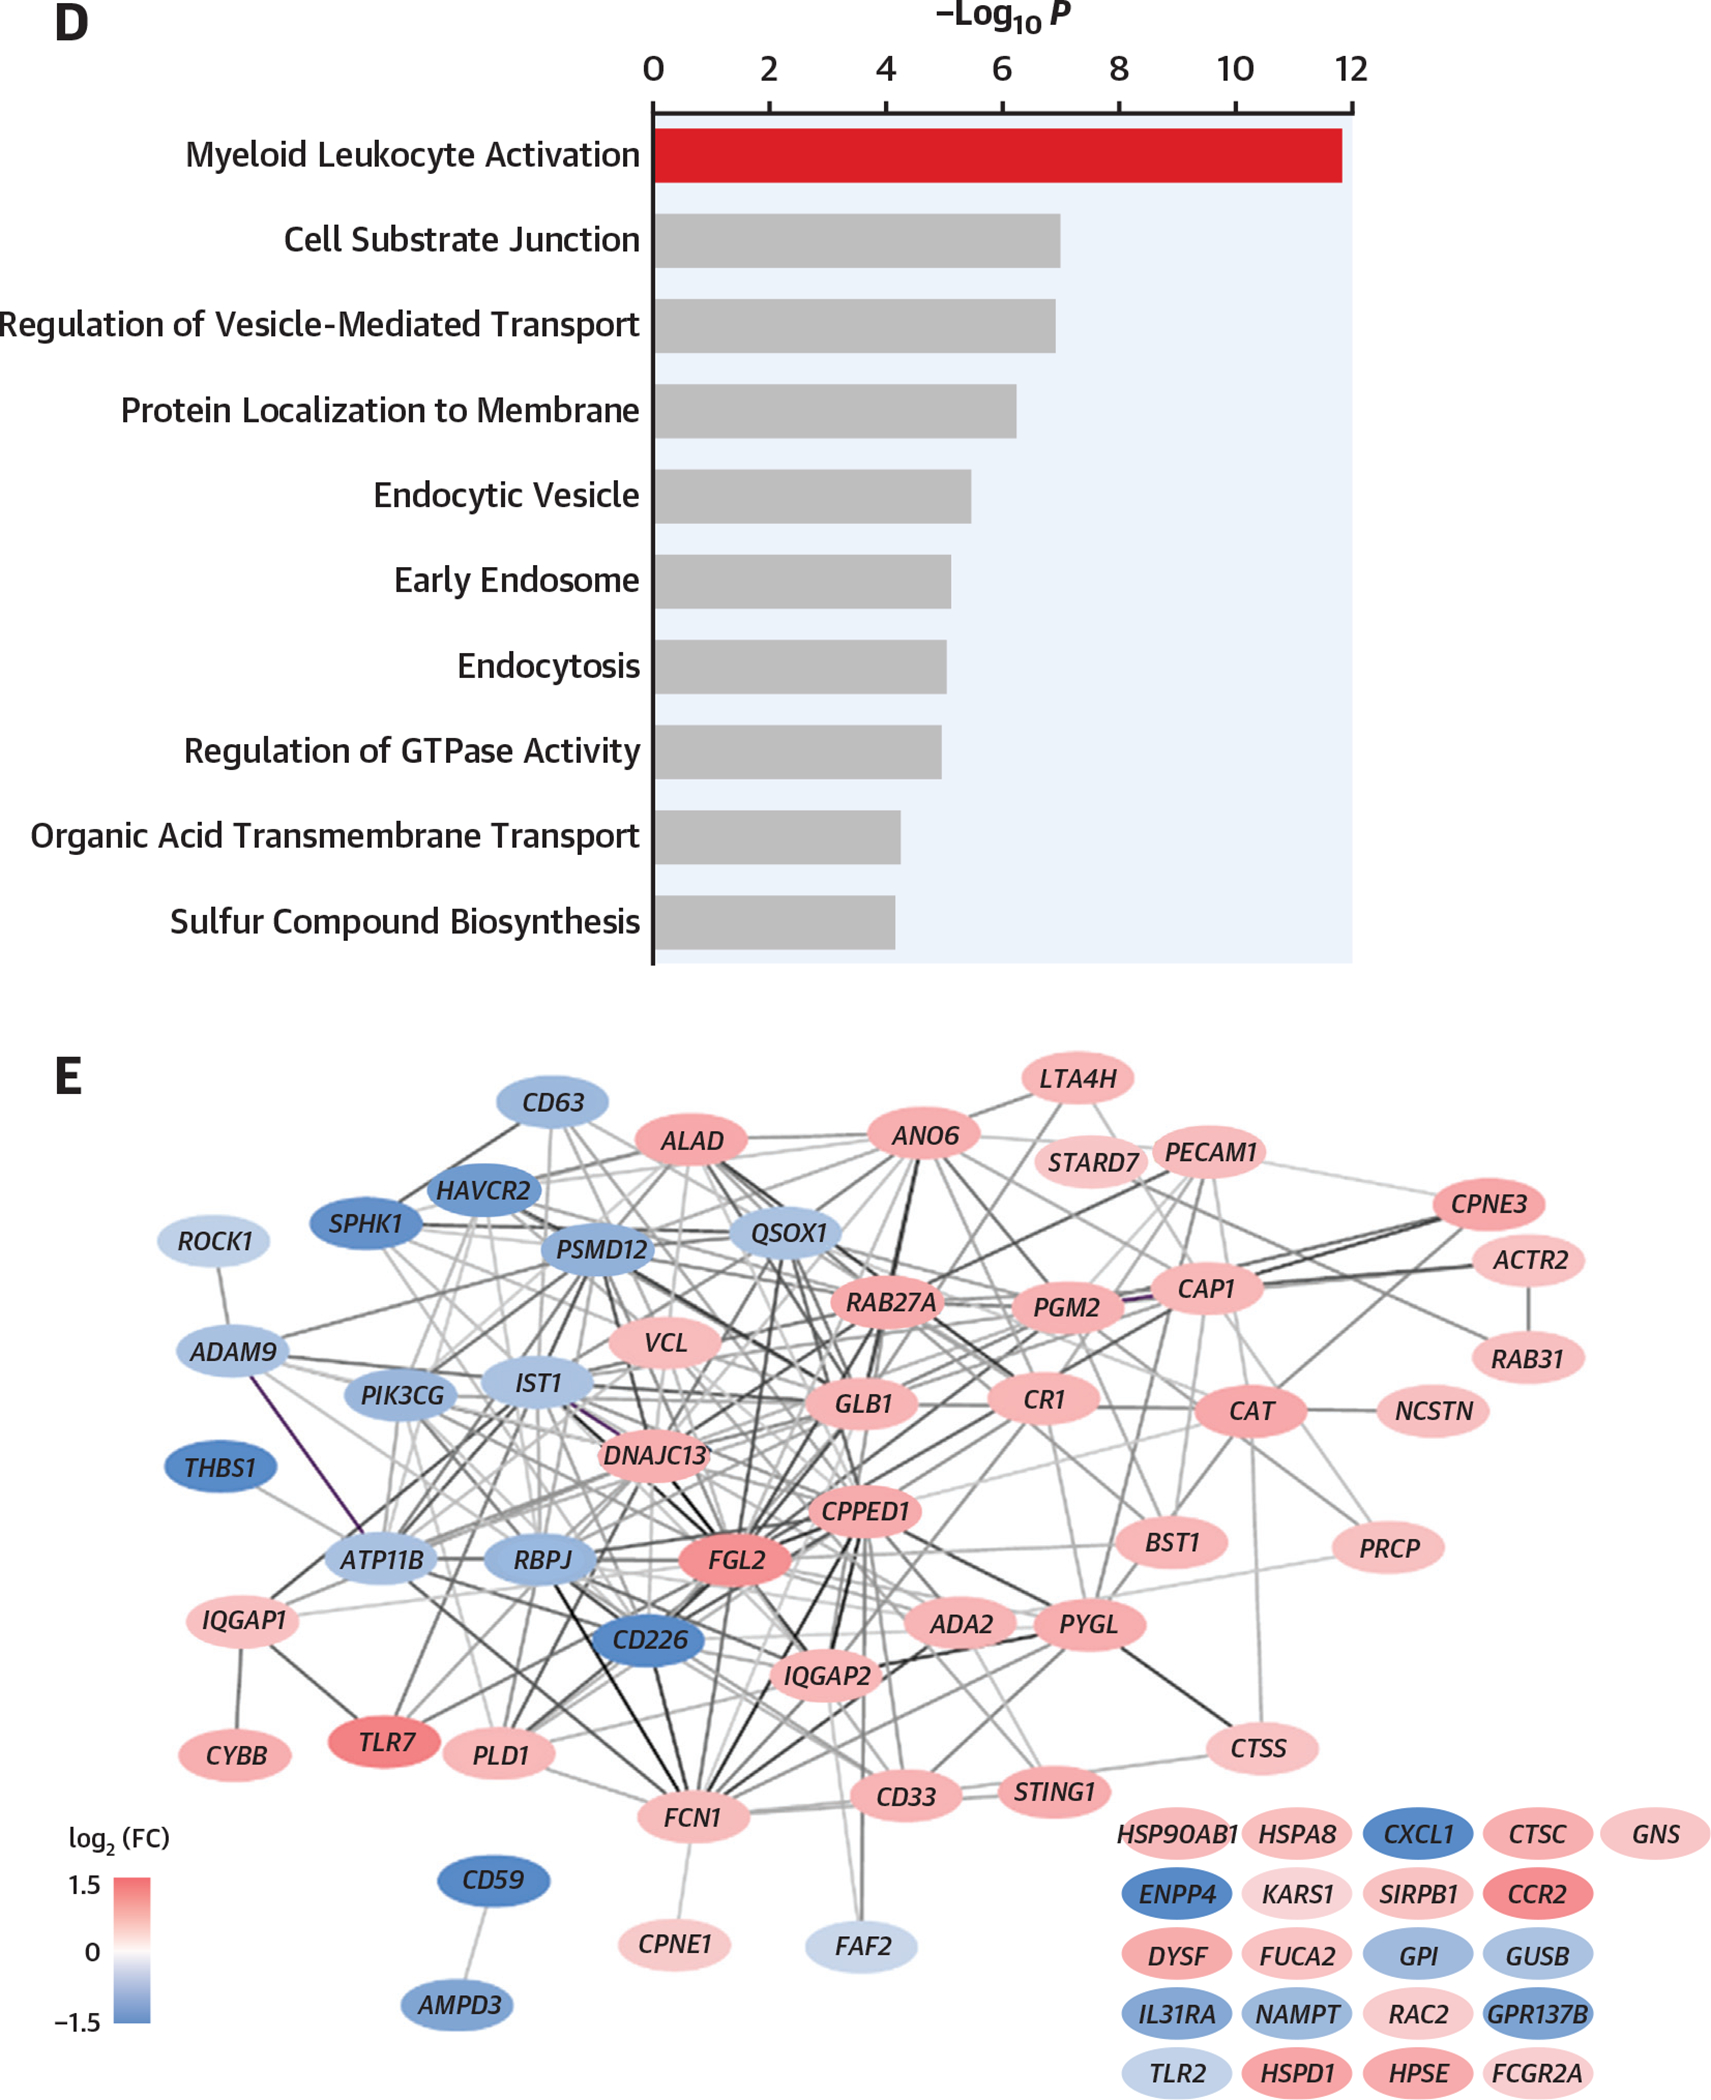
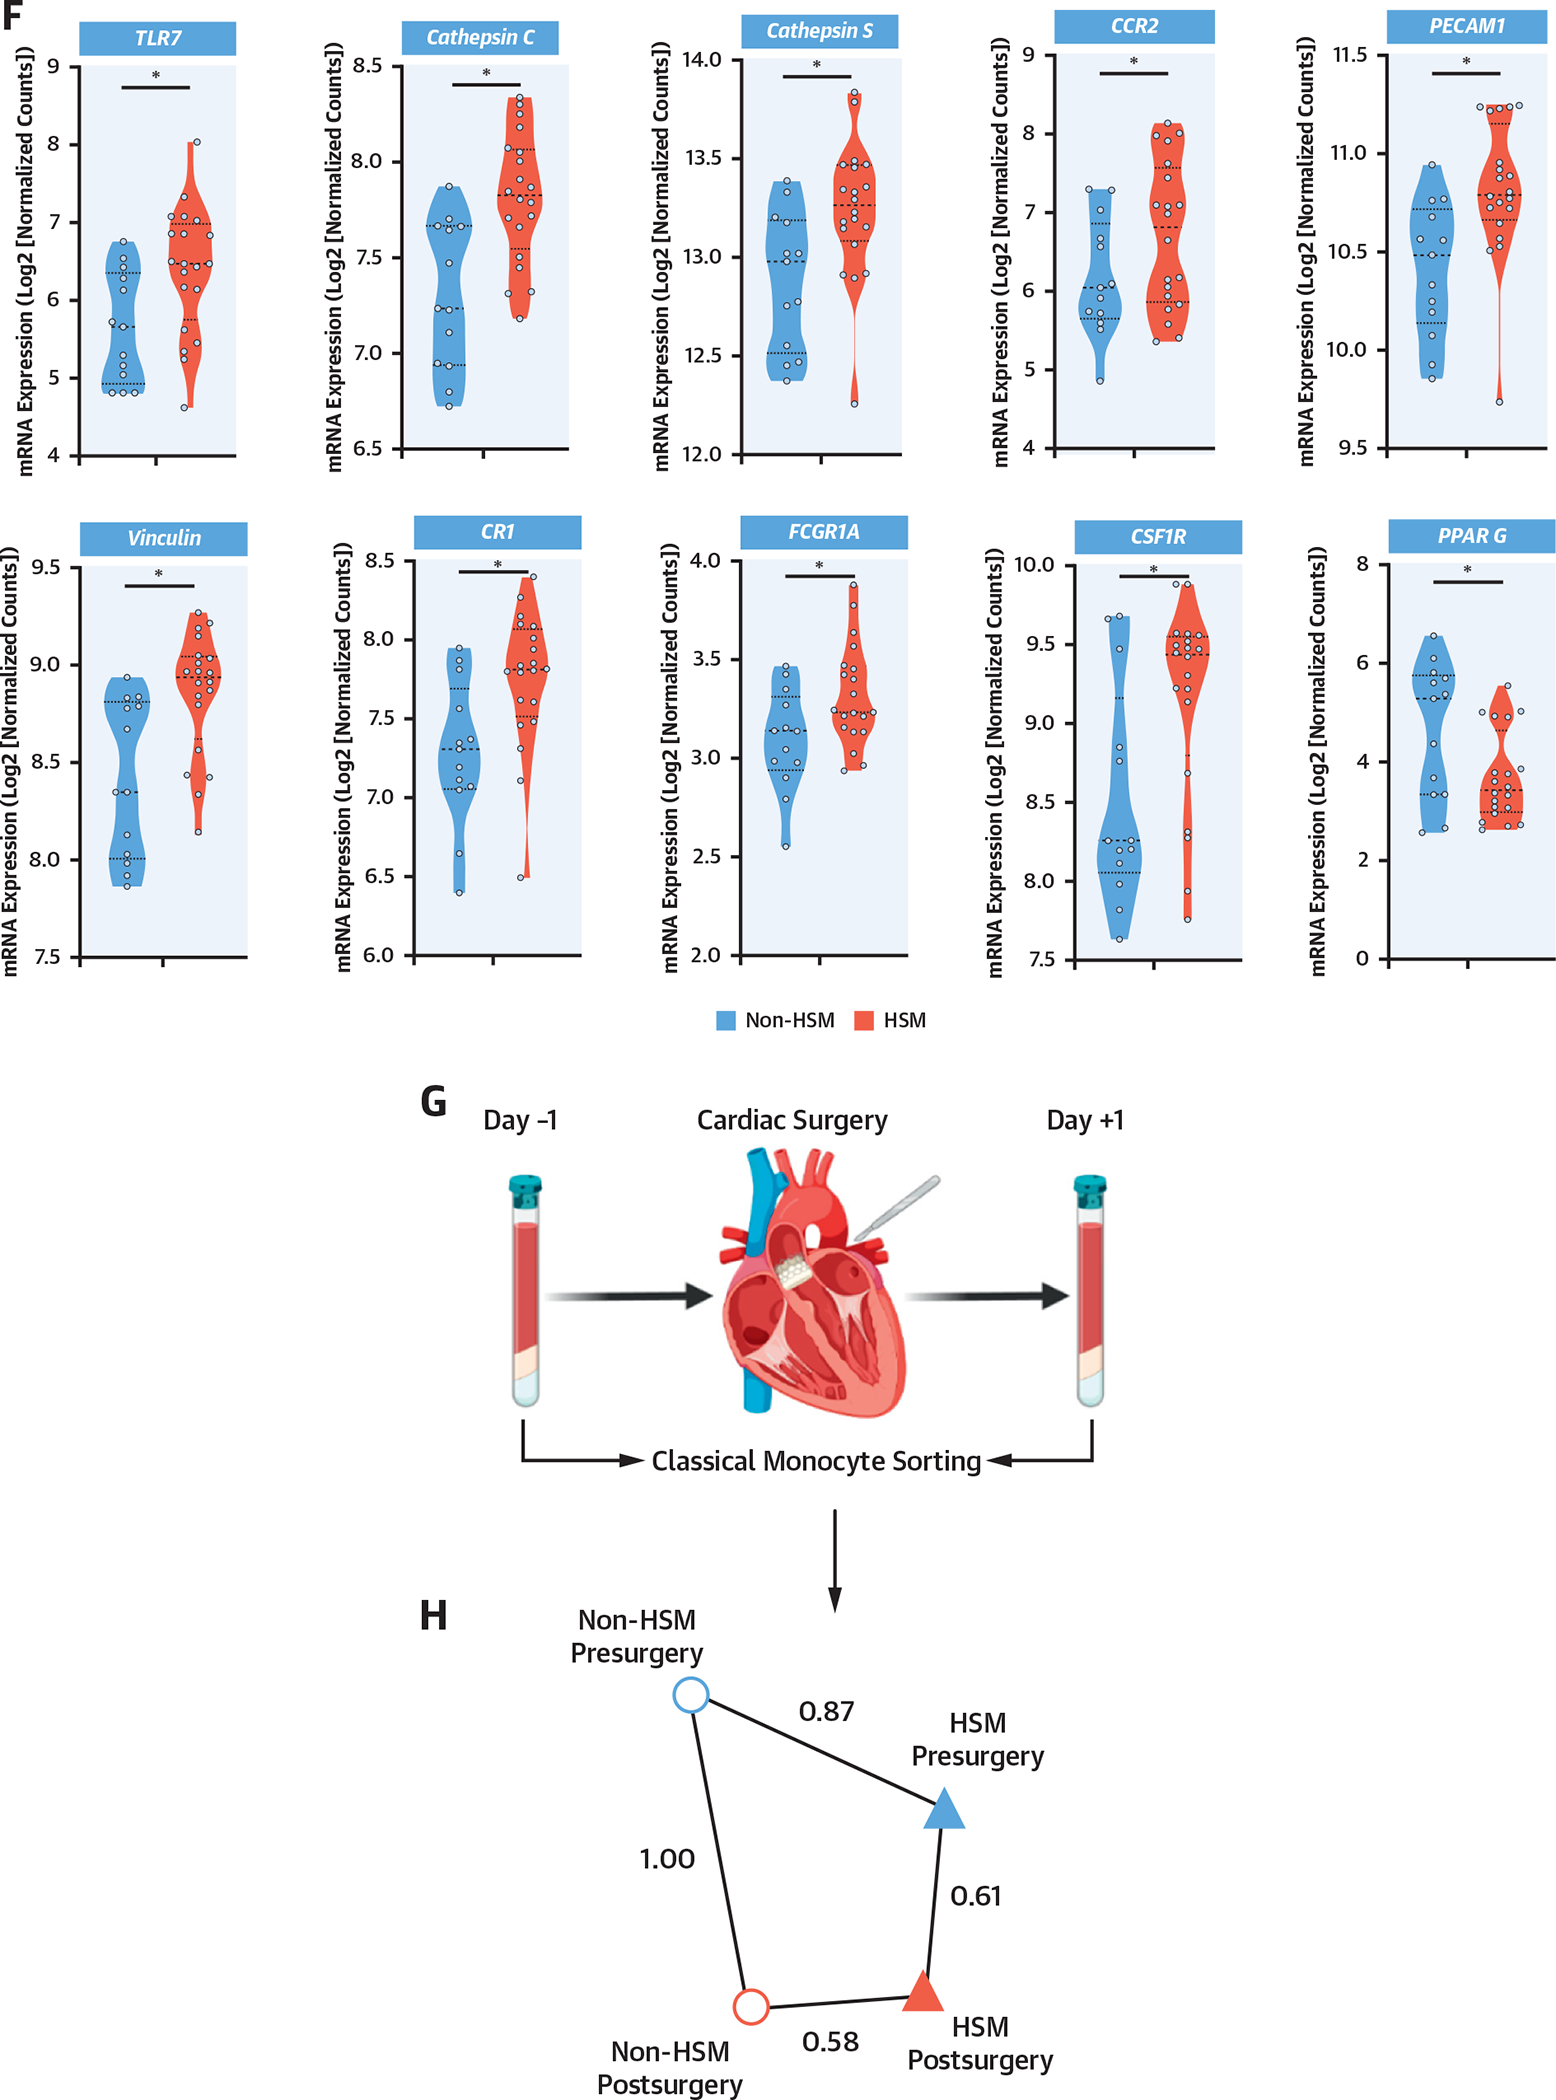
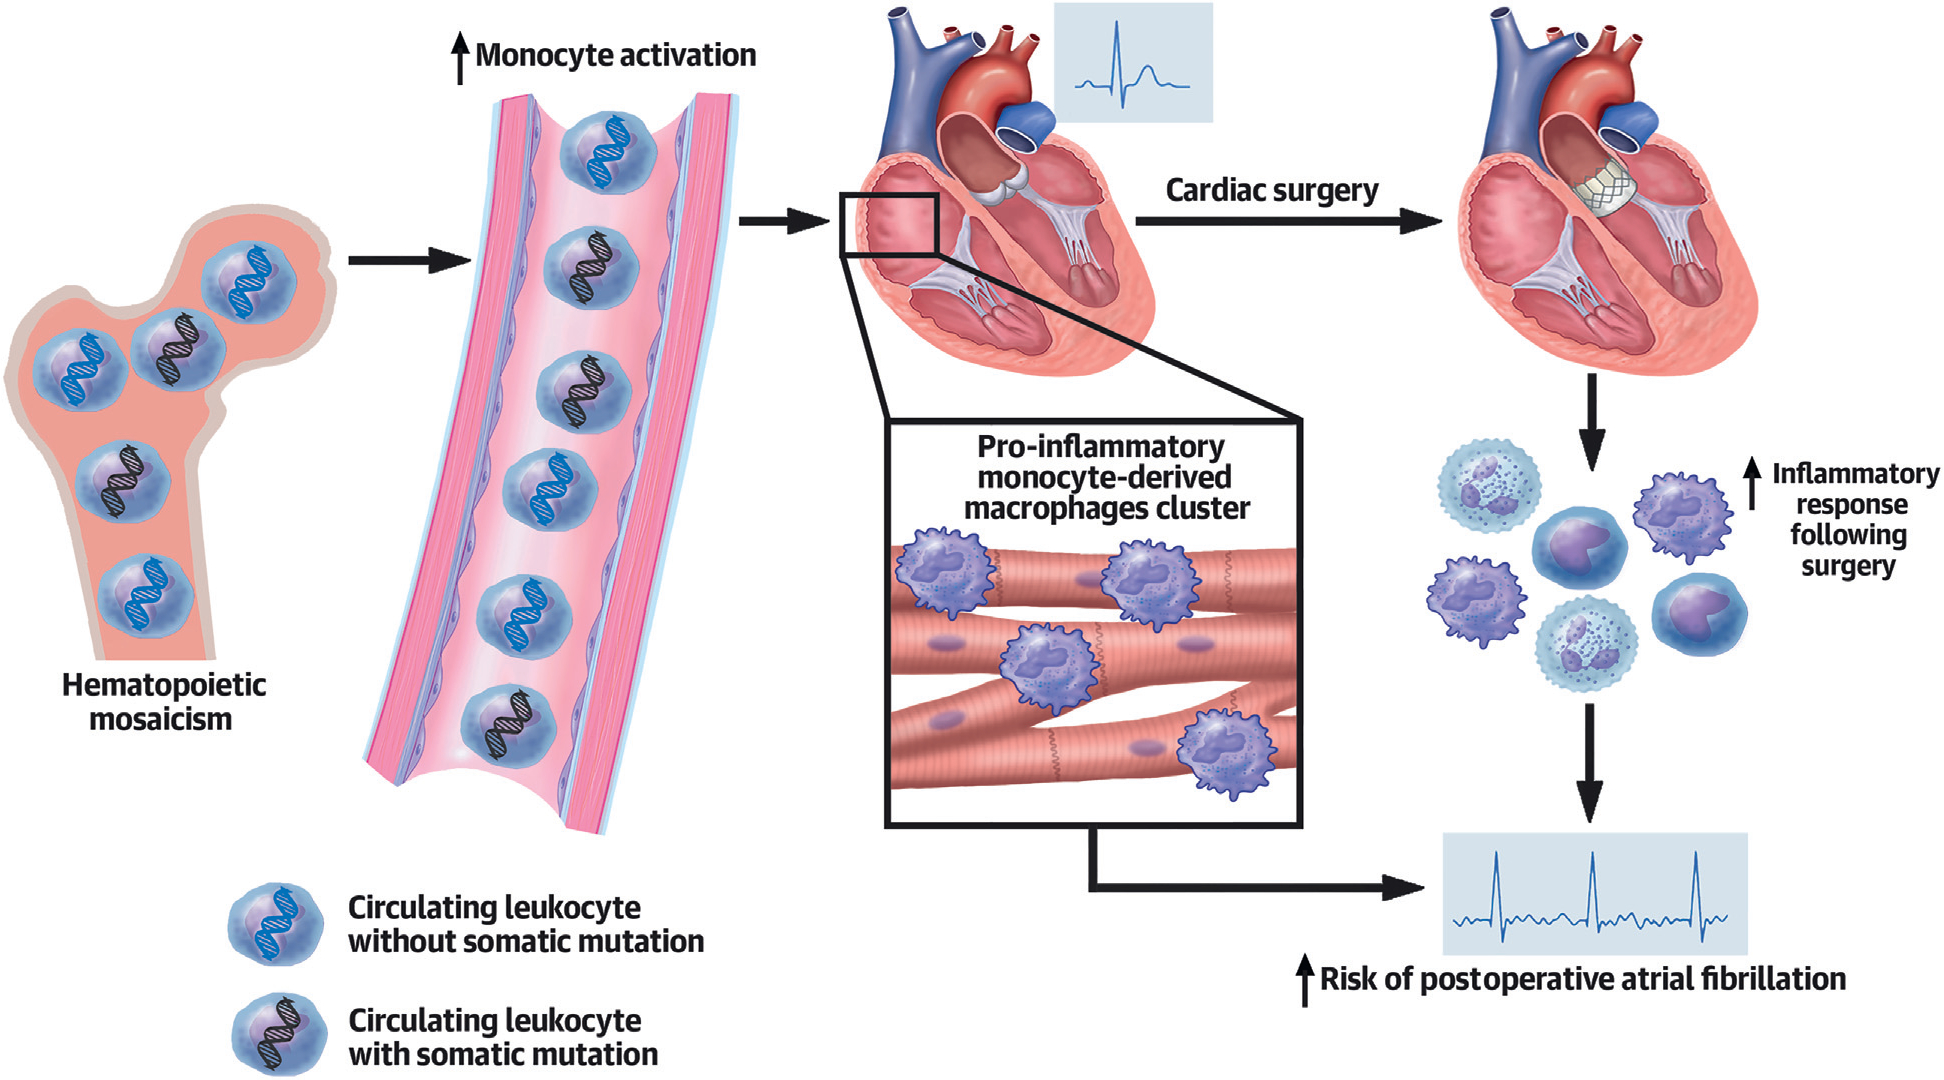
Background: On-pump cardiac surgery triggers sterile inflammation and postoperative complications such as postoperative atrial fibrillation (POAF). Hematopoietic somatic mosaicism (HSM) is a recently identified risk factor for cardiovascular diseases and results in a shift toward a chronic proinflammatory monocyte transcriptome and phenotype.

Objectives: The aim of this study was to assess the prevalence, characteristics, and impact of HSM on preoperative blood and myocardial myeloid cells as well as on outcomes after cardiac surgery.

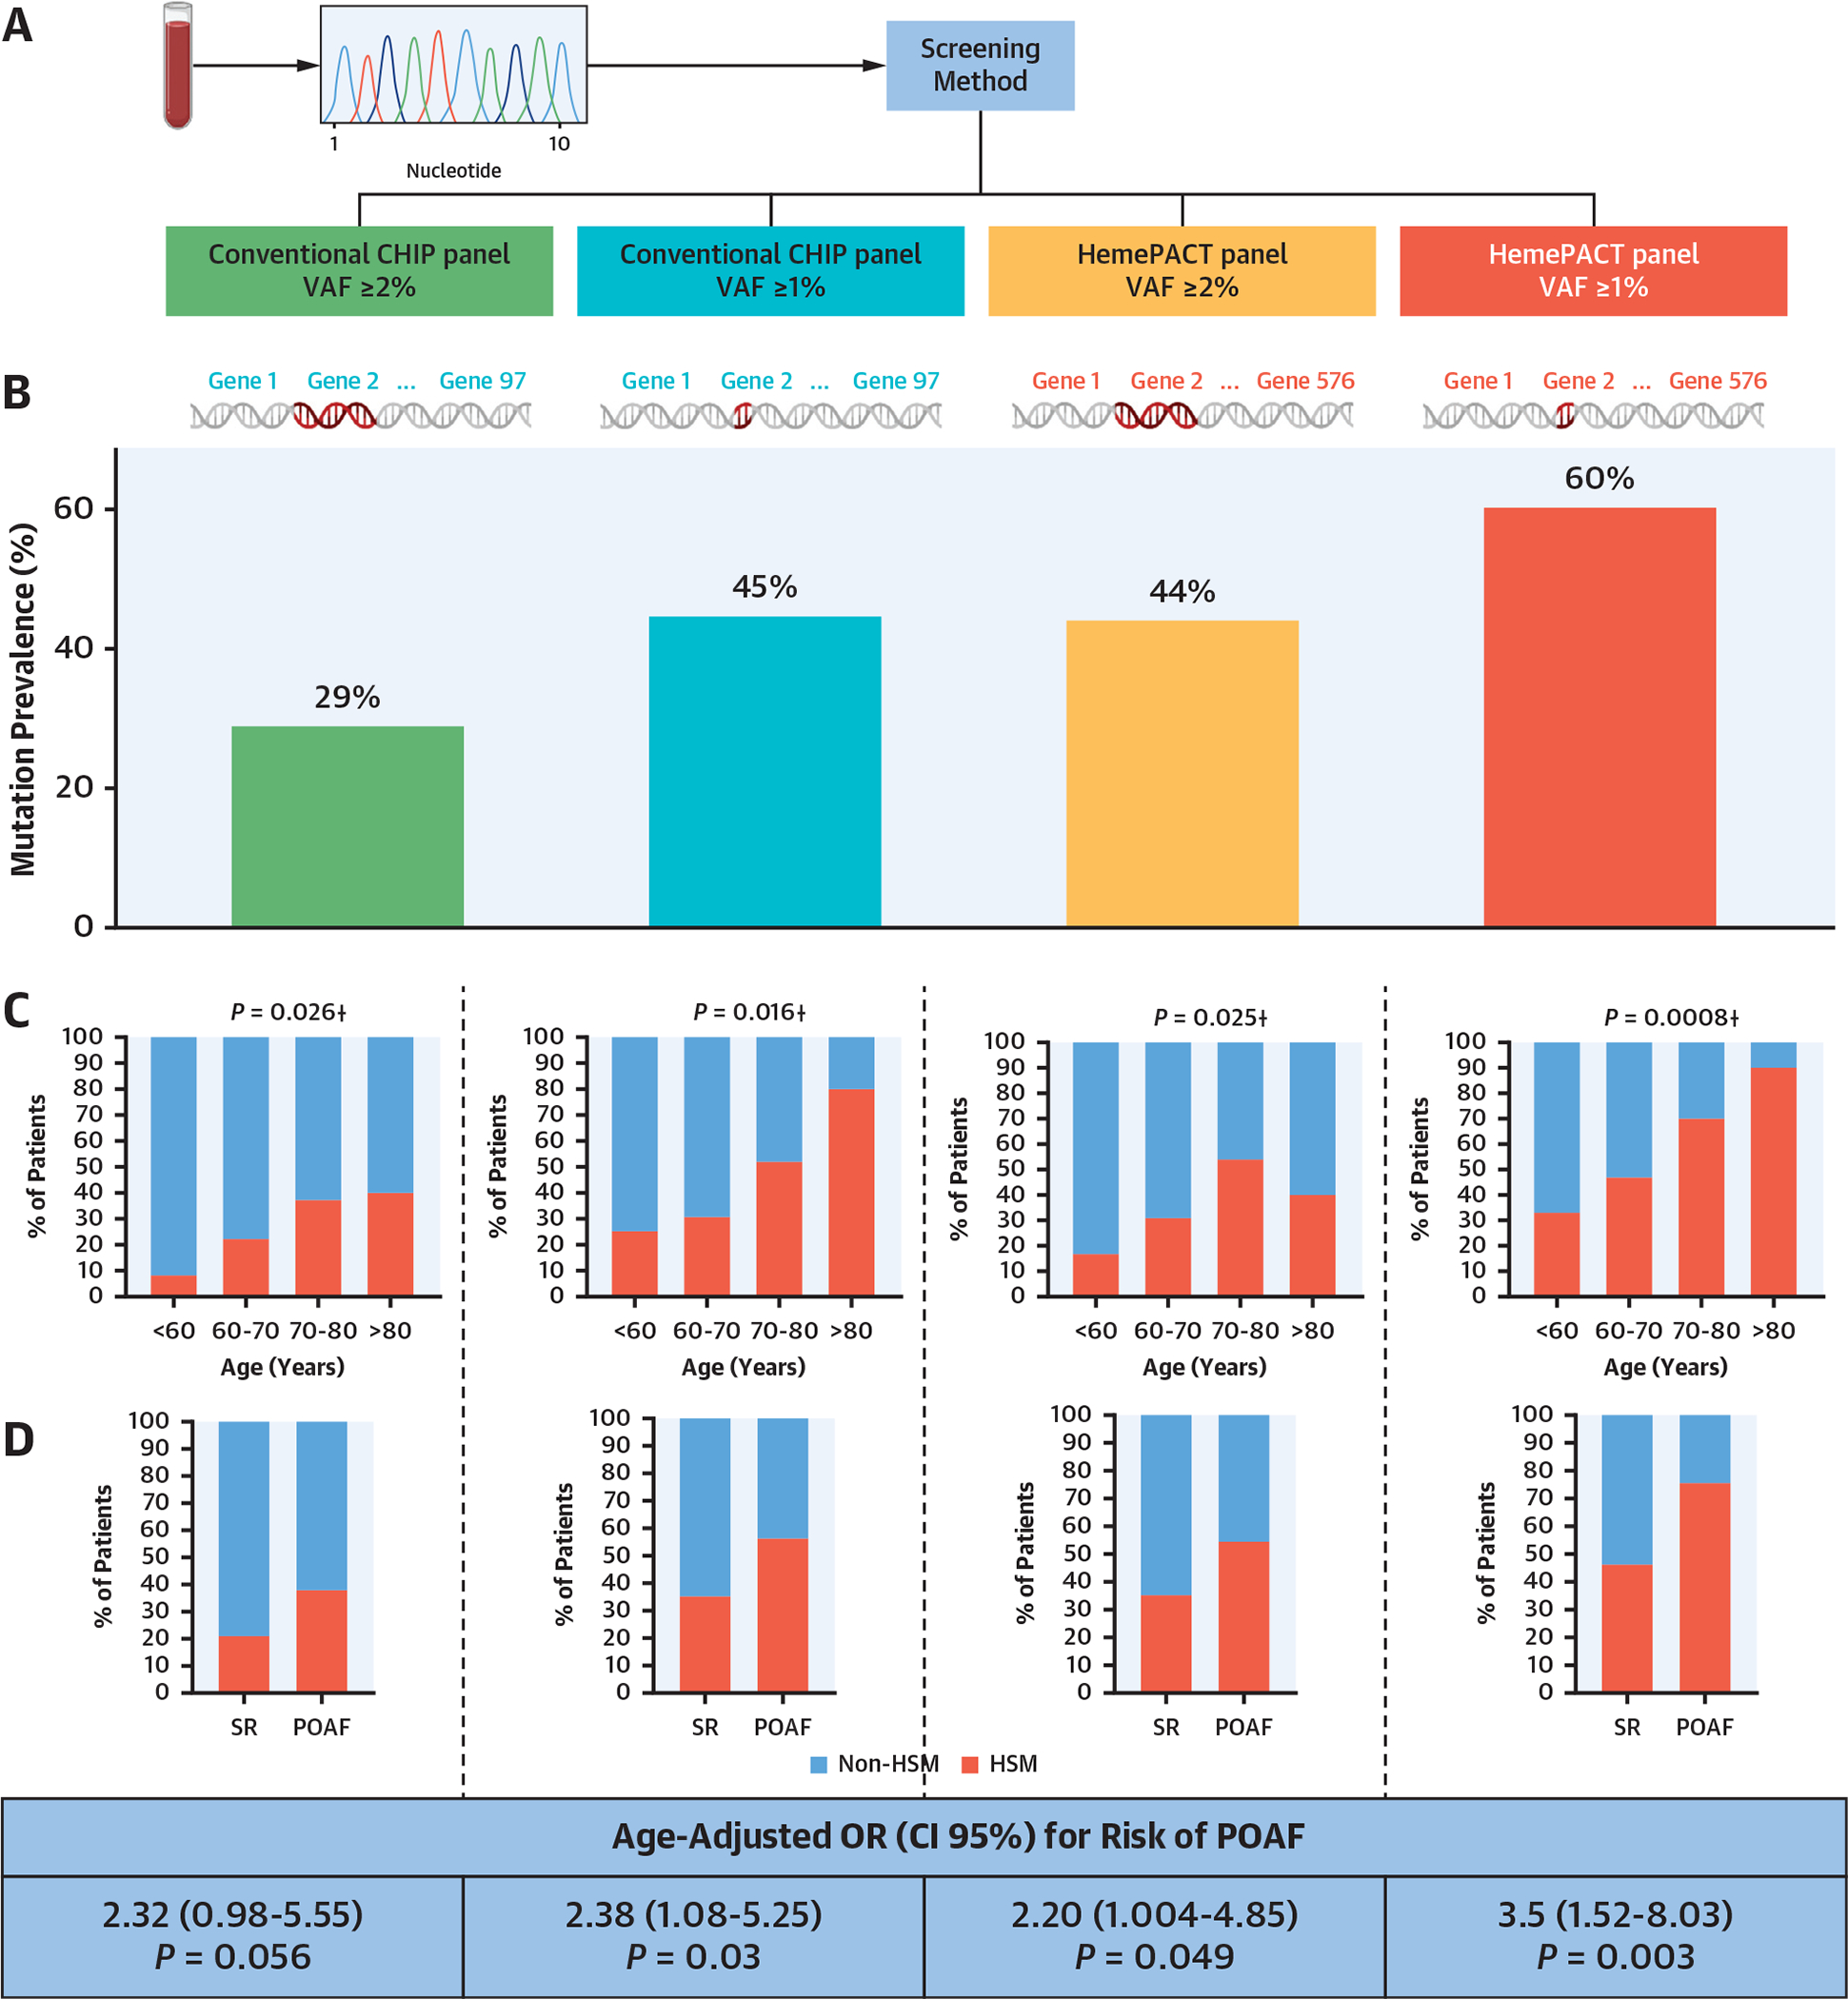
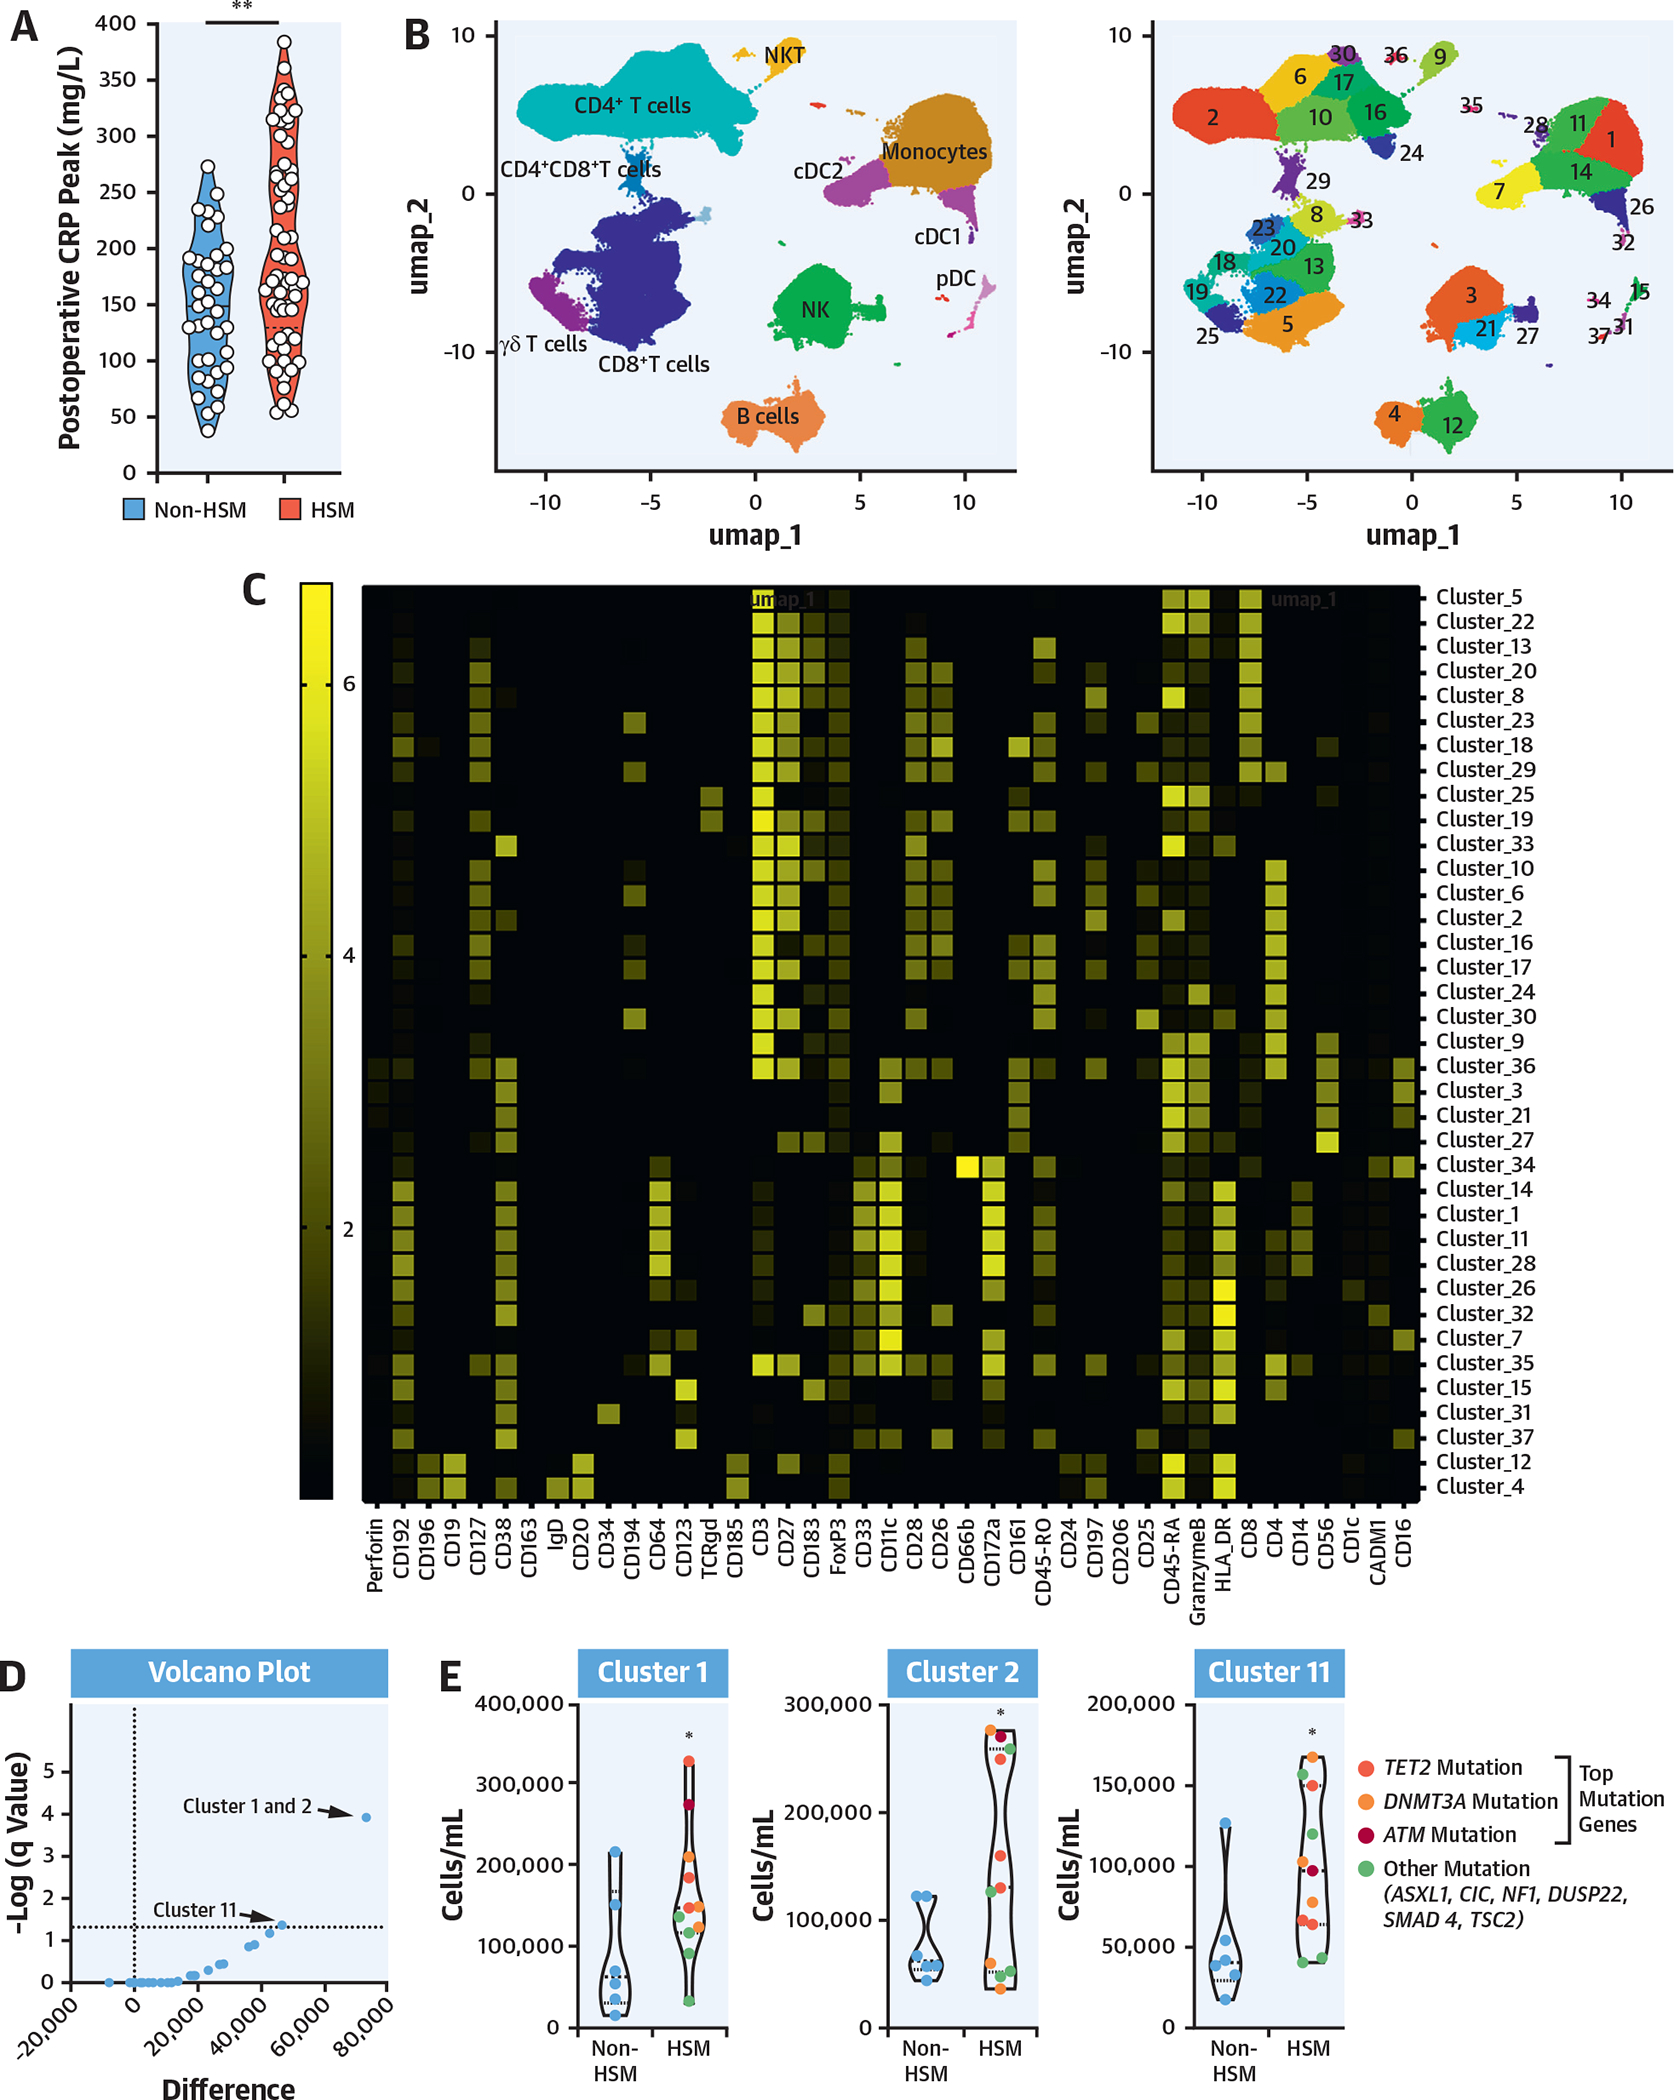
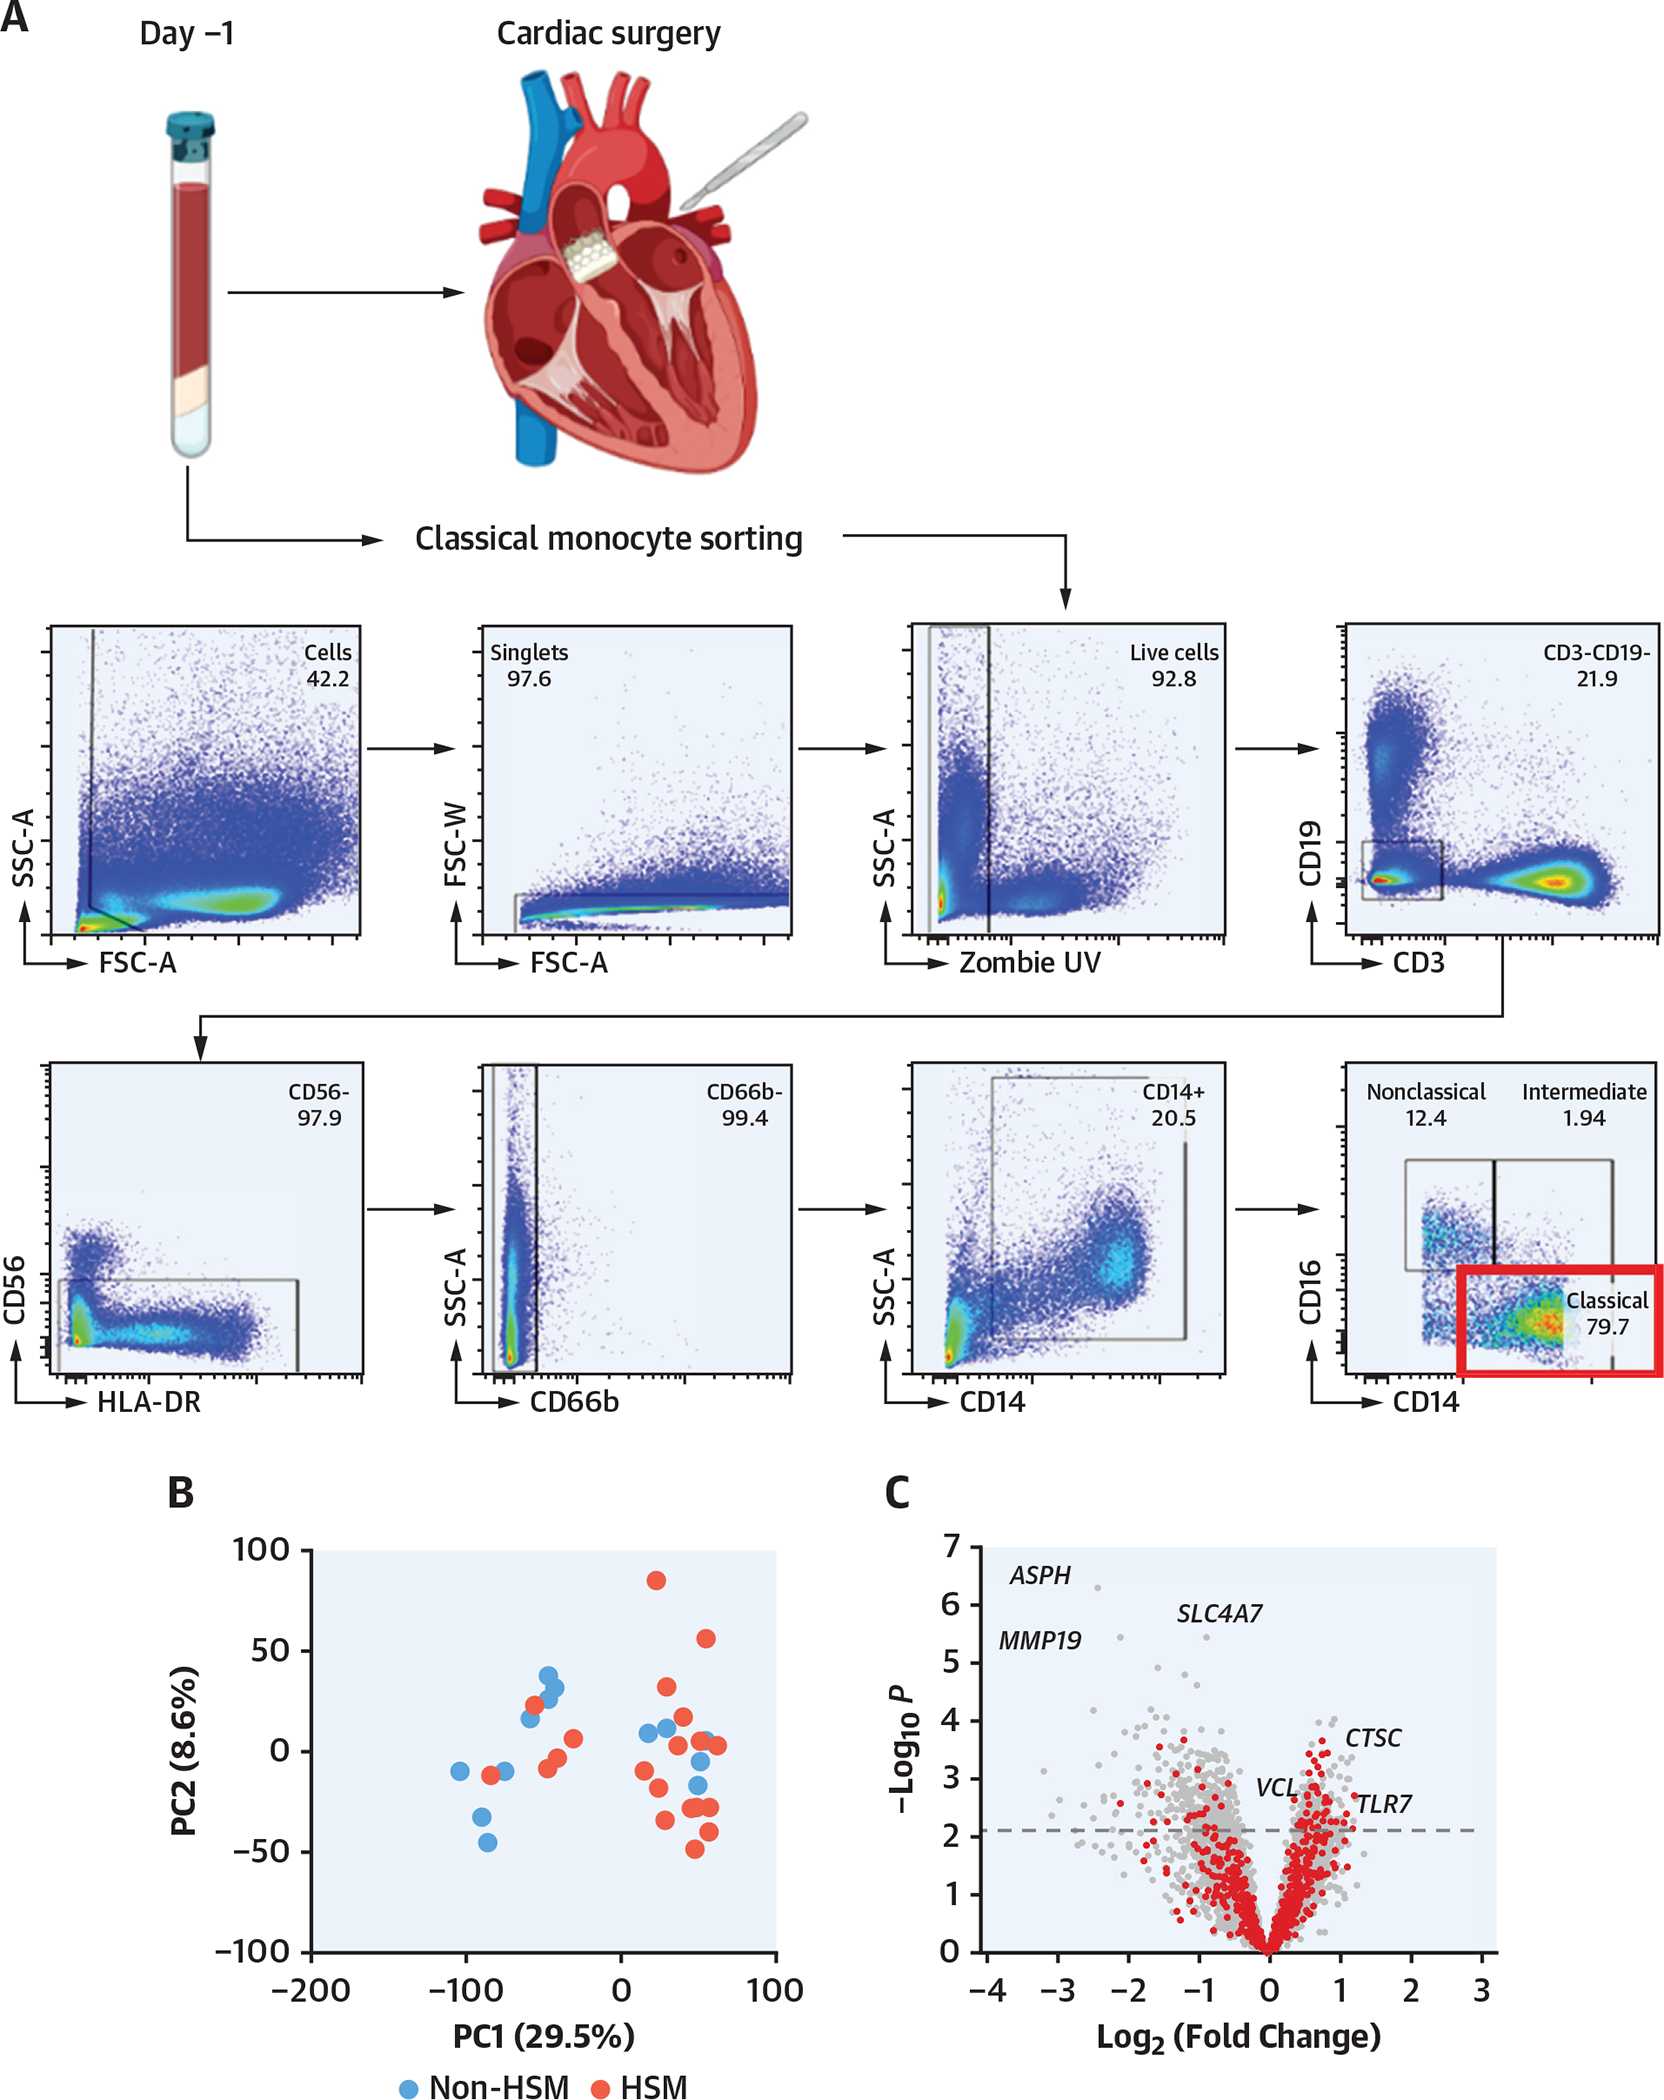
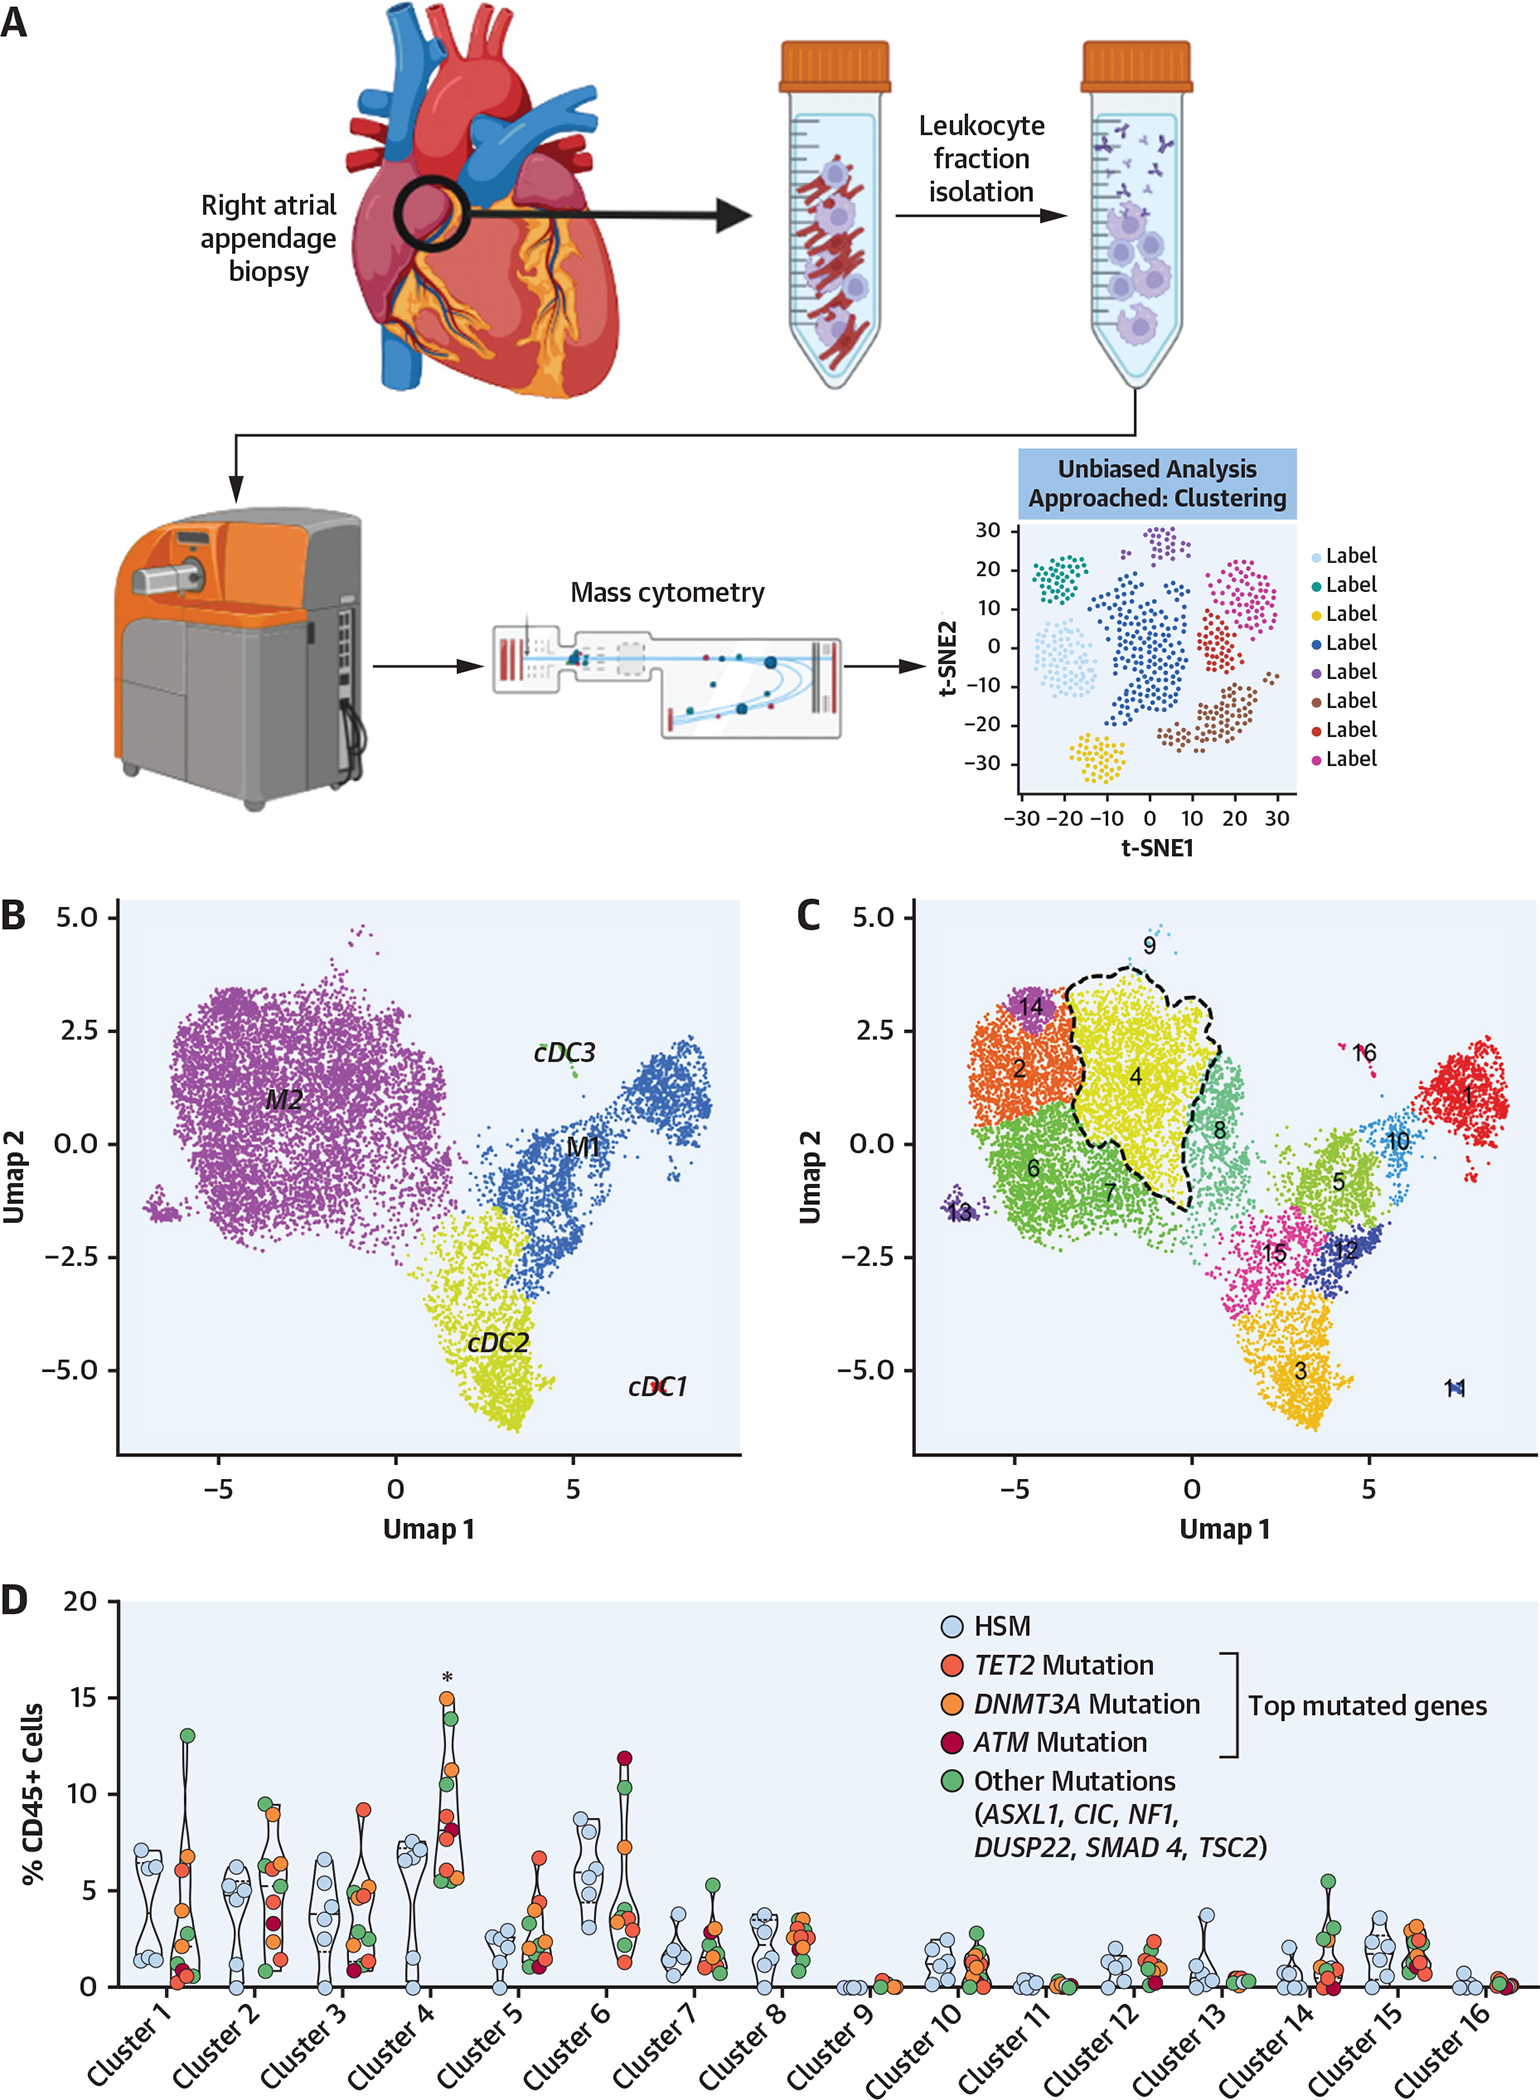
Methods: Blood DNA from 104 patients referred for surgical aortic valve replacement (AVR) was genotyped using the HemePACT panel (576 genes). Four screening methods were applied to assess HSM, and postoperative outcomes were explored. In-depth blood and myocardial leukocyte phenotyping was performed in selected patients using mass cytometry and preoperative and postoperative RNA sequencing analysis of classical monocytes.

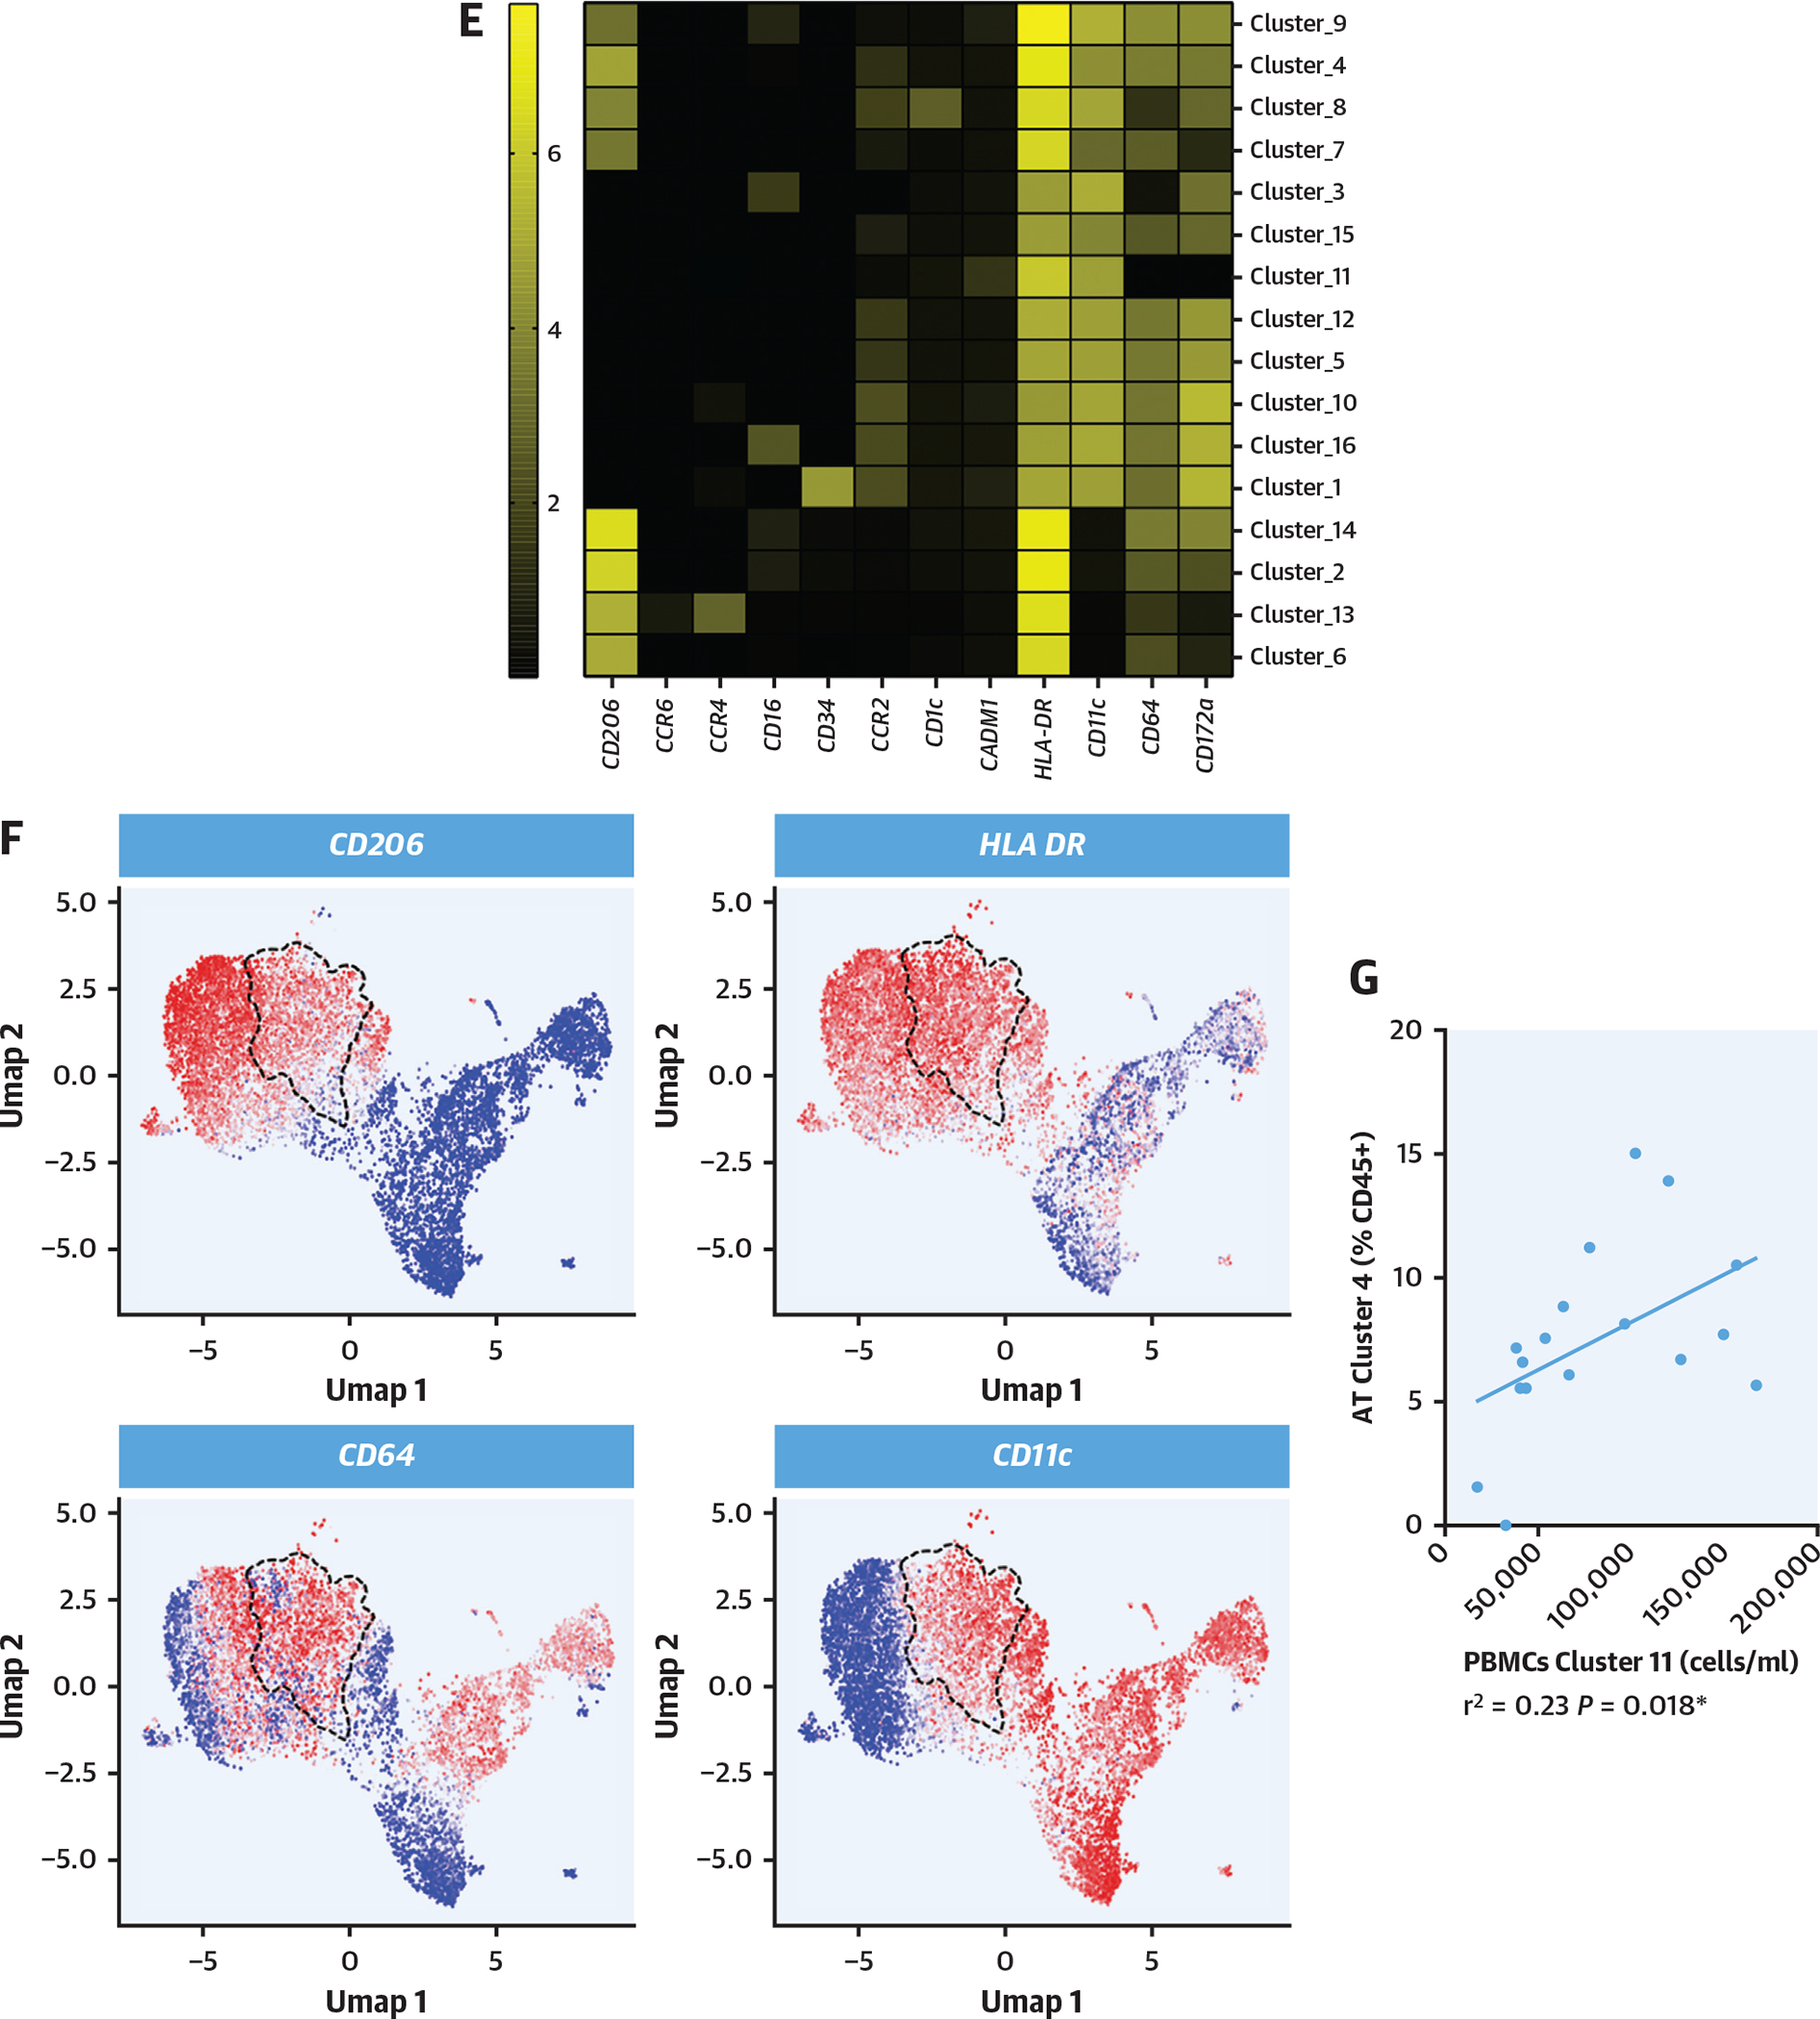
Results: The prevalence of HSM in the patient cohort ranged from 29%, when considering the conventional HSM panel (97 genes) with variant allelic frequencies ≥2%, to 60% when considering the full HemePACT panel and variant allelic frequencies ≥1%. Three of 4 explored HSM definitions were significantly associated with higher risk for POAF. On the basis of the most inclusive definition, HSM carriers exhibited a 3.5-fold higher risk for POAF (age-adjusted OR: 3.5; 95% CI: 1.52-8.03; P = 0.003) and an exaggerated inflammatory response following AVR. HSM carriers presented higher levels of activated CD64+CD14+CD16- circulating monocytes and inflammatory monocyte-derived macrophages in presurgery myocardium.

Conclusions: HSM is frequent in candidates for AVR, is associated with an enrichment of proinflammatory cardiac monocyte-derived macrophages, and predisposes to a higher incidence of POAF. HSM assessment may be useful in the personalized management of patients in the perioperative period. (Post-Operative Myocardial Incident & Atrial Fibrillation [POMI-AF]; NCT03376165).

Keywords: cardiac surgery; clonal hematopoiesis; inflammation; postoperative atrial fibrillation; somatic mosaicism.


Conflict of interest statement

Funding Support and Author Disclosures This study was supported by grants from Fédération Française de Cardiologie, Fondation Leducq convention 16CVD01 (“Defining and Targeting Epigenetic Pathways in Monocytes and Macrophages That Contribute to Cardiovascular Disease”), the European Genomic Institute for Diabetes (ANR-10-LABX-0046), Fondation Pour la Recherche Médicale (REFERENCE PROJET EQU202203014650), and Agence Nationale de la Recherche (TOMIS leukocytes: ANR-CE14-0003-01). Dr Staels is a recipient of an Advanced European Research Council Grant (694717). Dr Vicario was supported by the 2018 American Association for Cancer Research–Bristol Myers Squibb Fellowship for Young Investigators in Translational Immuno-Oncology. Work at the Memorial Sloan Kettering Cancer Center (MSKCC) is supported by an MSKCC core grant (P30 CA008748), National Institutes of Health grants 1R01NS115715-01, 1 R01 HL138090-01, and 1 R01 AI130345-01, Basic and Translational Immunology Grants from the Ludwig Center for Cancer Immunotherapy to Dr Geissmann. Dr de Winther is funded by grants from the Netherlands Heart Foundation (CVON: GENIUS2) and the Netherlands Heart Foundation and Spark-Holding (2019B016). Dr Neele is a Dekker fellow of the Netherlands Heart Foundation (2020T029). Dr White is founder and owner of Resphera Biosciences. Dr Geissmann has performed consulting for Third Rock Ventures. Dr Fragkogianni is employed by Tempus Labs. All other authors have reported that they have no relationships relevant to the contents of this paper to disclose.

Figures

FIGURE 1
FIGURE 1. Prevalence of HSM According to Screening Strategies and Association With POAF
(A) Four screening strategies were applied to detect hematopoietic mosaicism (HSM): conventional clonal hematopoiesis of indeterminate potential (CHIP) panel with variant allelic frequency (VAF) ≥2%, conventional CHIP panel with VAF ≥1%, HemePACT panel with VAF ≥2%, and HemePACT panel with VAF ≥1%. (B) Prevalence of HSM according to each screening method. (C) Prevalence of HSM according to age and screening method. †Chi-square for trend. (D) Association between postoperative atrial fibrillation (POAF) and HSM according to screening method. (E) Proportion of patients with multiple mutation among mutation carriers. (F) Venn diagram showing the mutated genes in patients in sinus rhythm (SR) and those with POAF. Numbers in parentheses indicate the number of patients carrying at least 1 mutation for each gene. For genes mutated in both patients in SR and those with POAF, numbers in parentheses are the number of patients in SR carrying at least 1 mutation and the number of patients with POAF carrying at least 1 mutation for each gene.
FIGURE 2
FIGURE 2. Postoperative Inflammatory Response and Preoperative High-Dimensional Peripheral Blood Mononuclear Cells Immune Phenotype
(A) Postoperative C-reactive protein (CRP) peak (within 72 hours) according to hematopoietic mosaicism (HSM). (B) Unsupervised clustering map of peripheral blood mononuclear cells with general populations and 37 individual clusters. (C) Heatmap representing characteristics of each identified cluster regarding the intensity of expression of each marker. (D) Volcano plot representing differences in each cluster according to HSM status. (E) Violin plots representing significantly dysregulated clusters according to HSM. Cluster 1: 62,432 (IQR: 30,600–168,688) cells/mL for non-HSM vs 148,535 (IQR: 117,895–211,597) cells/mL for HSM (false discovery rate [FDR] < 0.001); cluster 2: 62,197 (IQR: 54,074–122,329) cells/mL for non-HSM vs 130,048 (IQR: 52,188–259,142) cells/mL for HSM (FDR < 0.001); cluster 11: 39,904 (IQR: 28,766–71,982) cells/mL for non-HSM vs 96,683 (IQR: 63,700–149,464) cells/mL for HSM (FDR = 0.04). HSM was defined according to the HemePACT panel with variant allelic frequency ≥1%.
FIGURE 3
FIGURE 3. Preoperative Transcriptome Phenotype of Peripheral Blood Monocytes
(A) Classical monocyte sorting. (B) Principal component analysis (PCA) plot, using log-normalized expression values of the 10,000 top-expressing genes. (C) Volcano plot of the 10,000 top-expressing genes. “Myeloid leukocyte activation” genes are in red. Dashed line indicates FDR of 0.1. (D) Biological process terms most affected by HSM, as ranked by consensus P value. Terms with more than 75% of member genes in the set of 10,000 most expressed genes were considered. (E) Correlation network of the top 70 significant genes in “myeloid leukocyte activation” term. Edges connect genes whose partial correlation adjusted for HSM has Pearson’s r > 0.8. (F) Violin plots of selected genes: TLR7 (P = 0.002; FDR = 0.07; log2 fold change [FC] = 1.22), cathepsin C (P = 0.0002; FDR = 0.059; log2 FC = 0.77), cathepsin S (P = 0.004; FDR = 0.09; log2 FC = 0.56), CCR2 (P = 0.01; FDR = 0.11; log2 FC = 1.09), PECAM1 (P = 0.001; FDR = 0.07; log2 FC = 0.62), vinculin (P = 0.001, FDR = 0.07, log2 FC = 0.63), CR1 (P = 0.004; FDR = 0.09; log2 FC = 0.70), CSF1R (P = 0.009, FDR = 0.11, log2 FC = 0.85), FCGR1A (P = 0.02, log2 FC = 0.58), PPAR G (P = 0.003, FDR = 0.08; log2 FC = −2.12). *Indicates P value <0.05. (G) Surgery-induced transcriptome explored in peripheral blood mononuclear cells obtained before and 48 hours after surgery. (H) Euclidian distance extrapolated from PCA between transcriptome status of patients with HSM and those without HSM, before and after surgery. FSC-A = forward scatter area; FSC-W = forward scatter width; GTPase = guanosine triphosphatase; mRNA = messenger RNA; PC = principal component; SSC-A = side scatter area; SSC-H = side scatter area; other abbreviations as in Figures 1 and 2.
FIGURE 4
FIGURE 4. Myocardial Immune Phenotype According to HSM Status
(A) Right appendage biopsies were collected from 17 patients, and leukocyte fraction was isolated and characterized using mass cytometry with unbiased approach on the basis of clustering. (B, C) Unsupervised clustering map of myeloid cells with general populations (top) and16 clusters (bottom) reidentified. (D) Heatmap representing characteristics of each identified cluster regarding the intensity of each marker. (E) Violin plots representing the proportion of each cluster among the total CD45+ cells in myocardium according to HSM status. Computations assumed the same scatter for subsets (*cluster 4: 4.9% ± 3.2% vs 8.5% ± 3.4% of CD45+ cells, FDR < 0.001). (F) Relative expression of markers defining cluster 4 in the map. Dashed line represents cluster 4 on each map. (G) Correlation between atrial tissue (AT) cluster 4 and peripheral blood mononuclear cell (PBMC) cluster 11 (monocytes) up-regulated in patients with HSM. HSM was defined according to the HemePACT panel with VAF ≥1%. t-SNE = t-distributed stochastic neighbor embedding; Umap = uniform manifold approximation and projection; other abbreviations as in Figures 1 and 2.
CENTRAL ILLUSTRATION
CENTRAL ILLUSTRATION. Association Between Hematopoietic Mosaicism and Postoperative Atrial Fibrillation
Aging leads to accumulating postzygotic mutations in bone marrow hematopoietic stem cells. These mutations are associated with increased monocyte activation in peripheral blood and monocytes derived macrophages in myocardium. As a result of the surgery, an increased inflammatory response is observed in hematopoietic mosaicism (HSM) carriers. Such an increase in the inflammatory response, combined with myocardial macrophage infiltration, could lead to the increase in postoperative atrial fibrillation incidence observed in HSM carriers.

Comment in

References

    1. Englum BR, Ganapathi AM, Schechter MA, Harrison JK, Glower DD, Hughes GC. Changes in risk profile and outcomes of patients undergoing surgical aortic valve replacement from the pre- to post-transcatheter aortic valve replacement eras. Ann Thorac Surg. 2016;101:110–117. - PMC - PubMed
    1. Dobrev D, Aguilar M, Heijman J, Guichard J-B, Nattel S. Postoperative atrial fibrillation: mechanisms, manifestations and management. Nat Rev Cardiol. 2019;16:417–436. - PubMed
    1. Wang Y, Bellomo R. Cardiac surgery-associated acute kidney injury: risk factors, pathophysiology and treatment. Nat Rev Nephrol. 2017;13:697–711. - PubMed
    1. Wan S, Marchant A, DeSmet JM, et al. Human cytokine responses to cardiac transplantation and coronary artery bypass grafting. J Thorac Cardiovasc Surg. 1996;111:469–477. - PubMed
    1. Gong T, Liu L, Jiang W, Zhou R. DAMP-sensing receptors in sterile inflammation and inflammatory diseases. Nat Rev Immunol. 2020;20:95–112. - PubMed

Publication types

MeSH terms

Associated data

LinkOut - more resources