. 2023 Mar 29;14(1):1753.
doi: 10.1038/s41467-023-37408-w.

A-MYB and BRDT-dependent RNA Polymerase II pause release orchestrates transcriptional regulation in mammalian meiosis

Affiliations

A-MYB and BRDT-dependent RNA Polymerase II pause release orchestrates transcriptional regulation in mammalian meiosis

Adriana K Alexander et al. Nat Commun. .

Abstract

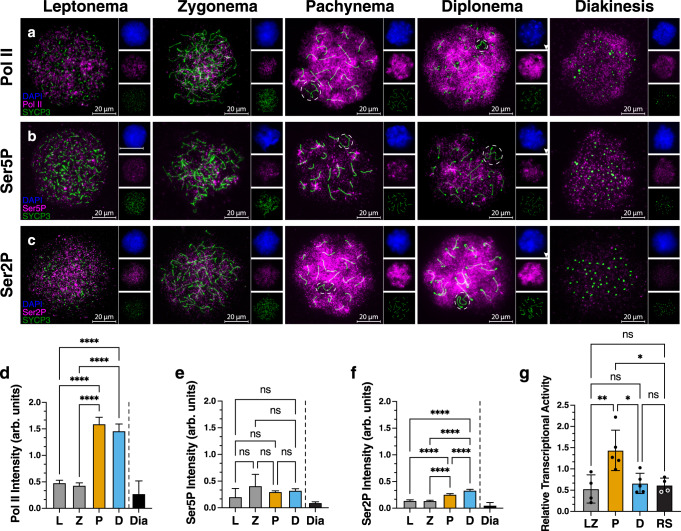
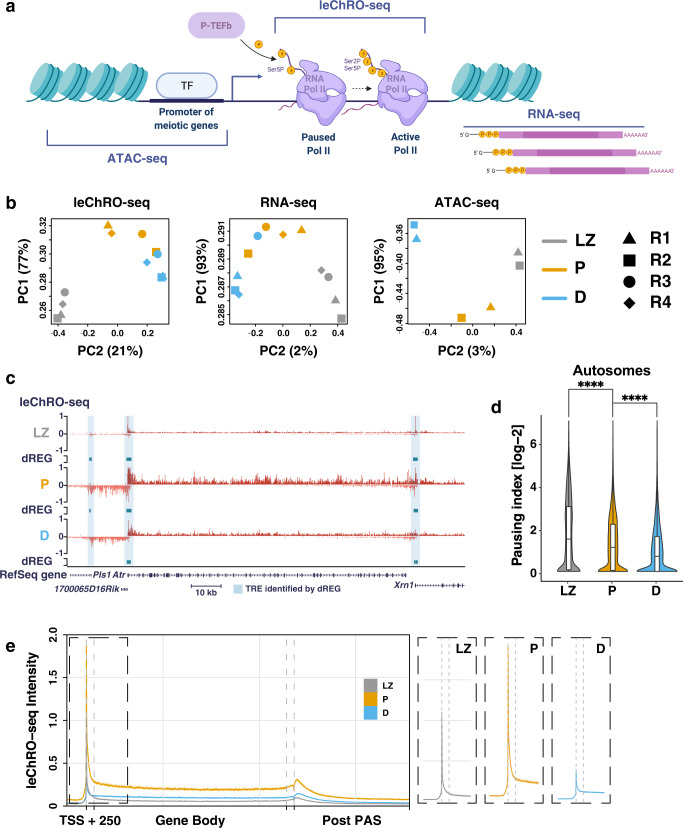
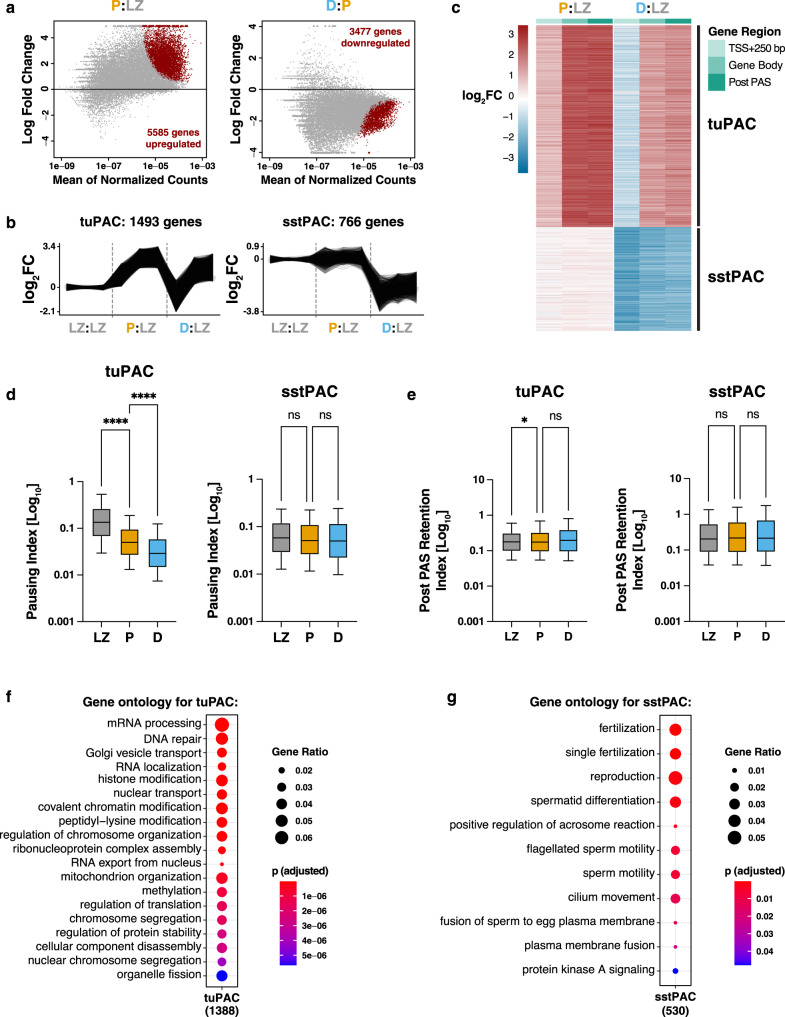
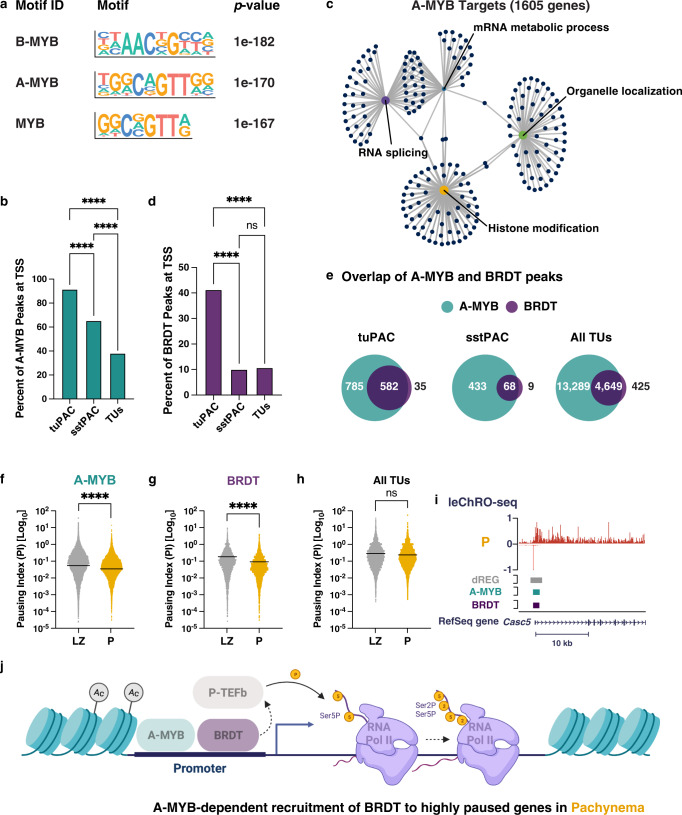
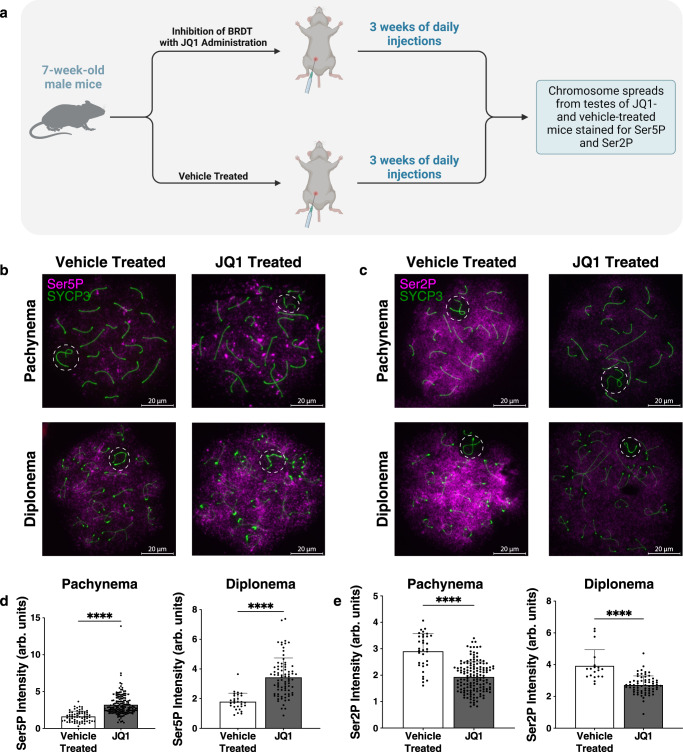
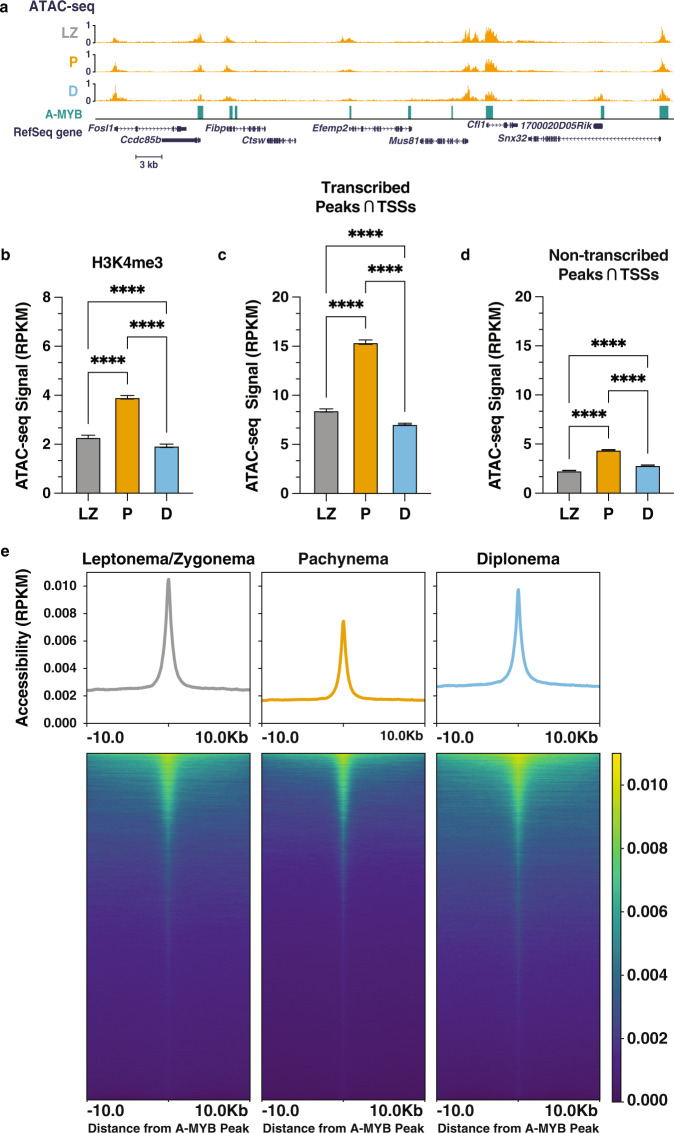
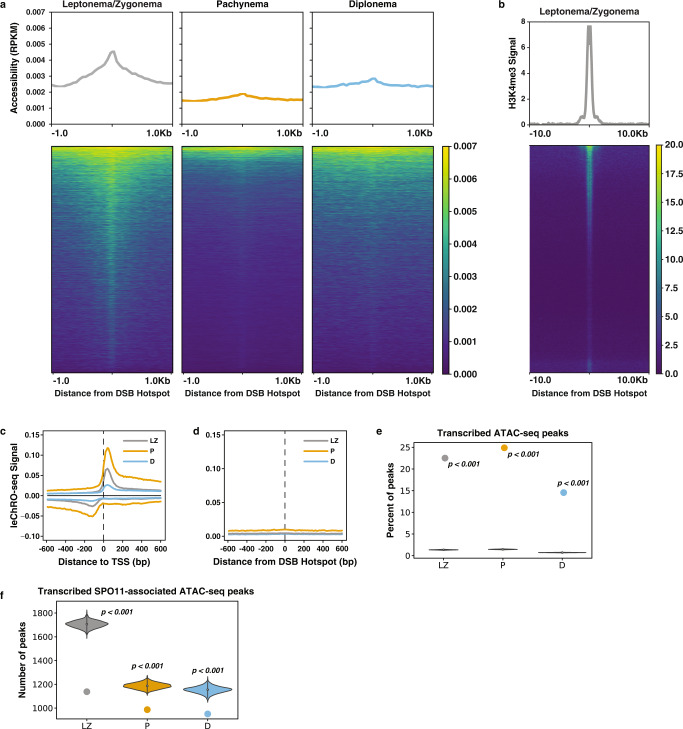
During meiotic prophase I, spermatocytes must balance transcriptional activation with homologous recombination and chromosome synapsis, biological processes requiring extensive changes to chromatin state. We explored the interplay between chromatin accessibility and transcription through prophase I of mammalian meiosis by measuring genome-wide patterns of chromatin accessibility, nascent transcription, and processed mRNA. We find that Pol II is loaded on chromatin and maintained in a paused state early during prophase I. In later stages, paused Pol II is released in a coordinated transcriptional burst mediated by the transcription factors A-MYB and BRDT, resulting in ~3-fold increase in transcription. Transcriptional activity is temporally and spatially segregated from key steps of meiotic recombination: double strand breaks show evidence of chromatin accessibility earlier during prophase I and at distinct loci from those undergoing transcriptional activation, despite shared chromatin marks. Our findings reveal mechanisms underlying chromatin specialization in either transcription or recombination in meiotic cells.


Conflict of interest statement

The authors declare no competing interests.

Figures

Fig. 1
Fig. 1. Transcriptionally active isoform of RNA polymerase II, Ser2P, is enriched in pachynema and diplonema.
ac Immunofluorescence staining on spread meiotic spermatocyte preparations from wild-type C57Bl/6 mice using antibodies against SYCP3 (green) and Pol II (a), Ser5P (b), and Ser2P (c) (magenta). Leptonema (L), zygonema (Z), pachynema (P), diplonema (D), and diakinesis (Dia) staged spermatocytes are defined by SYCP3 morphology. The X and Y chromosomes are outlined in white. Arb. units = arbitrary units. df Quantification of signal intensity for Pol II, Ser5P, and Ser2P immunofluorescence staining in wild-type spermatocytes. Average intensity is shown, and error bars represent 95% confidence intervals. Samples were obtained from three 3-month-old mice. Source data are provided as a Source data file. d n = 606 prophase I cells. e There was no significant difference in the fluorescence intensity of Ser5P between prophase I substages. n = 586 prophase I cells. f n = 677 prophase I cells. g Radioactive nuclear run-on results comparing the relative levels of nascent transcription between leptonema/zygonema (LZ), pachynema (P), diplonema (D), and round spermatids (RS). Average relative transcriptional activity is shown, and error bars represent standard deviation. Source data are provided as a Source data file. dg *p-value = 0.012, **p-value = 0.0056, ****p-value <0.0001, one-way ANOVA with the post hoc Tukey’s multiple comparison’s test.
Fig. 2
Fig. 2. leChRO-seq detects nascent transcription in prophase I spermatocytes.
a Schematic of key steps in the transcription cycle. The transcription start site (TSS) is labeled with an arrow; nucleosomes are depicted in teal; nascent RNA is shown in dark red; and mRNA is shaded in dark pink. ATAC-seq detects accessible regulatory elements, such as promoters and enhancers. leChRO-seq provides base pair resolution of engaged and active Pol II across the genome. RNA-seq profiles poly-adenylated mRNA transcripts. Created with BioRender.com. b Principal component analysis (PCA) plots showing variation between replicate sets of prophase I substages for leChRO-seq, RNA-seq, and ATAC-seq libraries. c leChRO-seq signal at the Atr locus for LZ (top), P (center), and D (bottom). dREG peaks (teal) are shown for each prophase I substage. TSSs overlapping with dREG peak calls are shaded in blue. Positive values represent the plus strand and negative values represent the minus strand. d Violin plots of pause index values calculated from the ratio of pause peak density to gene body density of leChRO-seq reads on the autosomes. ****p < 0.0001, two-sided Wilcoxon matched-pairs signed rank test. Median value is indicated by the horizontal, center black line. The first and third quartile are indicated by the minima and maxima of the boxplot. n = 4 biologically independent samples. Source data are provided as a Source data file. e Left: Metagene plot of median leChRO-seq signal intensity at annotated gene boundaries. LZ: leptonema/zygonema; pachynema: P; diplonema: D. Right: Inset of leChRO-seq signal for LZ, P, and D at the TSS + 250 bp.
Fig. 3
Fig. 3. Transcriptional changes between prophase I substages.
a MA plots showing the DEseq2-based differential expression analysis of leChRO-seq read counts within the gene bodies of all annotated genes comparing leptonema/zygonema and pachynema (left) and pachynema and diplonema (right). Differentially expressed genes are shaded in red on the MA plot. b Trajectories of leChRO-seq read density for individual differentially expressed genes for tuPAC (top) and sstPAC (bottom) identified in (c). c Heatmap of log2-transformed fold changes of nascent RNA transcripts enriched or depleted in the selected gene regions for all differentially expressed genes in prophase I identified with DESeq2. Genes were ranked according to changes in leChRO-seq read densities at the TSS + 250 bp, gene body, and post PAS between prophase I substages. Read counts for pachynema (P) and diplonema (D) were normalized to the read counts for leptonema/zygonema (LZ). d Box and whisker plots of pause index values calculated from the ratio of pause peak density to gene body density of leChRO-seq reads for clusters tuPAC and sstPAC. ****p < 0.0001, two-sided Wilcoxon matched-pairs signed rank test. Median value is indicated by the horizontal, center black line. The first and third quartile are indicated by the minima and maxima of the boxplot. Whiskers represent 10–90 percentile. n = 4 biologically independent samples. Source data are provided as a Source data file. e Box and whisker plots of post PAS retention index calculated from the ratio of the leChRO-seq density in the gene body to that in the 3′ end of the gene to 5000 bp downstream for clusters tuPAC and sstPAC. *p-value = 0.0176, two-sided Wilcoxon matched-pairs signed rank test. Median value is indicated by the horizontal, center black line. The first and third quartile are indicated by the minima and maxima of the boxplot. Whiskers represent 10–90 percentile. n = 4 biologically independent samples. Source data are provided as a Source data file. f, g Gene ontology analysis for tuPAC (f) and sstPAC (g) from the heatmap in (c). Gene ontology processes are ranked by Benjamini–Hochberg adjusted p-value and the ratio of the number of genes in each gene ontology to the number of total genes in each cluster. Statistical testing was performed with an over representation analysis (ORA) using a one-sided Fisher’s exact test.
Fig. 4
Fig. 4. A-MYB and BRDT co-occupy the transcription start sites of differentially expressed genes with higher levels of 5′ Pol II density.
a Transcription factor binding motif enrichment revealed that the MYB transcription factor family displayed the most significant enrichment in differentially transcribed transcriptional regulatory elements in pachytene spermatocytes (FDR < 0.01; HOMER; one-sided Fisher’s Exact Test). The MYB transcription factor binding motifs were identified by HOMER. b, d The percent of A-MYB (b) or BRDT (d) ChIP-seq peaks overlapping with the transcription start site of genes in tuPAC, sstPAC, or all transcription units. Statistical analyses comparing the percent of A-MYB or BRDT peaks overlapping with the TSSs of genes in tuPAC and sstPAC used a two-sided Fisher’s exact test. Statistical analyses comparing the percent of A-MYB or BRDT peaks overlapping with the TSSs of genes in tuPAC or sstPAC and all TUs used the Chi-squared test with Yates’ correction. ****p-value <0.00001. n = 4 biologically independent samples. c cnetplot representing the clustering of A-MYB target genes based on gene ontology enrichment analysis. e Representative overlap of A-MYB or BRDT ChIP-seq peaks at genes in tuPAC, sstPAC, or all transcription units. fh Violin plots of the pausing indices for genes bound by A-MYB or BRDT or not bound by A-MYB or BRDT (All TUs) calculated from the ratio of pause peak density to gene body density of leChRO-seq reads. ****p < 0.0001, two-sided Wilcoxon matched-pairs signed rank test. Source data are provided as a Source data file. i Representative example of A-MYB and BRDT co-binding at the transcription start site of Casc5, a gene found in tuPAC. j A model for the A-MYB dependent recruitment of BRDT to a gene with high levels of 5′ Pol II density in pachynema. We posit that BRDT plays a key role in the regulated release of paused Pol II during prophase I. Created with BioRender.com.
Fig. 5
Fig. 5. BRDT inhibition with the small molecule, JQ1, results in altered Pol II pause-release.
a Schematic of experimental design for inhibition of BRDT with the small molecule, JQ1. 7-week-old male mice were injected intraperitoneally (i.p.) with JQ1 or vehicle solution daily for 3 weeks. Created with BioRender.com. b, c Immunolocalization of SYCP3 (green) and Ser5P (b) and Ser2P (c) (magenta) in pachytene (top) and diplotene (bottom) spermatocytes from JQ1-treated and vehicle-treated male mice. The X and Y chromosomes are enclosed within white dotted circles. d, e Quantification of signal intensity for Ser5P and Ser2P immunofluorescence staining of pachytene (left) and diplotene (right) cells from JQ1 and vehicle-treated male mice. Average intensity is shown, and error bars represent the standard deviation. Samples were obtained from three biological replicates. Arb. units = arbitrary units. Source data are provided as a Source data file. d n = 66 vehicle-treated and 160 JQ1-treated pachytene spermatocytes; n = 29 vehicle-treated and 80 JQ1-treated diplotene spermatocytes. e n = 34 vehicle-treated and 148 JQ1-treated pachytene spermatocytes; n = 19 control and 66 JQ1-treated diplotene spermatocytes. ****p-value <0.0001, Mann–Whitney U test.
Fig. 6
Fig. 6. Reprogramming of meiotic chromatin architecture is facilitated by A-MYB binding.
a Reads per kilobase million (RPKM)-normalized ATAC-seq signal at the Mus81 locus for leptonema/zygonema (top), pachynema (center), and diplonema (bottom). A-MYB ChIP-seq peaks are shown. bd Stage-resolved RPKM-normalized ATAC-seq signal at H3K4me3 ChIP-seq peaks (b); transcribed ATAC-seq peaks that overlap with annotated transcription start sites (TSSs) (c); non-transcribed ATAC-seq peaks that overlap with TSSs (d). Mean ± 95% confidence intervals are represented on bar graphs. n = 4 biologically independent samples. ****p < 0.0001, two-sided Wilcoxon matched-pairs signed rank test. Source data are provided as a Source data file. e Metaplots (top) and heatmaps (bottom) of RPKM-normalized ATAC-seq signal ± 10 kb from the center of A-MYB ChIP-seq peaks for leptonema/zygonema, pachynema, and diplonema. Peaks are sorted in all prophase I substages by decreasing order of ATAC-seq signal intensity in pachynema.
Fig. 7
Fig. 7. Nascent transcription and chromatin accessibility at DSB and meiotic recombination hotspots.
a Metaplots (top) and heatmaps (bottom) of RPKM-normalized ATAC-seq signal centered on DSB hotspots inferred from SPO11 oligos for leptonema/zygonema (LZ), pachynema (P), and diplonema (D). Peaks are sorted in all prophase I substages by decreasing order of ATAC-seq signal intensity in leptonema/zygonema. b Metaplot (top) and heatmap (bottom) of H3K4me3 signal centered on DSB hotspots for LZ. c, d Metaplots of the average leChRO-seq signal centered on annotated TSSs (C) and SPO11 oligos (D) for LZ, P, and D. e Percentage of ATAC-seq peaks that are also transcribed based on observed overlap with dREG peaks (dot) and overlap of dREG peaks with randomly shuffled ATAC-seq peaks over 1000 iterations (violin plot). Statistical testing was performed with a one-sided Fisher’s exact test; p = 0.000999. f Observed overlap of DSB hotspots inferred from SPO11 oligo data with dREG and ATAC-seq peaks (dot) and with randomly shuffled dREG and ATAC-seq peaks (violin plot). Empirical p-value is reported. Statistical testing was performed with a one-sided Fisher’s exact test; p = 0.000999. Source data are provided as a Source data file.

References

    1. Griswold MD. Spermatogenesis: the commitment to meiosis. Physiol. Rev. 2016;96:1–17. doi: 10.1152/physrev.00013.2015. - DOI - PMC - PubMed
    1. Gray S, Cohen PE. Control of meiotic crossovers: from double-strand break formation to designation. Annu. Rev. Genet. 2016;50:175–210. doi: 10.1146/annurev-genet-120215-035111. - DOI - PMC - PubMed
    1. Keeney S. Spo11 and the formation of DNA double-strand breaks in meiosis. Genome Dyn. Stab. 2008;2:81–123. doi: 10.1007/7050_2007_026. - DOI - PMC - PubMed
    1. Baudat F, Imai Y, de Massy B. Meiotic recombination in mammals: localization and regulation. Nat. Rev. Genet. 2013;14:794–806. doi: 10.1038/nrg3573. - DOI - PubMed
    1. Page SL, Hawley RS. The genetics and molecular biology of the synaptonemal complex. Annu. Rev. Cell Dev. Biol. 2004;20:525–558. doi: 10.1146/annurev.cellbio.19.111301.155141. - DOI - PubMed

Publication types