. 2023 Mar 29;14(1):1752.
doi: 10.1038/s41467-023-37446-4.

MS2Query: reliable and scalable MS2 mass spectra-based analogue search

Affiliations

MS2Query: reliable and scalable MS2 mass spectra-based analogue search

Niek F de Jonge et al. Nat Commun. .

Abstract

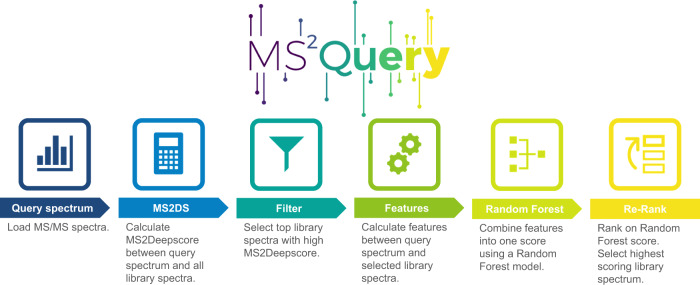
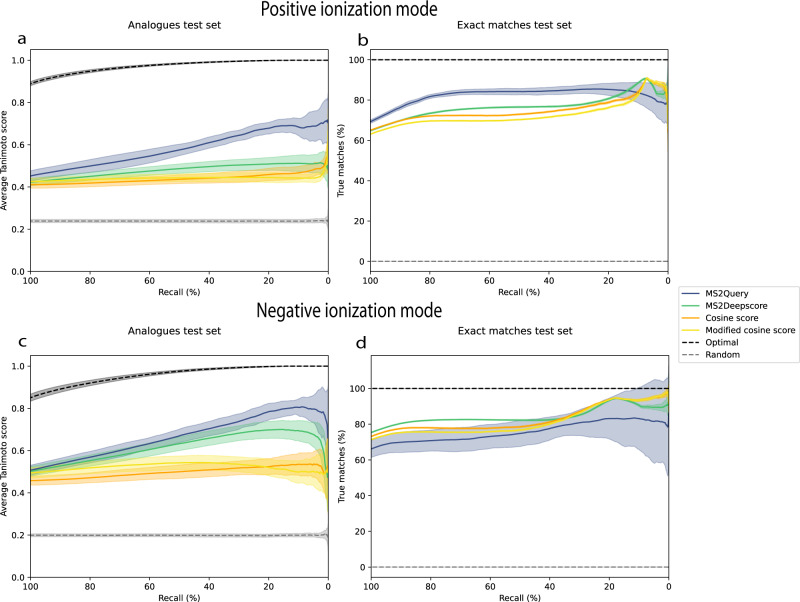
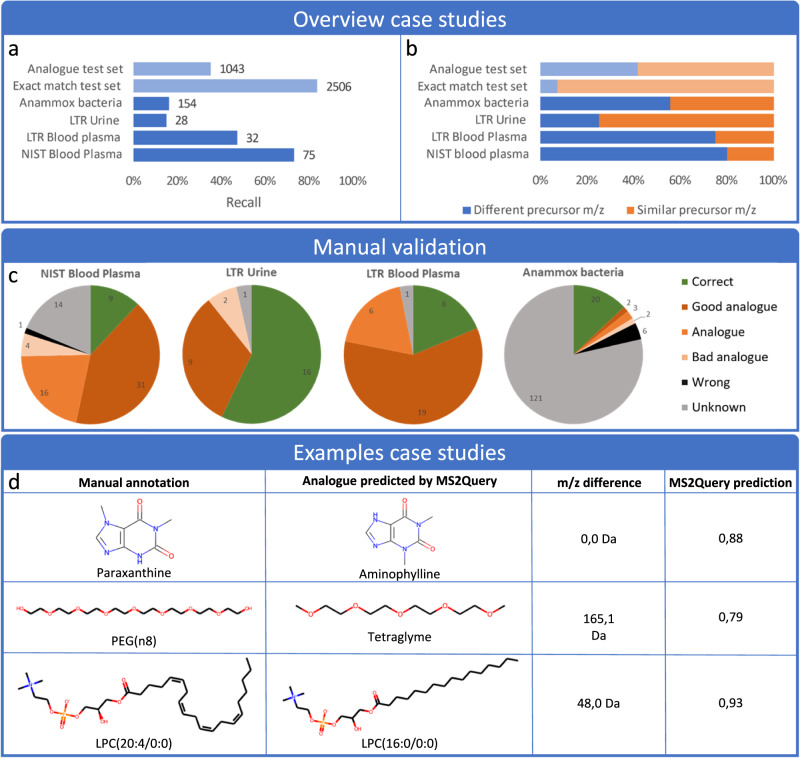
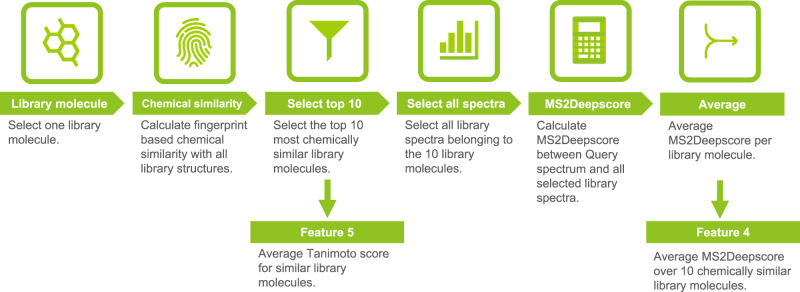
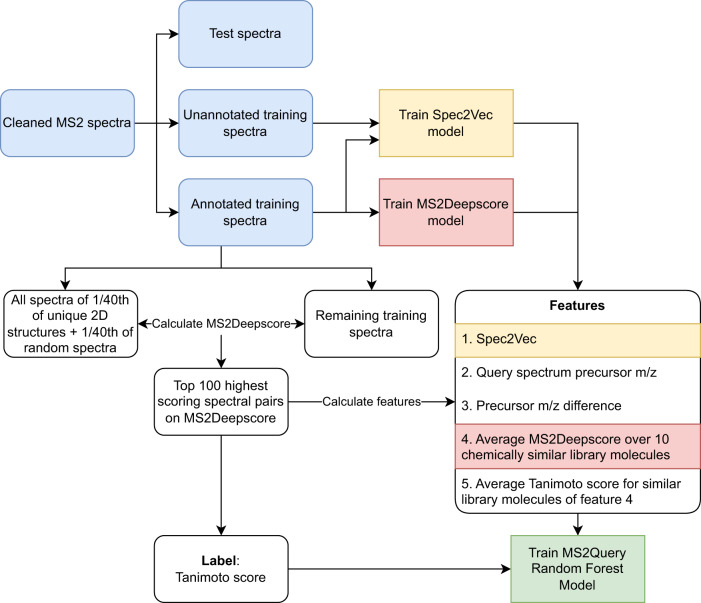
Metabolomics-driven discoveries of biological samples remain hampered by the grand challenge of metabolite annotation and identification. Only few metabolites have an annotated spectrum in spectral libraries; hence, searching only for exact library matches generally returns a few hits. An attractive alternative is searching for so-called analogues as a starting point for structural annotations; analogues are library molecules which are not exact matches but display a high chemical similarity. However, current analogue search implementations are not yet very reliable and relatively slow. Here, we present MS2Query, a machine learning-based tool that integrates mass spectral embedding-based chemical similarity predictors (Spec2Vec and MS2Deepscore) as well as detected precursor masses to rank potential analogues and exact matches. Benchmarking MS2Query on reference mass spectra and experimental case studies demonstrate improved reliability and scalability. Thereby, MS2Query offers exciting opportunities to further increase the annotation rate of metabolomics profiles of complex metabolite mixtures and to discover new biology.


Conflict of interest statement

JJJvdH is currently a member of the Scientific Advisory Board of NAICONS Srl., Milano, Italy. All other authors declare no conflict of interest.

Figures

Fig. 1
Fig. 1. Schematic workflow of MS2Query.
MS2Query searches for both exact matches and analogues in a reference library. First, potential candidates are selected based on MS2Deepscore, followed by re-ranking the spectra by using a random forest model.
Fig. 2
Fig. 2. MS2Query benchmarking results.
MS2Query is more accurate for finding analogues than using MS2Deepscore or modified cosine score and is more accurate at predicting exact matches in positive mode at high recall than using MS2Deepscore, the cosine score or the modified cosine score. The threshold for MS2Query, MS2Deepscore, cosine and modified cosine is varied, resulting in different recalls. The random results show the results if random matches would be selected and the optimal results show the performance if the best structural match in the library was selected. Results of 20-fold cross-validation are shown. The mean of these 20 test sets are shown and the standard deviation is highlighted. Source data are provided as a Source Data file. a The ‘analogues test set’ is used with spectra that have no exact match in the library, therefore the best possible match is always an analogue. For MS2Deepscore, cosine score and modified cosine score, library spectra are first filtered on a mass difference of 100 Da. The relationship between recall and average Tanimoto score (chemical similarity) is plotted. For each threshold the average over the Tanimoto scores between the correct molecular structure and the predicted analogues is calculated. b The ‘exact matches test set’ is used, all these test spectra have at least 1 exact structural match in the reference library. For MS2Deepscore and modified cosine score, library spectra are first filtered on a mass difference of 0.25 Da, while MS2Query does not use any pre-filtering on mass difference, and uses the exact same settings as for the analogue search. The percentage of true positives is given. A match is marked as true positive if the 2D structure is correct. c The same plot as Fig. 2a, but for a model trained on spectra in negative ionization mode. d The same plot as Fig. 2b, but for a model trained on spectra in negative ionization mode.
Fig. 3
Fig. 3. Highlights of the results of the case studies.
The same MS2Query model was used for all test sets, for more details about the model used for the case studies, see Supplementary Note 1. A minimal threshold of 0.633 for the random forest score was used to determine if an analogue was selected. The threshold of 0.633 was selected, since this resulted in a recall of 35% for the “analogue test set”. Source data are provided as a Source Data file. a The variation of recall across case studies using the same settings. b The percentage of query spectra with a predicted analogue (precursor m/z > 1 Da) is compared to the percentage of spectra with an exact match predicted (precursor m/z < 1 Da) c Results were manually validated based on the retention time MS1 mass and MS2 spectra, by comparing to online libraries or in-house reference standards. These reference standards were used to judge the quality of the predicted analogues. In the Supplementary Note 6 more details about the validation can be found. For the anammox bacteria sample set, tentative validation was attempted for 50 features. d Three examples of predictions for mass spectra in the case studies. These examples came from the case study test sets LTR Urine, LTR Blood Plasma, and NIST Blood Plasma in that order. For LPC(20:4/0:0) the exact position of the double bonds could not be determined and was therefore guessed for the visualization.
Fig. 4
Fig. 4. Workflow for calculating two input features of the random forest model.
Feature 5 is the Average Tanimoto score for similar library molecules and feature 4 is the average MS2Deepscore over 10 chemically similar library molecules.
Fig. 5
Fig. 5. Workflow for MS2Query model training.
Workflow for training the MS2Deepscore model, the Spec2Vec model and the random forest model used by MS2Query. Rounded boxes indicate mass spectral handling steps, whereas squared boxes are indicating machine learning model training steps. The blue colour highlights preparation steps of the mass spectral data prior to model training, the yellow colour the Spec2Vec model, the red colour the MS2DeepScore model, and the green colour the MS2Query model.

References

    1. Heiles S. Advanced tandem mass spectrometry in metabolomics and lipidomics—methods and applications. Anal. Bioanal. Chem. 2021;413:5927–5948. doi: 10.1007/s00216-021-03425-1. - DOI - PMC - PubMed
    1. Beniddir MA, et al. Advances in decomposing complex metabolite mixtures using substructure- and network-based computational metabolomics approaches. Nat. Prod. Rep. 2021;38:1967–1993. doi: 10.1039/D1NP00023C. - DOI - PMC - PubMed
    1. Jarmusch SA, van der Hooft JJJ, Dorrestein PC, Jarmusch AK. Advancements in capturing and mining mass spectrometry data are transforming natural products research. Nat. Prod. Rep. 2021;38:2066–2082. doi: 10.1039/D1NP00040C. - DOI - PMC - PubMed
    1. Aron AT, et al. Reproducible molecular networking of untargeted mass spectrometry data using GNPS. Nat. Protoc. 2020;15:1954–1991. doi: 10.1038/s41596-020-0317-5. - DOI - PubMed
    1. Stein S. Mass spectral reference libraries: an ever-expanding resource for chemical identification. Anal. Chem. 2012;84:7274–7282. doi: 10.1021/ac301205z. - DOI - PubMed

Publication types

Substances