. 2023 Mar 29;14(1):1754.
doi: 10.1038/s41467-023-37212-6.

Real-time insight into the multistage mechanism of nanoparticle exsolution from a perovskite host surface

Affiliations

Real-time insight into the multistage mechanism of nanoparticle exsolution from a perovskite host surface

Eleonora Calì et al. Nat Commun. .

Abstract

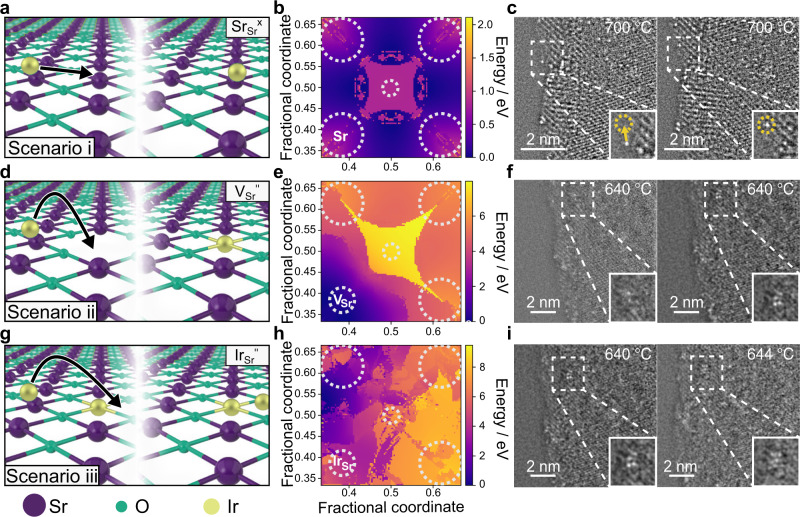
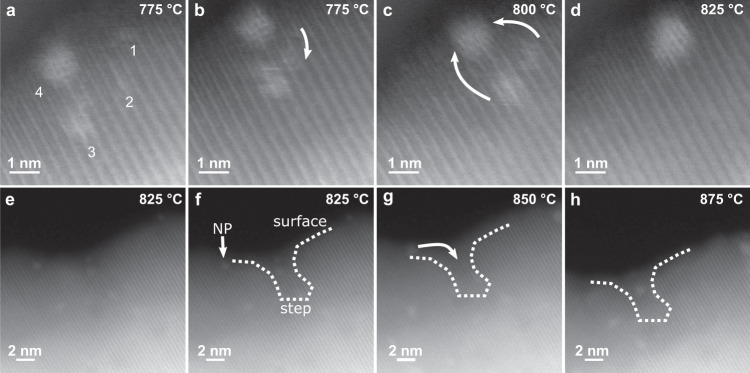
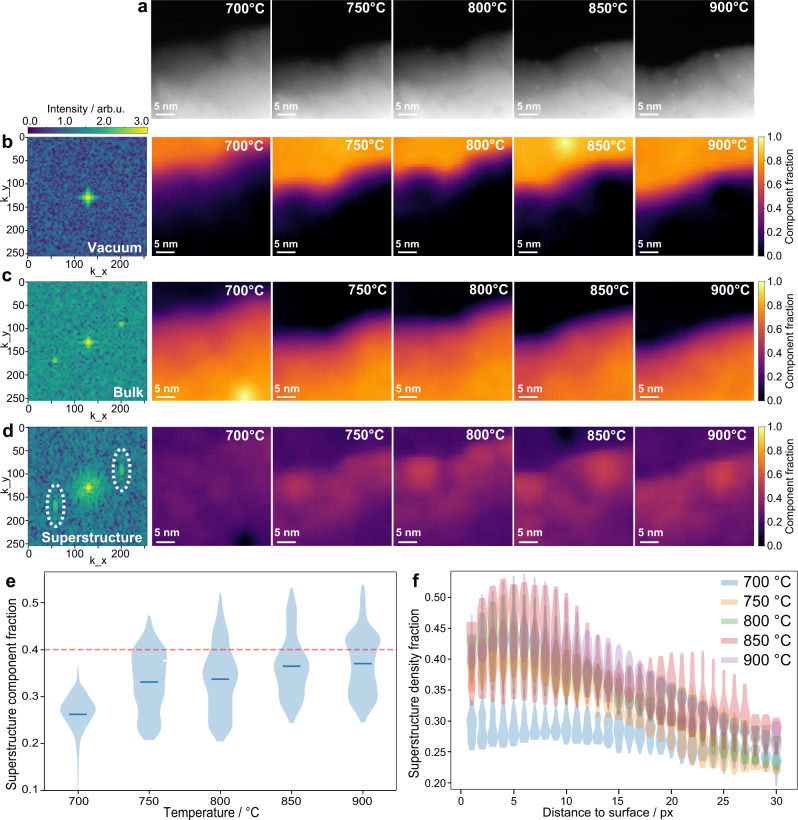
In exsolution, nanoparticles form by emerging from oxide hosts by application of redox driving forces, leading to transformative advances in stability, activity, and efficiency over deposition techniques, and resulting in a wide range of new opportunities for catalytic, energy and net-zero-related technologies. However, the mechanism of exsolved nanoparticle nucleation and perovskite structural evolution, has, to date, remained unclear. Herein, we shed light on this elusive process by following in real time Ir nanoparticle emergence from a SrTiO3 host oxide lattice, using in situ high-resolution electron microscopy in combination with computational simulations and machine learning analytics. We show that nucleation occurs via atom clustering, in tandem with host evolution, revealing the participation of surface defects and host lattice restructuring in trapping Ir atoms to initiate nanoparticle formation and growth. These insights provide a theoretical platform and practical recommendations to further the development of highly functional and broadly applicable exsolvable materials.


Conflict of interest statement

The authors declare no competing interests.

Figures

Fig. 1
Fig. 1. Evaluation of the Ir nanoparticle nucleation mechanism at the initial stages of exsolution in a stoichiometric Ir-doped SrTiO3 perovskite.
Schematics of the three considered Ir migration scenarios of a slab model (001) SrTiO3 surface: a migration with no defects (scenario i, SrSrx), d migration with a surface Sr vacancy (scenario ii, VSr”), g and migration where another Ir+3 ion has substituted a surface Sr ion (scenario iii, IrSr”). Ir, Sr, and O are represented by gold, purple, and green atoms, respectively. b, e, h Energy profiles of the Ir3+ ion over the three surface models represented in (a, d, g), respectively, with dotted circles to indicate the atomic positions (Sr: corner sites, O: centre, VSr” or IrSr”: bottom left in (e) and (h), respectively), as can be also visualised in the top-view atomic slab in Supplementary Fig. 2b. c, f, i Inverse fast Fourier transform HAADF-STEM images (after bandpass filtering) acquired during in situ monitoring of a [−3 1 2] zone axis grain at 700 °C (c), 640 °C (f), and 640, 644 °C (i) during in situ heating from 300 °C–700 °C at 2 °C min−1. The left and right images show experimental evidence for the modelled scenarios (i–iii) illustrated in (a, d, g), with boxed ROIs zoomed in the bottom right white boxes showing Ir single atom movement on the surface (highlighted by the yellow arrow and circles in (c)), Ir atom ‘trapped’ by a surface defect (f), and Ir cluster growth at the initial nucleation site over temperature (i), respectively. Source data are provided as a Source data file.
Fig. 2
Fig. 2. In situ monitoring of Ir nanoparticle nucleation during ultra-high-vacuum exsolution.
ac STEM micrographs of a SrIr0.005Ti0.995O3 grain monitored at 400 °C (a), magnified view of ROI at 400 °C (b), and 700 °C (c). df STEM micrographs after a 2 h dwell at 700 °C with small Ir clusters labelled with arrows (d), at 725 °C (e), and 750 °C (f). gi High-resolution images of the Ir cluster boxed in (d) at 700 °C (g), 725 °C (h), and 750 °C (i). jl Models of Ir unit cells measuring ≈0.7, ≈1.4, and ≈2 nm across in (j), (k), and (l), respectively. No socketing/epitaxy is possible in (j) with only 14 Ir atoms. Incipient epitaxy starts being observed for the array in (k), but the cluster is still small enough to migrate along the surface. Stronger epitaxy is observed (172 Ir atoms cluster) in (l) and socketing becomes more likely. Source data are provided as a Source data file.
Fig. 3
Fig. 3. Movement of Ir atomic clusters on the surface of the host.
ad STEM micrographs of the surface of a SrIr0.005Ti0.995O3 grain monitored in situ at 775–825 °C. Ir atomic clusters (1–4) are labelled, with clusters 1 and 2 first coalescing, before further combining with clusters 3 and 4. eh STEM micrographs of a stepped surface of a SrIr0.005Ti0.995O3 grain monitored in situ at 825–875 °C. The labelled nanoparticle (NP) travels along the surface and enters the surface ‘step’. The phenomenon presented in (eh) and further movement of clusters similar to what presented in (ad) are also visible in Supplementary Movie 1. Source data are provided as a Source data file.
Fig. 4
Fig. 4. Analysis of in situ STEM images via the N-FINDR method.
a STEM images of a 0.5% Ir-doped STO grain used for the N-FINDR analysis acquired in situ at 700–900 °C. bd The three endmembers (vacuum (b), bulk (c), and superstructure (d)) extracted through the sliding FFT window approach, with corresponding resulting spatial abundances for each temperature targeted between 700 and 900 °C. The superstructure component is dashed circled for easier visualisation. e Plot of the density of the superstructure component as a function of target temperature. Red dashed line is at 40% fraction as a guide to the eye. f Violin plot of the density of the superstructure component (generated from the analysis of intensity histograms extracted from the raw STEM images) as a function of distance from the surface of the monitored grain for each targeted temperature between 700 and 900 °C, with different colours representing the different target temperatures from which the abundances were drawn. Original image is 1024 pixels across (i.e., 34.4 nm) and pixel size ≈0.72 nm. Individual plots for the data in (f) as well as a plot of the mean values for each temperature point are reported in Supplementary Fig. 12. Source data are provided as a Source data file.
Fig. 5
Fig. 5. Clustering of defects observed during in situ exsolution.
al STEM images acquired at different temperatures (from 400 to 1050 °C) during an in situ heating experiment of a 0.5% Ir-doped STO grain after applying a background subtraction algorithm. The arrows in (ad) highlight the presence and increase in frequency with temperature of the defect clusters. The circles in (f) and (h) highlight some examples of faceting of the clusters, and the squares in (il) examples of the growth of exsolved NPs at defect cluster edges. Source data are provided as a Source data file.
Fig. 6
Fig. 6. Morphology of the perovskite and socket evolution during in situ exsolution.
ac STEM micrographs showing crests formation during the in situ heating of a 0.5% Ir-doped STO grain. The rough surface visible at 750 °C in the squared region in (a) evolves into a more defined faceted morphology at 875 °C (b), as indicated by the arrows. Faceting of the sample surfaces becomes more prominent up to T = 925 °C (c). df The crests’ surface evolves into a sintered-like morphology at higher temperatures, with a rounder shape observed from 975 °C. gi In situ observation of socket evolution of the same sample, from 975 °C (g, h), where no socket is visible, to 1100 °C, where pyramidal base structures have formed to embed the fully exsolved NPs (i), also presented in Supplementary Movie 2. Source data are provided as a Source data file.

References

    1. Neagu D, Tsekouras G, Miller DN, Ménard H, Irvine JTS. In situ growth of nanoparticles through control of non-stoichiometry. Nat. Chem. 2013;5:916–923. doi: 10.1038/nchem.1773. - DOI - PubMed
    1. Kyriakou V, et al. Plasma driven exsolution for nanoscale functionalization of perovskite oxides. Small Methods. 2021;5:2100868. doi: 10.1002/smtd.202100868. - DOI - PubMed
    1. Myung J, Neagu D, Miller DN, Irvine JTS. Switching on electrocatalytic activity in solid oxide cells. Nature. 2016;537:528–531. doi: 10.1038/nature19090. - DOI - PubMed
    1. Tang C, Kousi K, Neagu D, Metcalfe IS. Trends and prospects of bimetallic exsolution. Chem. Eur. J. 2021;27:6666–6675. doi: 10.1002/chem.202004950. - DOI - PMC - PubMed
    1. Neagu, D. et al. Nano-socketed nickel particles with enhanced coking resistance grown in situ by redox exsolution. Nat. Commun. 6, 8120 (2015). - PMC - PubMed